On November 8, the USDA released its monthly World Agricultural Supply and Demand Estimates (WASDE) report. Table 1 provides a summary of the November WASDE estimates for wheat, corn, soybean, and cotton.
Table 1. Wheat, Corn, Soybean, and Cotton Supply, Use, Stocks, and Price Estimates, November 2024 WASDE
| Wheat | Corn | Soybean | Cotton | |
| Production and Supply | ||||
| Planted (million acres) | 46.1 | 90.7 | 87.1 | 11.17 |
| Harvested (million acres) | 38.5 | 82.7 | 86.3 | 8.63 |
| Yield (bu/acre or lb/acre) | 51.2 | 183.1 | 51.7 | 789 |
| Production (millions of bushels or bales) | 1,971 | 15,143 | 4,461 | 14.2 |
| Total Supply (millions of bushels or bales) | 2,788 | 16,928 | 4,818 | 17.4 |
| US Exports and Use | ||||
| Exports (millions of bushels or bales) | 825 | 2,325 | 1,825 | 11.3 |
| Total Use (millions of bushels or bales) | 1,973 | 14,990 | 4,348 | 13.1 |
| Exports % of Total Use | 42% | 16% | 42% | 86% |
| Stocks and Price | ||||
| U.S. Ending Stocks (millions of bushels or bales) | 815 | 1,938 | 470 | 4.3 |
| Foreign Ending Stocks (millions of bushels or bales) | 8,649 | 10,035 | 4,371 | 71.45 |
| U.S. Stocks/Use (%) | 41% | 13% | 11% | 33% |
| U.S. Avg. Season Price ($/bu or $/lb) | $5.60 | $4.10 | $10.80 | $0.66 |
Wheat
Month-over-Month Changes
Limited revisions were made to U.S. wheat supply and demand estimates. Imports increased 5 million bushels, and food use increased 2 million bushels, resulting in a 3 million bushel increase in U.S. projected ending stocks. Limited changes to foreign supply and demand resulted in a 9 million bushel decrease in foreign stocks.
Year-over-Year Changes
Compared to the last marketing year, U.S. production was up 276 million bushels and ending stocks were up 199 million bushels; however, foreign wheat stocks were down 438 million bushels, from 9.087 billion to 8.649 billion.
Price Reaction and Outlook
Prices for the report release day traded mostly flat, with price reaction limited to a 10-15 cents trading range. Overall, the report does not change the outlook for wheat prices.
Corn
Month-over-Month Changes
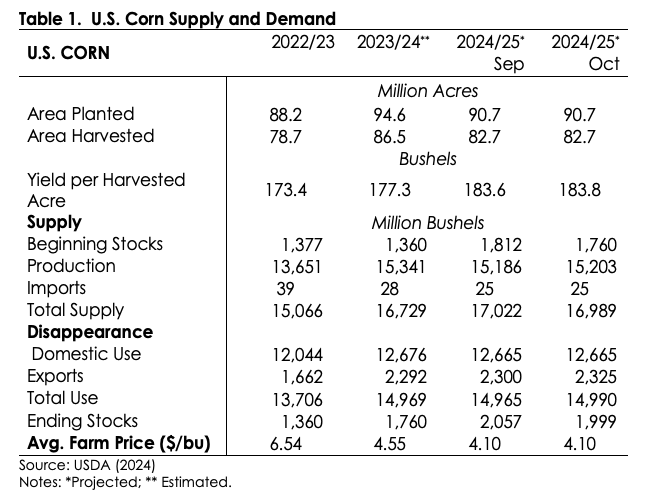
The most substantial revision compared to the previous month was a decrease in the U.S. national average corn yield of 0.7 bu/acre, resulting in a 60-million-bushel decline in production. With use unchanged, ending stocks decreased 60 million bushels to 1.938 billion. Foreign stocks decreased 33 million bushels due primarily to increased corn use in Brazil, Mexico, and Southeast Asia. No production changes were noted in South America.
Year-over-Year Changes
Year-over-year changes show a mixed supply and demand situation. U.S. corn production is estimated to be up 199 million bushels, with exports up 33 million. Net, the projected increase in U.S. ending stocks is 178 million bushels. Foreign stocks are projected to decline 575 million bushels compared to the previous marketing year.
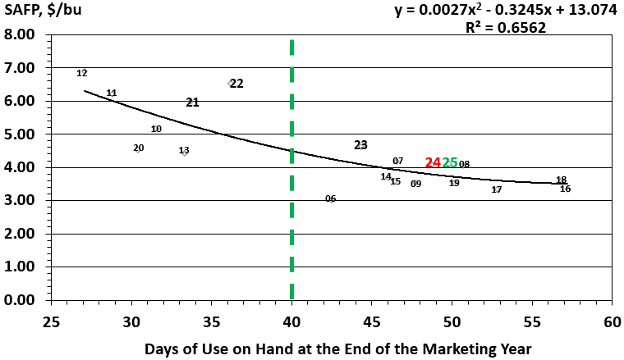
Price Reaction and Outlook
Corn futures prices reacted positively to the report, with prices up a few cents for the day. Overall, the report can be viewed as neutral to slightly bullish for corn prices. The price outlook has not fundamentally changed; however, the report assists in stabilizing the downside of the market.
Soybean
Month-over-Month Changes
The U.S. average soybean yield decreased 1.4 bu/acre to 51.7 bu/acre, resulting in a decline in production of 121 million bushels. Exports and crush were decreased 15 and 25 million bushels, respectively. Projected ending stocks decreased 80 million bushels to 470 million. Foreign projected ending stocks also decreased 26 million bushels. No changes were made to South American production estimates.
Year-over-Year Changes
Compared to the previous marketing year, U.S. soybean production is estimated up 371 million bushels, and total use is up 243 million bushels. U.S. and foreign ending stocks are estimated up 128 million bushels and 582 million bushels, respectively.
Price Reaction and Outlook
Futures prices reacted positively to the WASDE report, with prices up 3-5 cents for the day. Overall, the report was slightly bullish for soybean prices; however, price direction will be dictated by crop progress in South America.
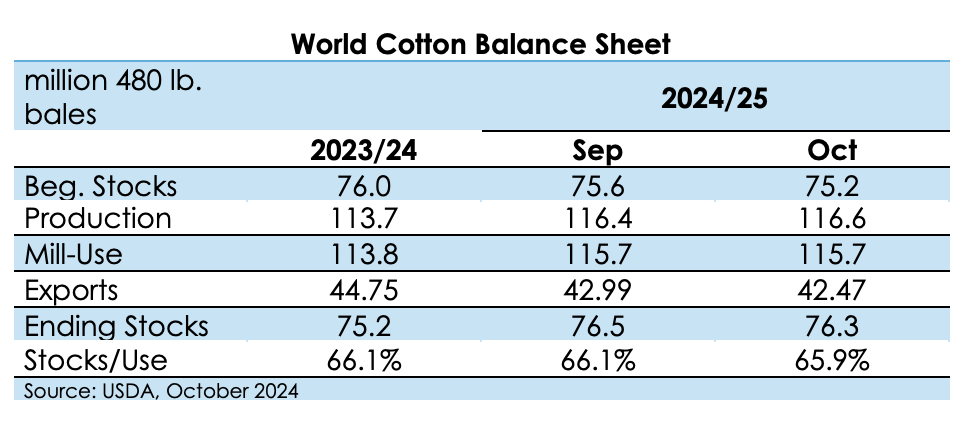
Cotton
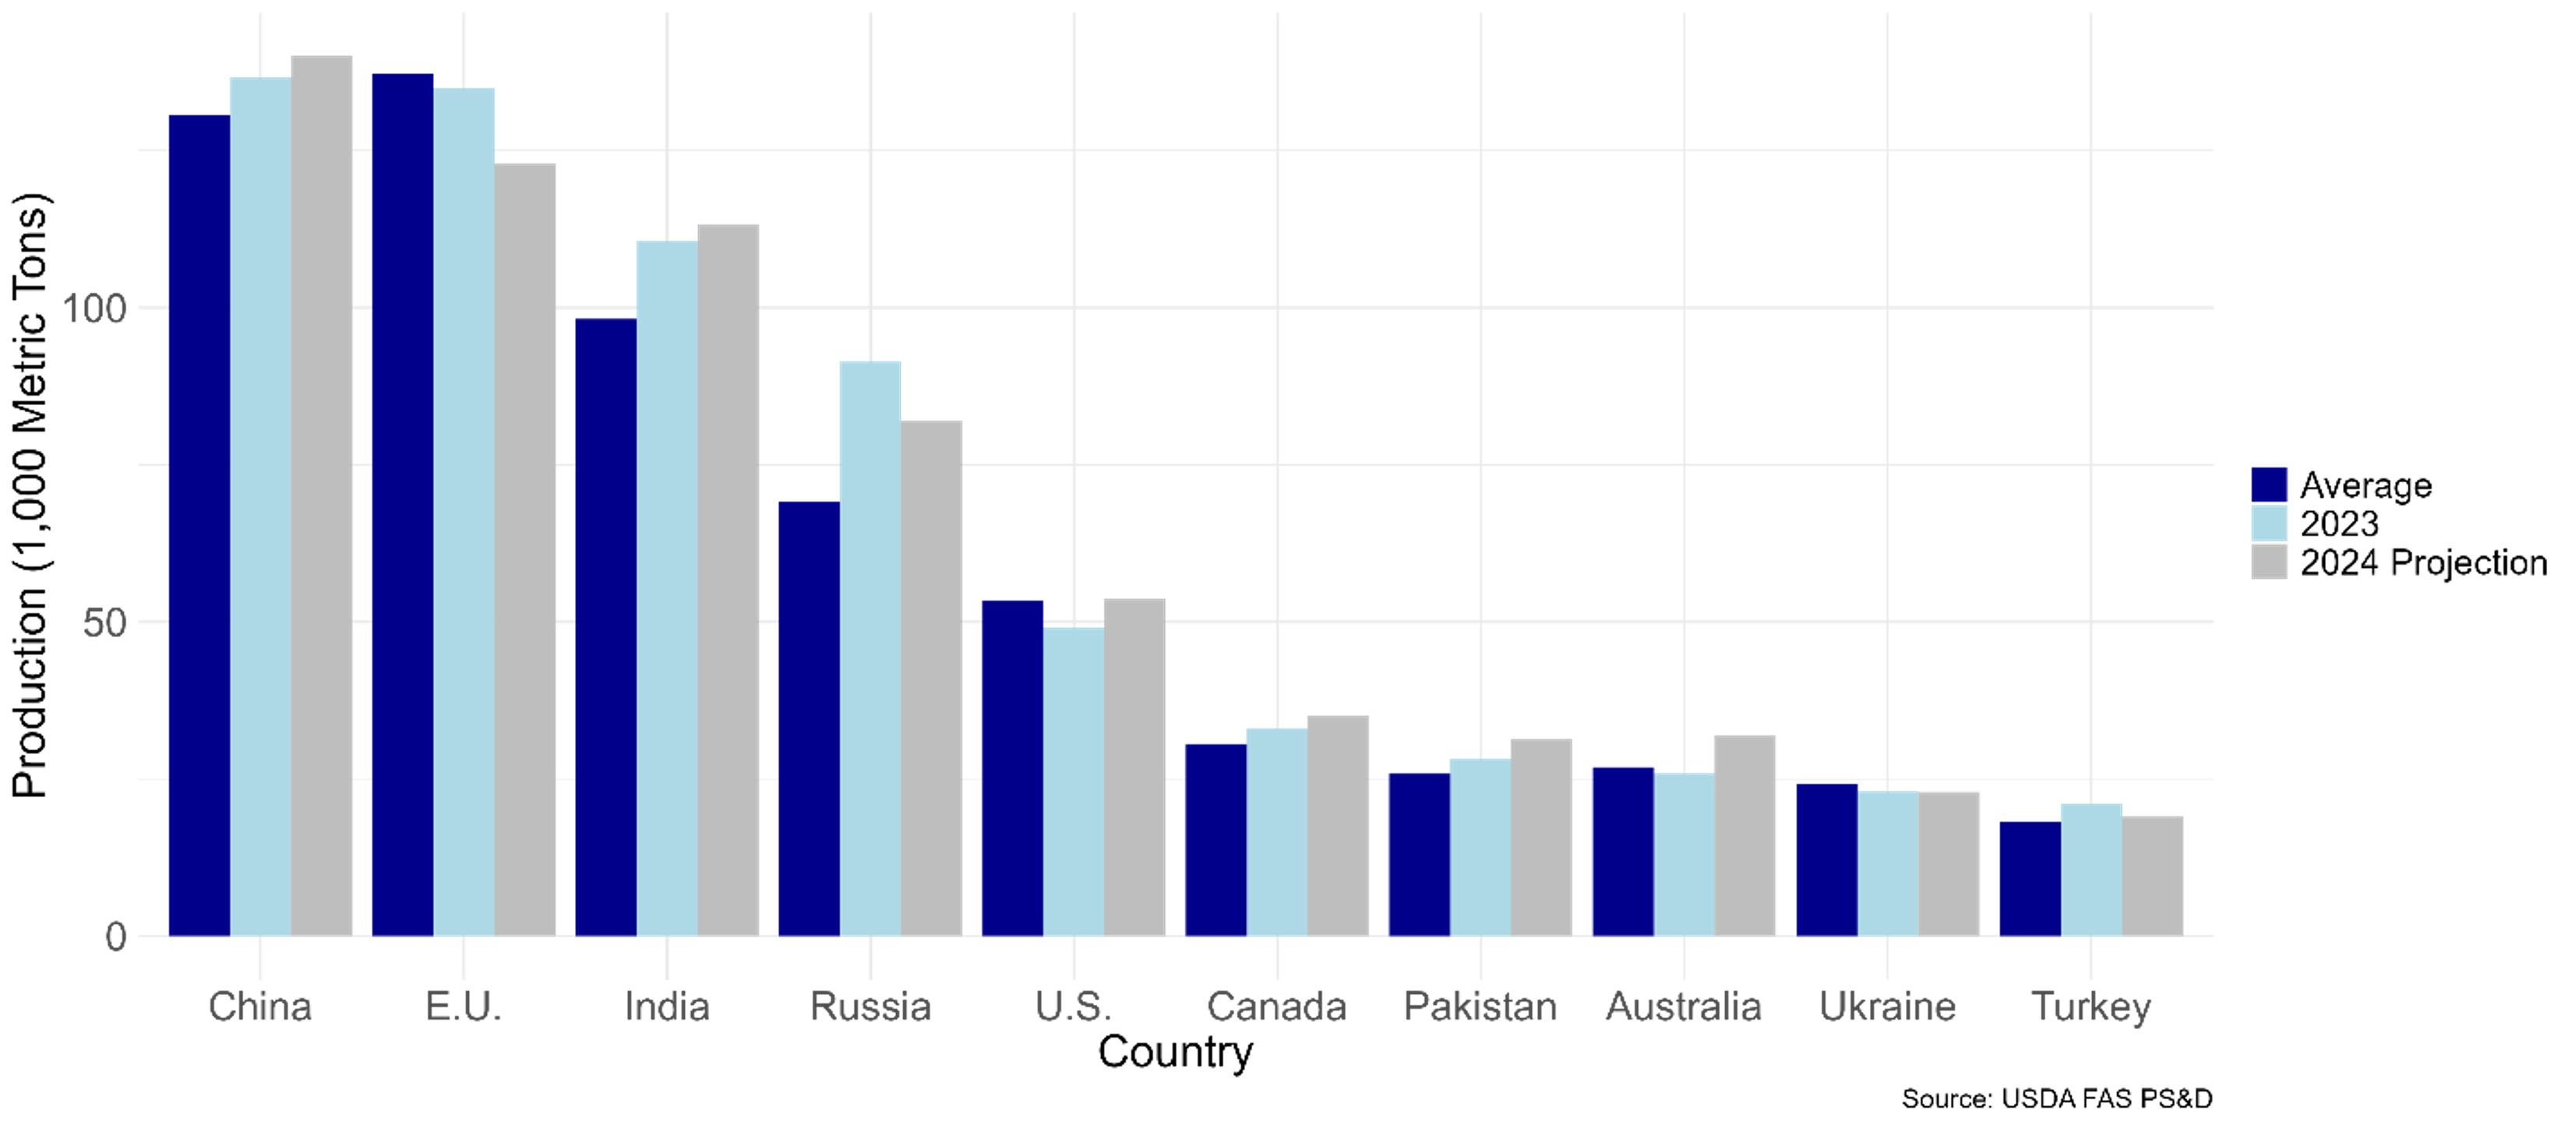
Month-over-Month Changes
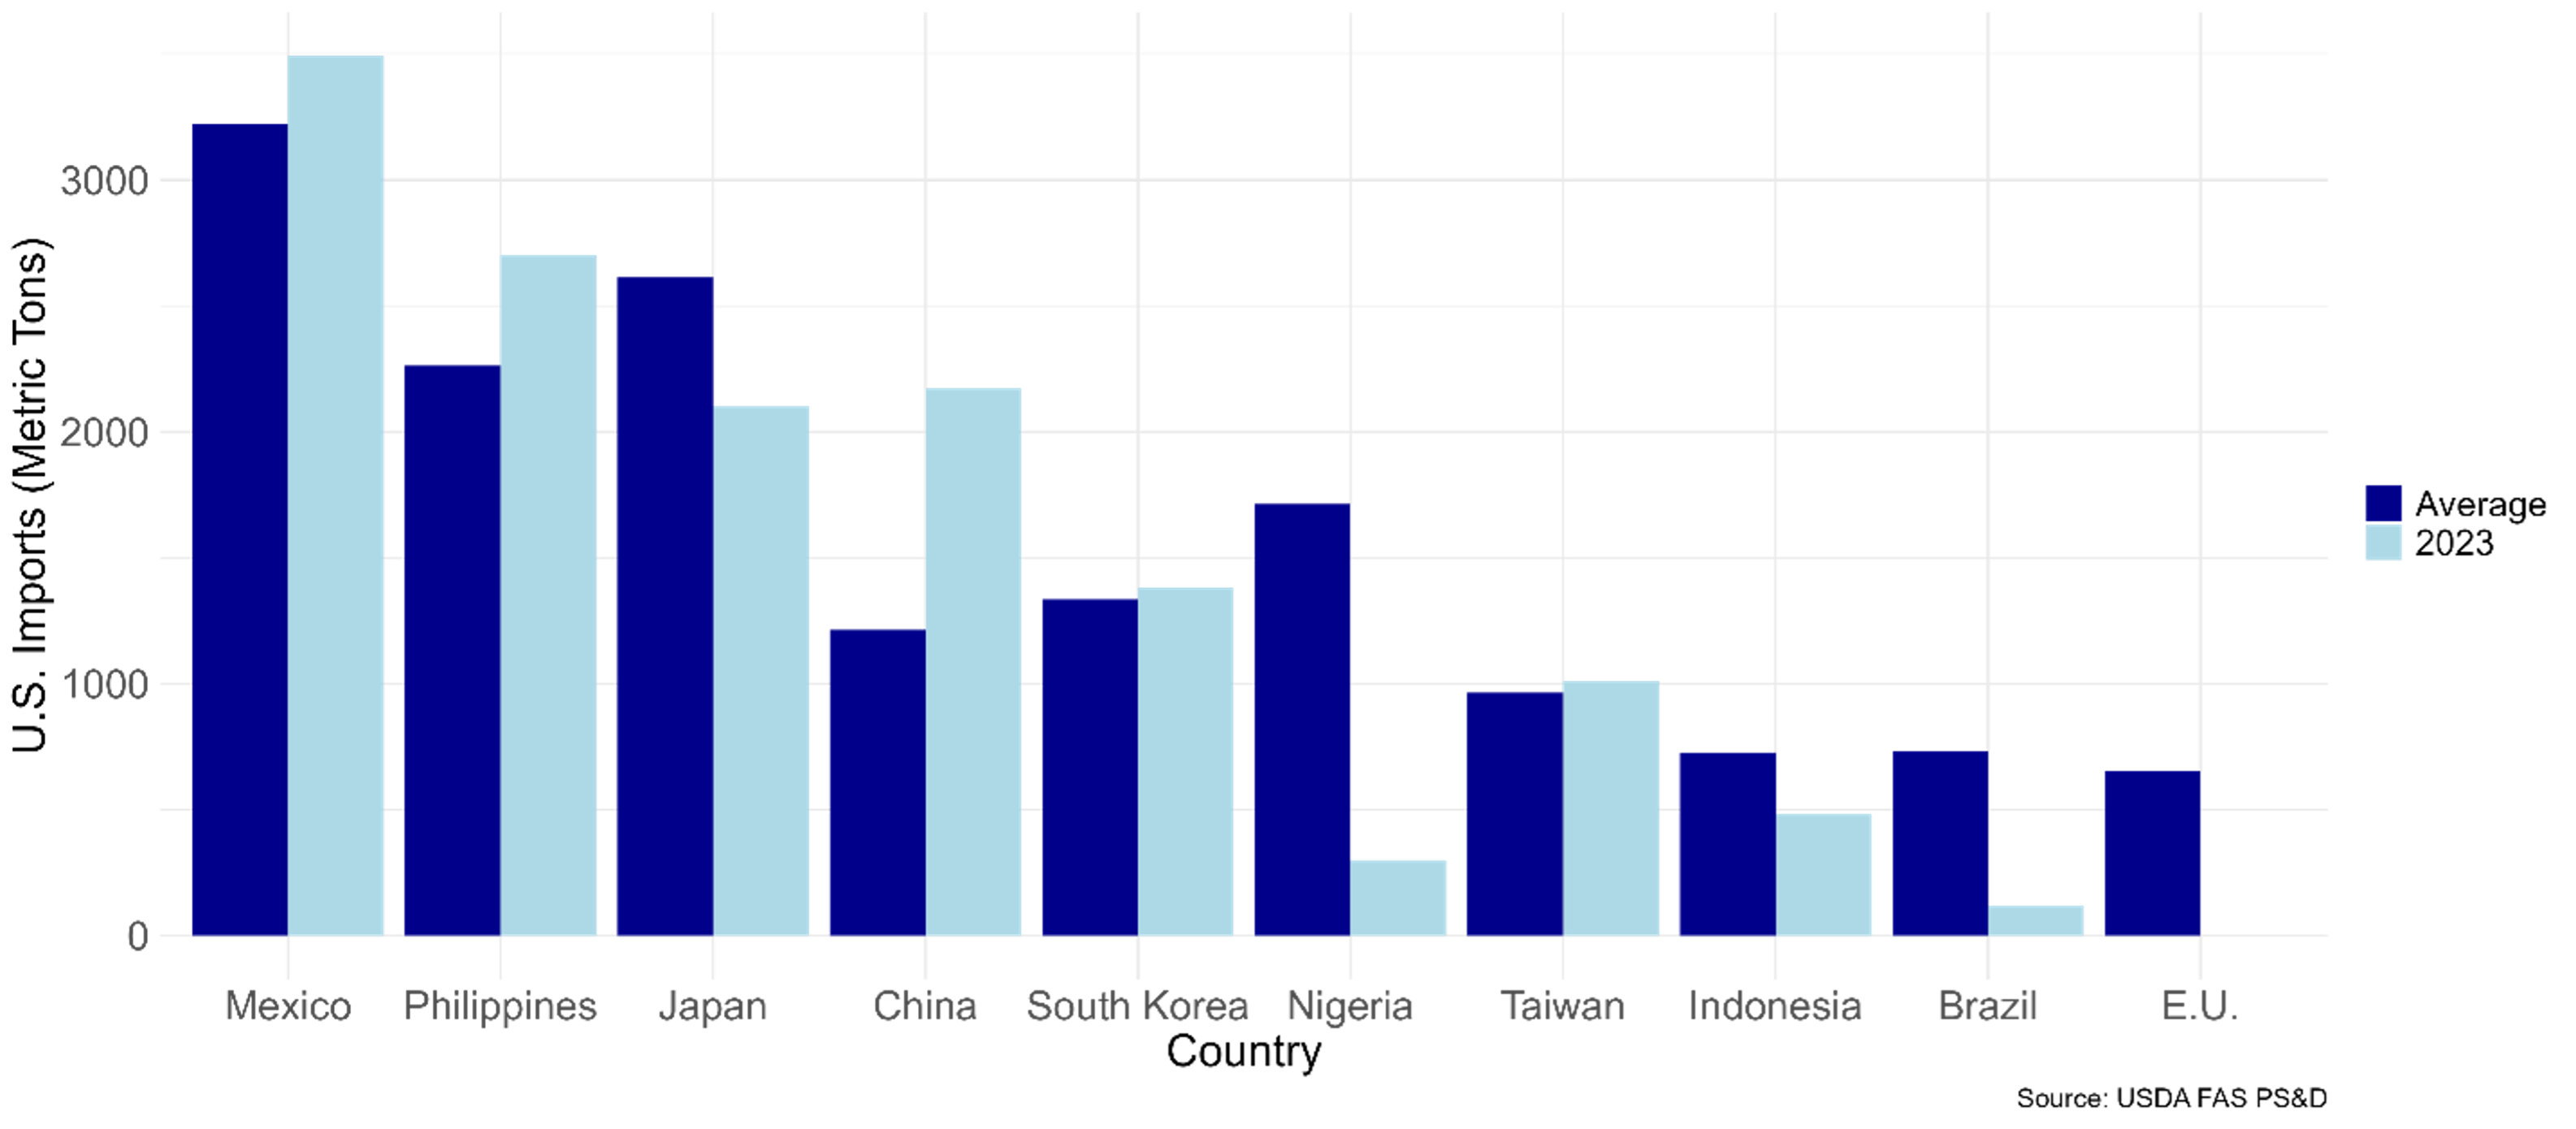
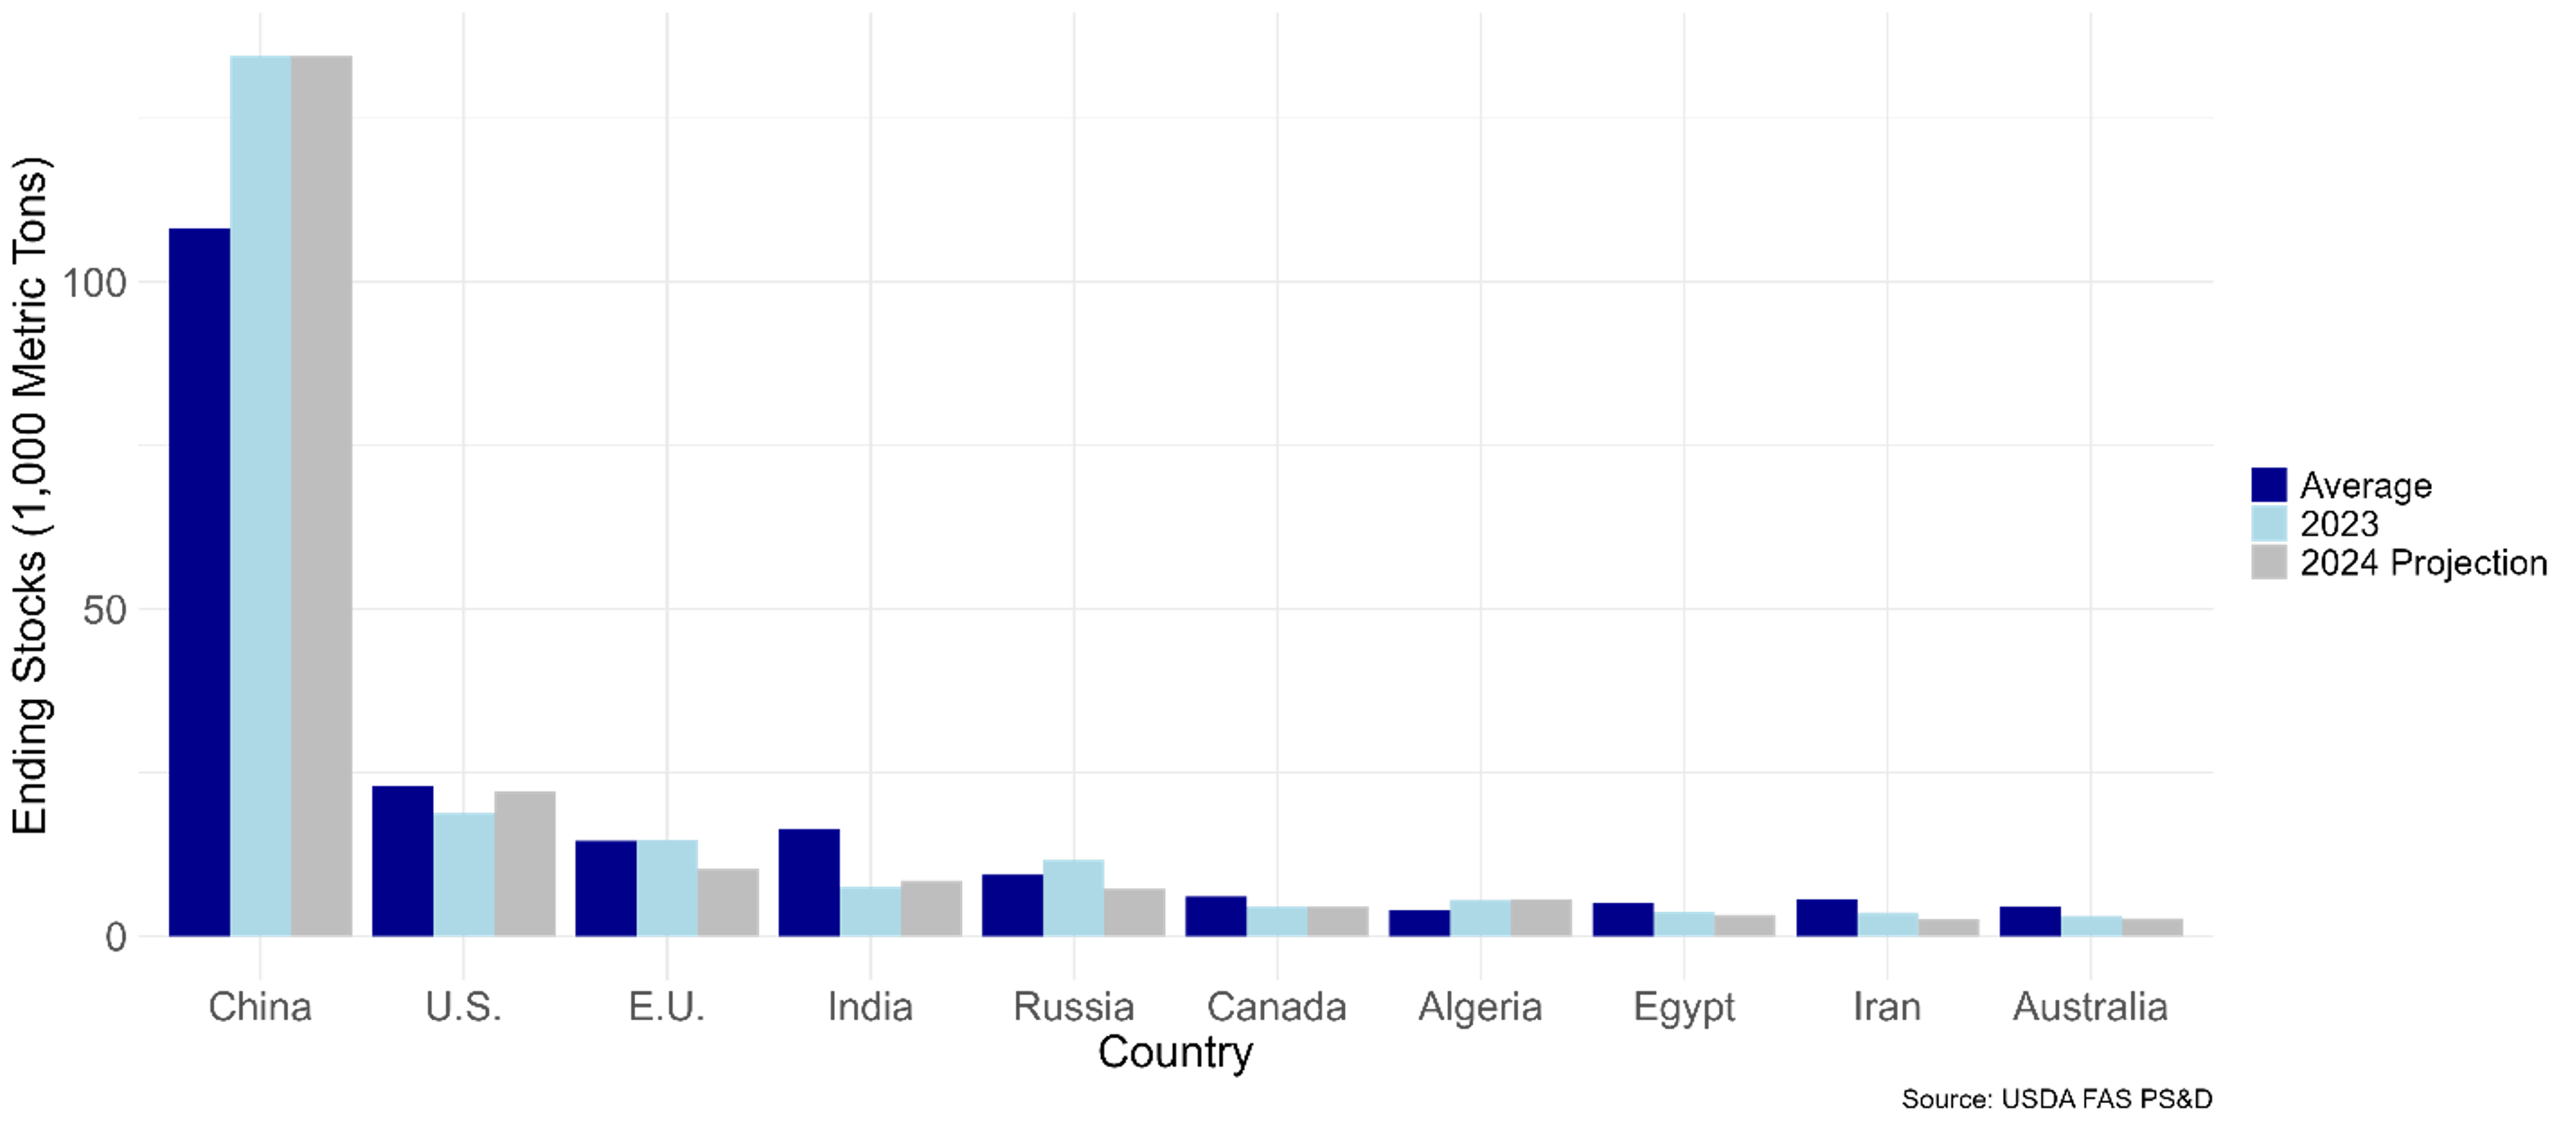
U.S. exports decreased 200,000 bales compared to October, resulting in a corresponding increase in U.S. ending stocks. Projected U.S. carryover into the next marketing year is 4.3 million bales. Foreign cotton stocks declined 780,000 bales due primarily to stock revisions in India and production decreases in Pakistan.
Year-over-Year Changes
Compared to the previous marketing year, U.S. production is up 630,000 bales, and exports are down 450,000 bales. Year-over-year ending stocks are projected to increase 1.15 million bales. Foreign stocks are projected to be unchanged compared to 2023/24.
Price Reaction and Outlook
Cotton prices showed limited movement for the day. Price ranges remained firmly intact, with nearby cotton futures trading 69-73 cents and deferred contracts at a 3-5 cents premium. Global demand remains the primary obstacle to improved cotton prices.
References and Resources
USDA World Agricultural Supply and Demand Estimates (WASDE). November 8, 2024. https://www.usda.gov/oce/commodity/wasde/wasde1124.pdf
Smith, Aaron. “Changes to Supply and Demand Estimates in the November WASDE.” Southern Ag Today 4(46.3). November 13, 2024. Permalink