As harvest continues to progress, farmers face the decision to sell or store soybeans. If soybeans are stored, farmers should evaluate the risks and rewards of holding soybeans priced or unpriced. Consideration should be given to both futures price risk and basis risk for individual locations. Holding soybeans in storage with no price protection is risky, as the value of the crop in storage has the potential to decline in value, while also incurring storage costs, such as interest. USDA projects Brazil’s soybean production to be a record crop of 6.2 billion bushels, up 10% compared to last year (USDA September 2024 WASDE). Brazil’s soybean planting season runs from September through December, with harvest occurring from January through May (USDA, FAS). As such, the price of U.S. soybeans held in storage will be strongly influenced by production risk during the growing season in South America.
Figure 1. Three soybean pricing scenarios in Memphis, TN as of Oct 3, 2024
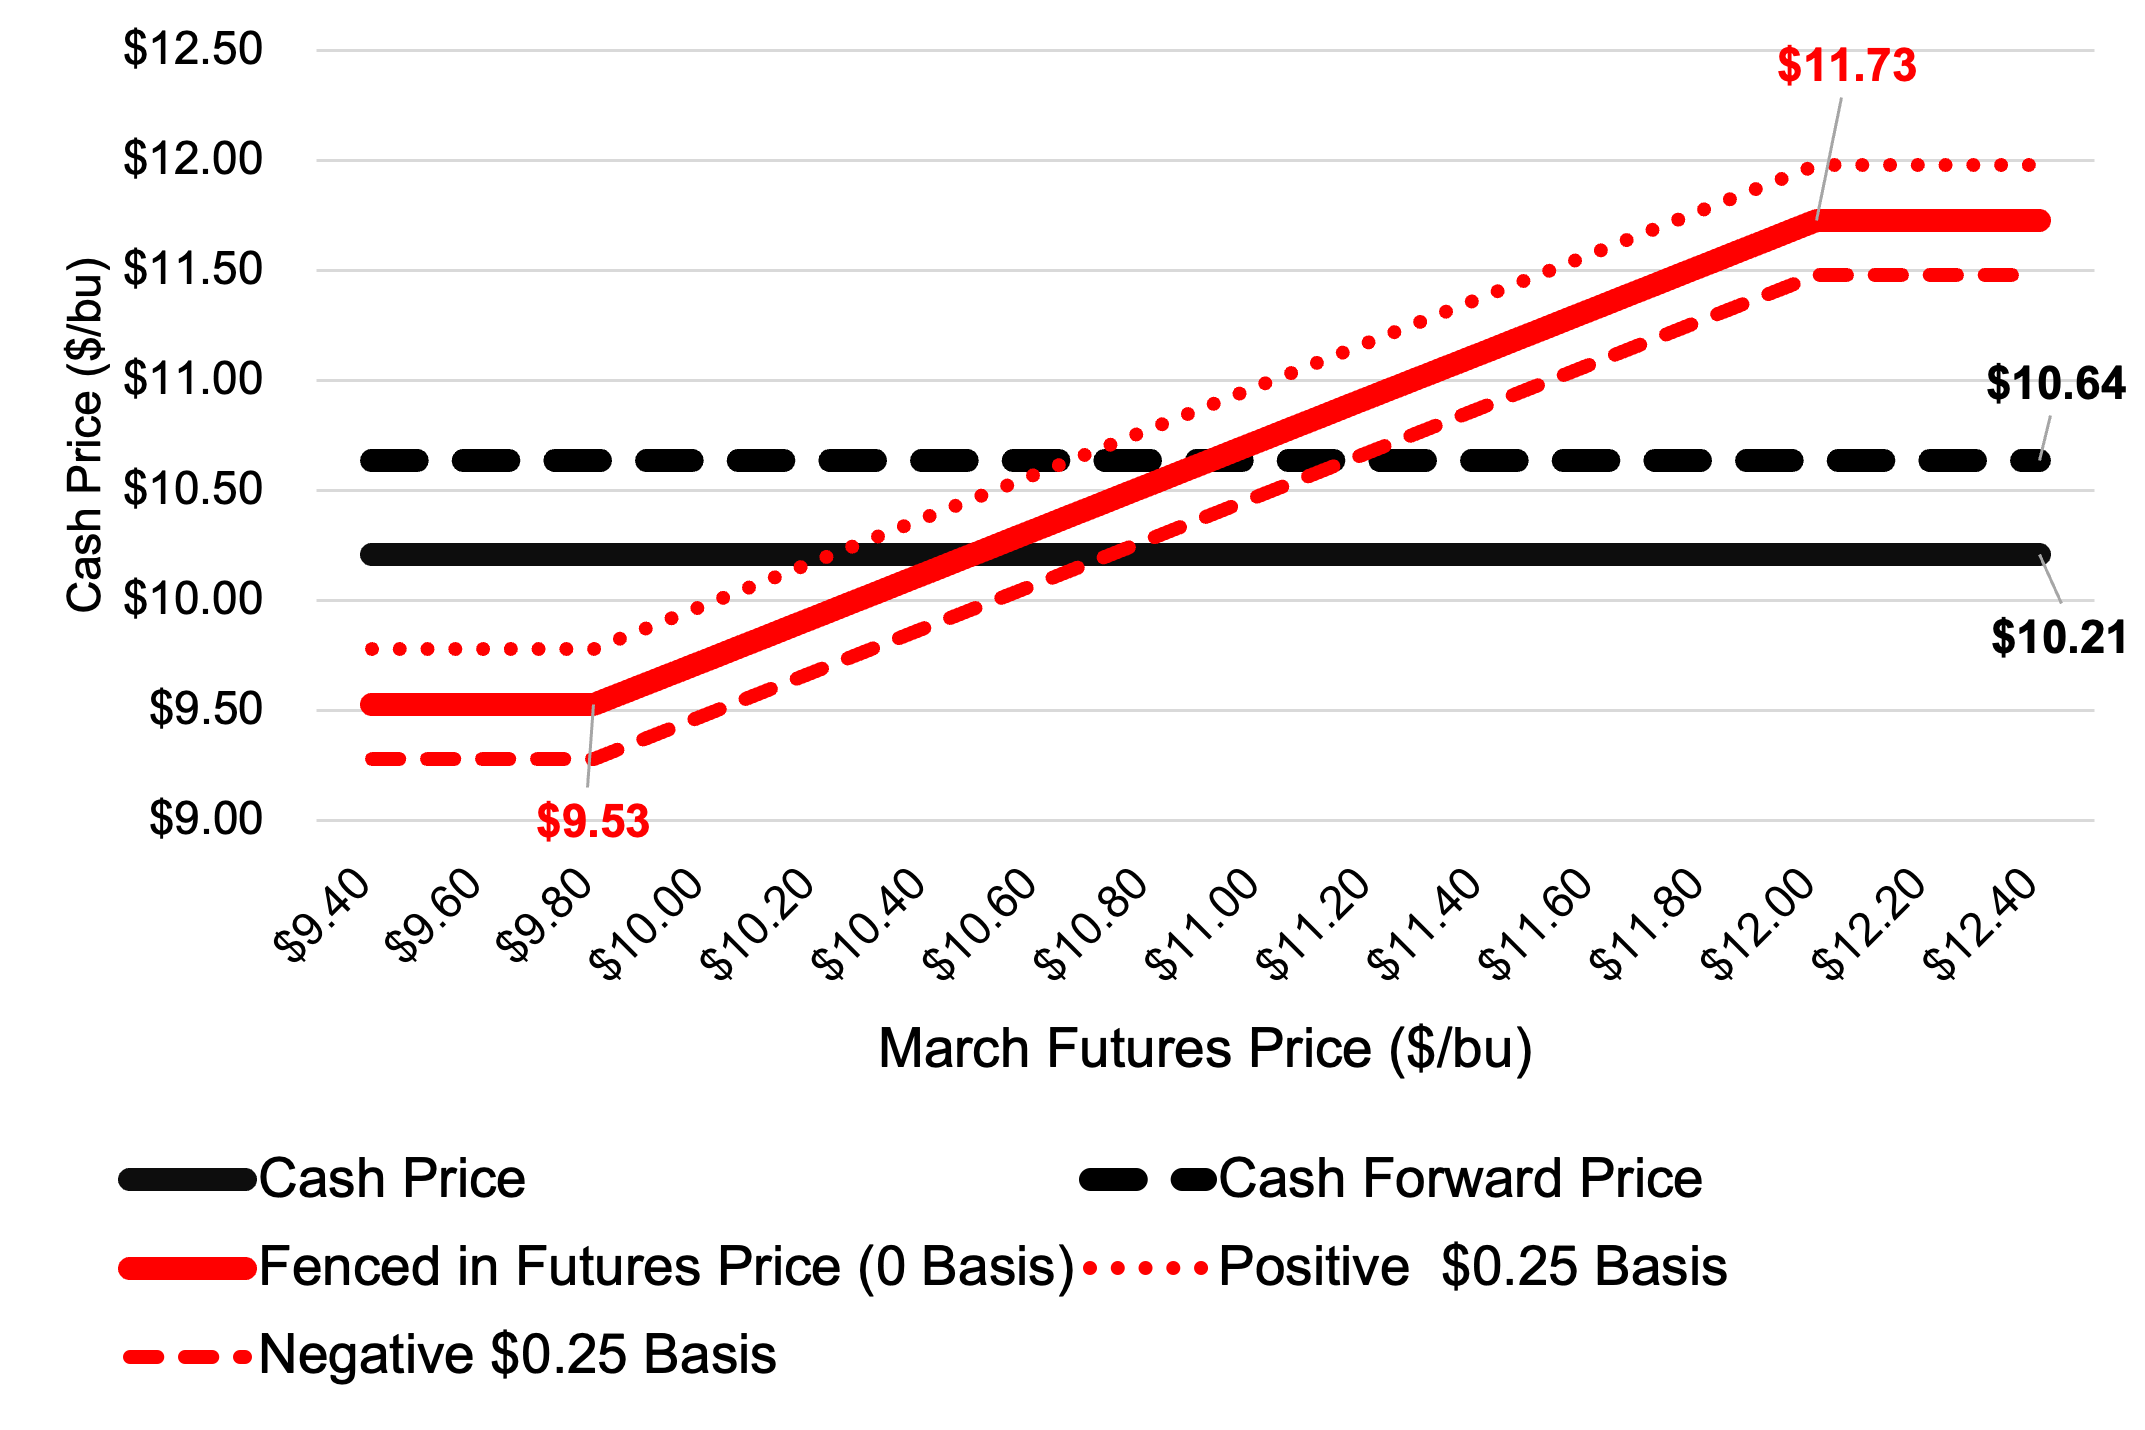
This article examines three scenarios for pricing soybeans this fall.
- Sell soybeans at the current cash price;
- Store soybeans and establish a cash forward contract price for delivery in February; and
- Buy a put option and sell a call option to fence in a futures price with delivery of soybeans to a cash market in February.
All futures market prices, premiums, and cash prices are for Memphis, Tennessee, as of October 3, 2024. Interest is assumed at an 8% rate.
In scenario one, the cash price was $10.21 (November Futures contract $10.46; negative basis of $0.25). This is the most straight forward scenario. The farmer sells soybeans and receives $10.21 (solid black line in Figure 1).
In scenario two, the farmer decides to store soybeans but wants to establish a price, so he enters a cash forward contract for delivery in February for $10.91. The interest cost to carry soybeans for four months is estimated at $0.27 ($10.21 x 8% x (4 months / 12 months)). Once delivered, the farmer receives $10.64 ($10.91 less $0.27 of interest expense; dashed black line in Figure 1).
In scenario three, the farmer stores soybeans for February delivery and buys a $9.80 March put option for $0.13 and sells a $12.00 March call option for $0.13, making the strategy premium neutral, without including transaction costs. This strategy has fenced in a futures price (does not include basis) between $9.53 and $11.73 (solid red line in Figure 1). Change in the March futures contract will determine the outcome. Positions in the futures market would be offset by cash sales. If March futures are below $9.80, assuming 0 basis, the producer will receive $9.53 ($9.80 less $0.27 in interest). For March futures prices below $9.80, the put option would be exercised, establishing a short position in the futures market for the farmer. If March futures are above $12.00, the producer will receive $11.73 ($12.00 less $0.27 in interest). For March futures prices above $12.00, the call option would be exercised, establishing a long position in the futures market for the farmer. March futures prices between $9.80 and $12.00 will result in cash prices between $9.53 and $11.73. March futures prices above $10.48 would provide a net price greater than the cash sale in scenario 1, and a March futures price above $10.91 would provide a cash price greater than the storage with a cash forward contract in scenario 2. An additional benefit of the options strategy is that the farmer can set basis immediately or any time prior to delivery of the soybeans to the cash market. The dotted red lines in figure 1 show how a positive or negative $0.25 basis would affect the cash price received under the fenced in futures price scenario.
All three alternatives have advantages and disadvantages. Farmers need to determine their access to storage, price risk tolerance, and expectations for futures prices and basis for their market to evaluate which strategy is right for their operation.
References
Barchart.com. Soybean Futures and Options Prices and Premiums. https://www.barchart.com/futures/quotes/ZS*0/futures-prices?viewName=main
USDA Foreign Agricultural Service. Country Summary. Brazil Soybean Area, Yield and Production. https://ipad.fas.usda.gov/countrysummary/Default.aspx?id=BR&crop=SoybeanUSDAUSDA September 2024 WASDE Report. https://www.usda.gov/oce/commodity/wasde