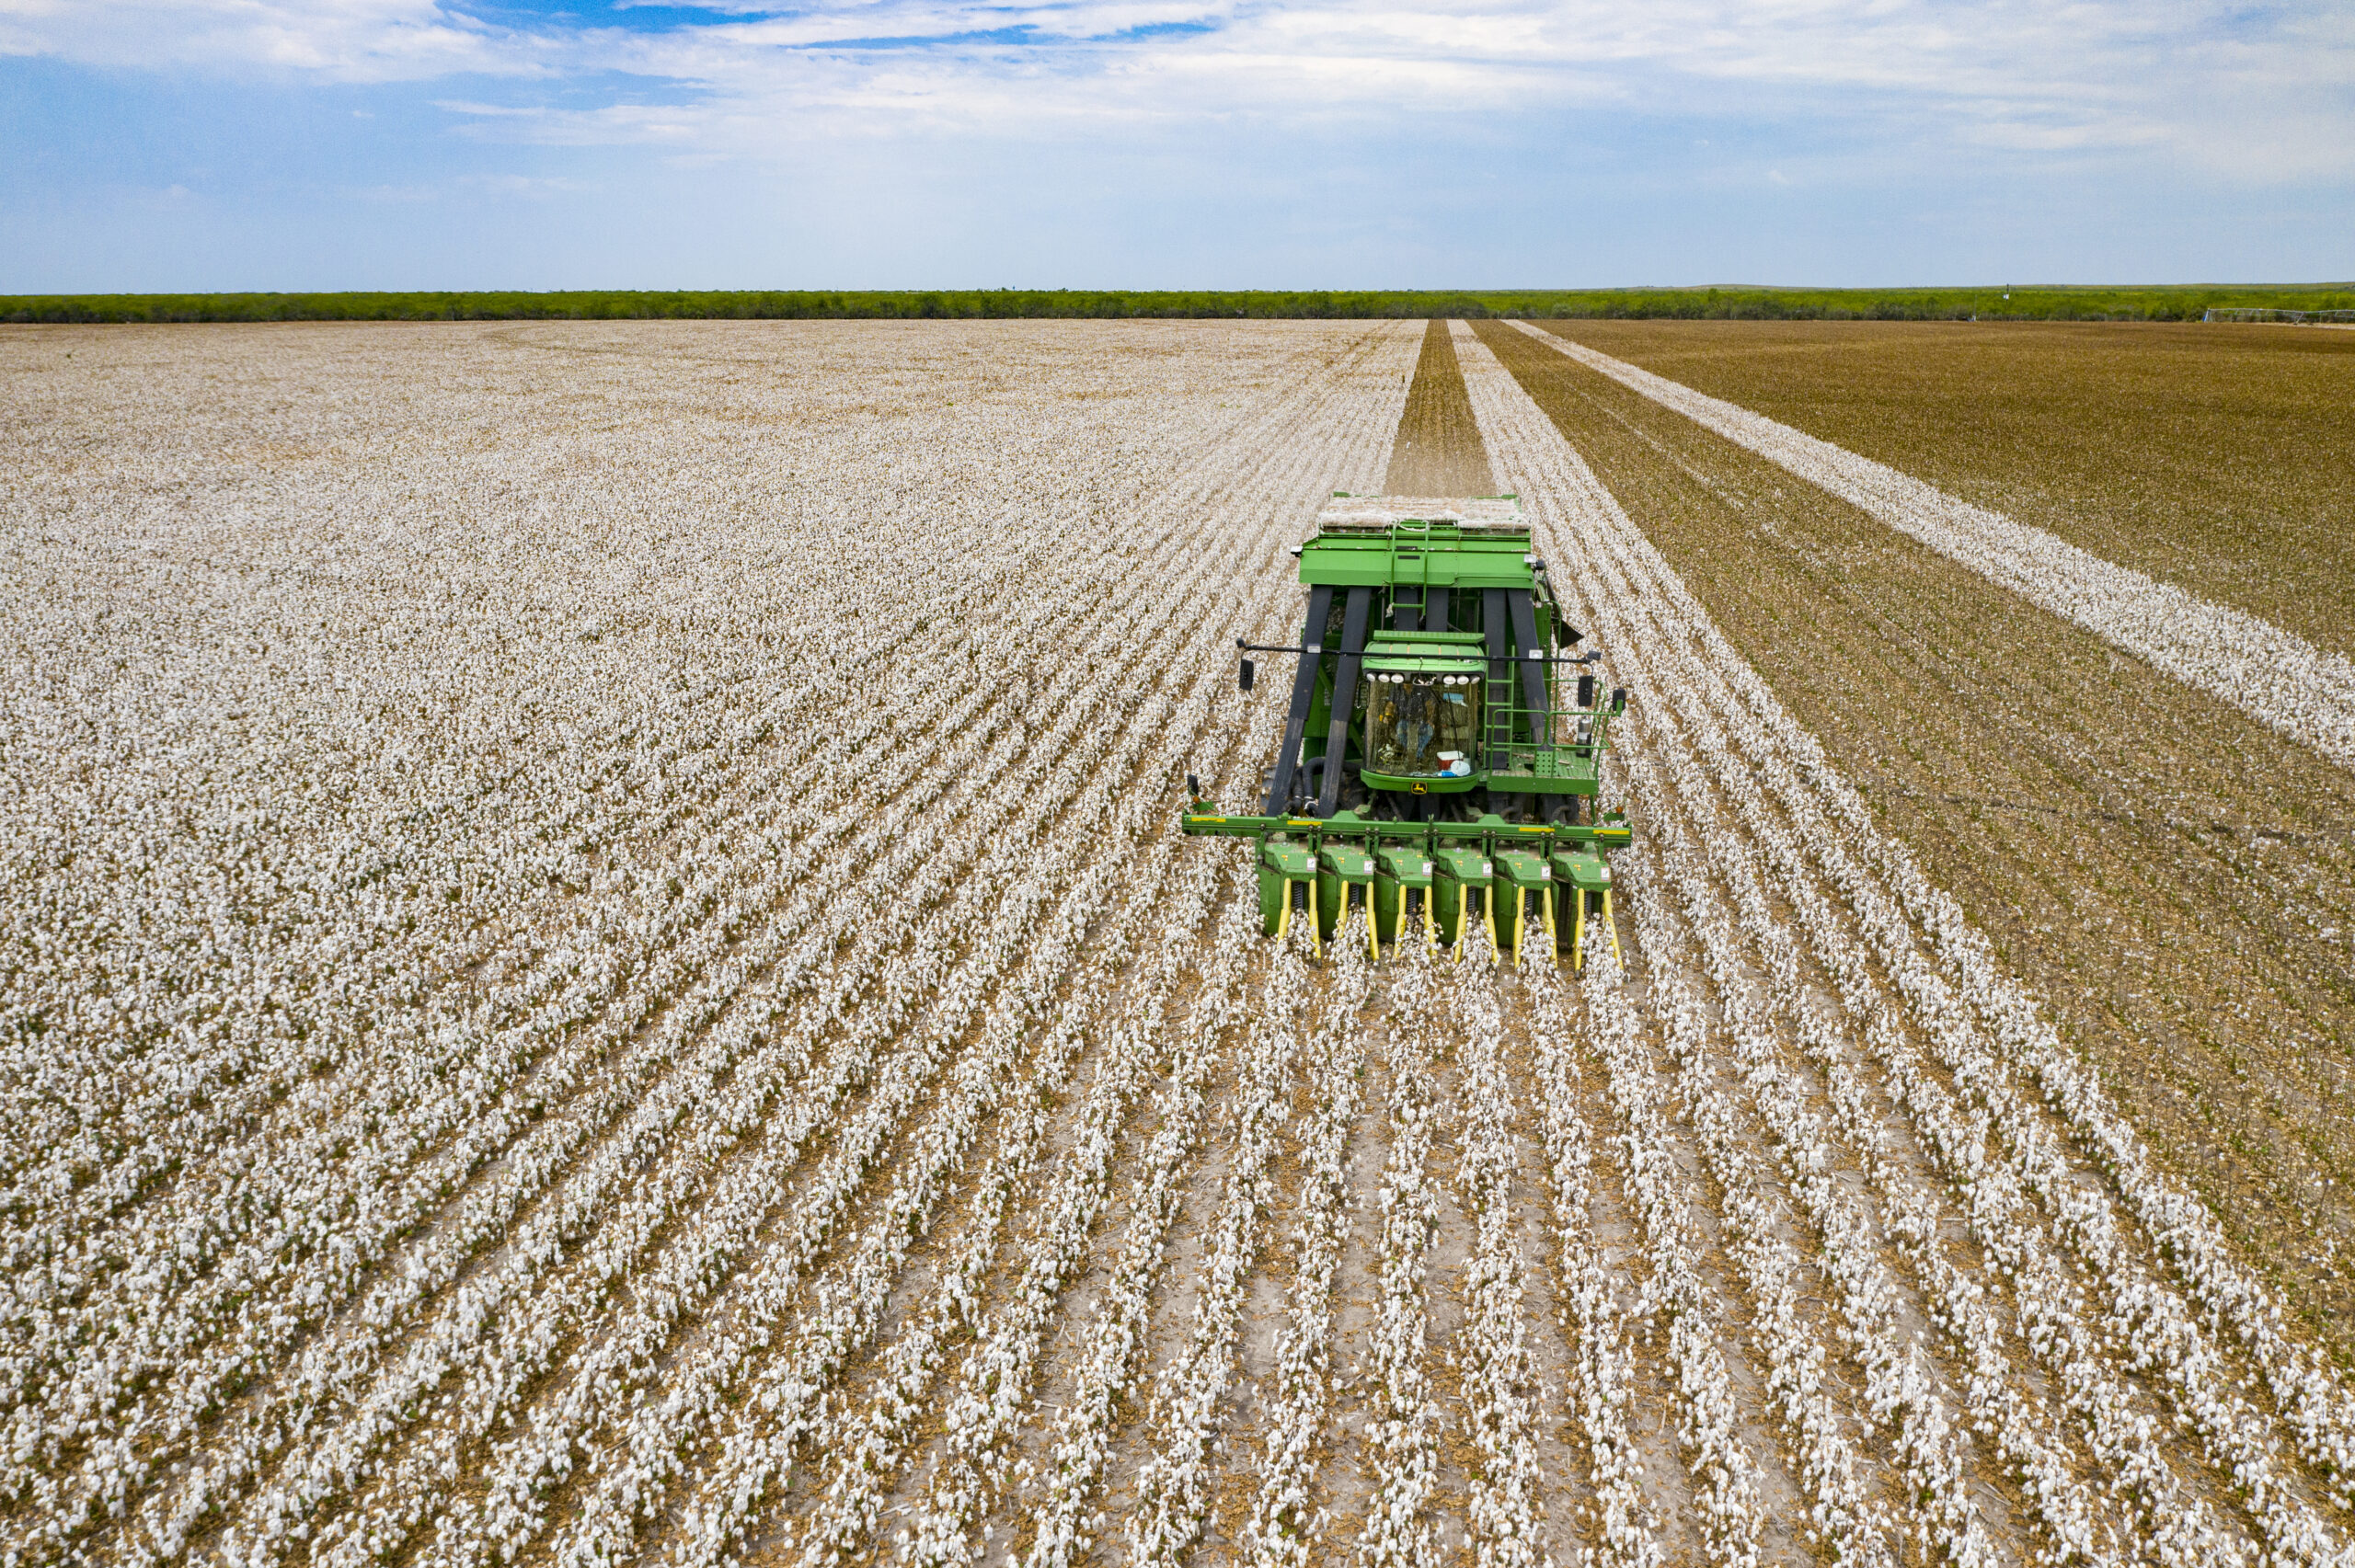
USDA NASS has released the equivalent of college football’s pre-season poll, which is the August Crop Production report (released August 12). The Crop Production report provides an estimate of acreage, area harvested, yields, and production for the major row crops in the U.S. Additional crop production reports (polls) will be released in September, October, and November. The Annual Crop Production report (final poll) will be released in January.
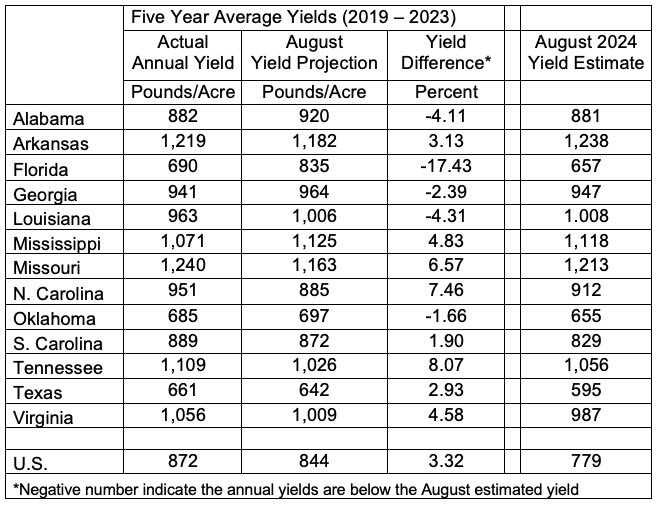
For the states represented in the Southern Ag Today area, estimates for cotton yields garner a lot of attention. How accurate are these August estimates to actual yields? Table 1 shows the actual five-year average (2019 – 2023) annual cotton yield compared to the five-year average of the August yield projection.
Table 1. Annual Cotton yield vs. August estimates yields (5-year averages)
There is a range in the percent difference in the actual yields versus the August estimates. The actual five-year average ranges from 17.43 percent below the five-year estimated August yield (Florida) to just over 8 percent higher than the August estimate (Tennessee).
Like pre-season polls, the estimated yields can vary from the actual annual yield for numerous reasons. Wind and excess rain from tropical weather events cause the largest decline in yields from the August estimate to the actual yields. While we won’t know for several months what our actual yields are (or our favorite team’s record), the pre-season projections provide some insight.
USDA’s June Grain Stocks report estimated 37% more corn and 44% more soybeans stored on-farm than last year (Maples, 2024). Many producers are still sitting on unpriced old crop corn trying to decide whether to sell or hold through harvest hoping for prices to improve. This article discusses three potential options for a farmer deciding what to do with old crop held in storage. The three options – using 100,000 bushels of corn and a current cash price of $4.00 – examined are:
sell corn at the current market price;
continue to store corn with operating loan utilization; or
store corn with cash resources.
Selling corn at the market price is the most straightforward option. Selling would result in collecting $400,000 that could be used in other areas of the operation – including paying down opertating debt or covering expenses – or it could be invested. Additionally, making sales would free up storage for the new crop and shift the focus to marketing the 2024 crop.
If an operating loan with a 9% interest rate is being used, continuing to store corn until February would incurr interest expense of $21,000 ($400,000 × 9% × 7/12). Dividing by 100,000 bushels, the per-bushel interest expense would be $0.21 or $0.03 per bushel per month, meaning cash prices from now until February would need to increase to at least $4.21 for the farmer to be better off than selling at today’s prices.
If the farmer is using cash reserves, rather than an operating loan, to carry corn until February, forgone interest should be estimated. Current certificate of deposit (CD) rates for short term money are close to 4.5%. Utilizing $400,000 cash has a forgone return on investment interest of $10,500 ($400,000 × 4.5% × 7/12) or $0.11/bu ($0.015 per bu per month).
When deciding to continue to store corn or sell, several factors need to be considered. Calculating the interest expense or forgone interest is one factor. There is uncertainty in price direction; however, based on current projections it is likely that both futures prices and basis will remain low as harvest proceeds. It is worth noting that this analysis only considers interest expenses. It does not include other other storage costs or risks, such as quality losses, grain handling, and capital recovery for storage infastructure. Additionally, prices may not increase by February, and all storage could result in a loss.
References
Maples, William E. “Having a Way Out.” Southern Ag Today 4(30.1). July 22, 2024. Permalink
Gardner, Grant. “Interest Rates and Grain Storage.” Southern Ag Today 3(26.1). June 26, 2023. Permalink
The August 2024 World Agricultural Supply and Demand Estimates (WASDE) report included indicators of record yields and production, lower average prices, and some mixed market signals in the week that followed the release. On August 12, the USDA released the WASDE report projecting a record corn yield of 183.1 bushels per acre. The increased corn yield more than offsets a reduction in harvested acres, resulting in a forecast of 15.15 billion bushels. If realized, total U.S. corn production would be the third-largest corn crop on record, roughly 200 million bushels behind the 15.34 billion bushel record crop of 2023. With increased exports, ending stocks are expected to fall slightly to 2.1 million bushels.
The USDA also reported a record soybean yield of 53.2 bushels per acre, and forecasted record production of 4.59 billion bushels. Even with a small increase in projected exports, ending stocks are projected to increase significantly to 560 million bushels. As a result of these projections, the average farm price for 2024/25 is projected to be $4.20/bu for corn (down 10 cents/bu from the month prior) and $10.80/bu for soybeans (down 30 cents/bu from the month prior).
For cotton, acreage and production estimates were both lowered. Yields are projected at 840 pounds per acre, while planted acres are down about 500 thousand acres. Combined with an expected increase in the abandonment rate from the prior month, production estimates are expected to be 15.11 million bales. Total use also is projected to decline with decreases in both domestic use and exports, resulting in a 4.5 million bale ending stock. Even with lower ending stocks, the average farm price for 2024/25 is projected to be 66 cents/lb (down 2 cents/lb from the month prior).
Long-grain rice production is expected to decline only slightly to 167.2 million hundredweight, with ending stocks following suit, down to 23.2 million hundredweight. The average farm price remained steady at $14.50/cwt.
The week that followed this report was filled with ups and downs, but overall indications of a low-price environment this fall and winter. Table 1 illustrates the last futures market trade price for November/December contracts for corn, soybeans, cotton, and rough rice for each day since August 9, the day before the WASDE release. On August 12, the day of the release, the corn contract increased 6.5 cents from the prior day, with an attempt to stay at the $4/bu mark that didn’t make it through Friday. The November soybean futures price saw a 16.5 cent drop from the prior day and continued to fall thereafter, down to $9.57 by the end of day Friday, marking a one-week drop of 45.4 cents/bu. Meanwhile, cotton appeared to make an attempt at the 70 cent/lb mark after the WASDE release, but ultimately has continued the fall to near 67.24 cents/lb by the end of the week. Rough rice initially dropped 28.5 cents from the prior day, but did rebound to above $15/cwt before pulling back again to close out the week at $14.725/cwt. The reaction to the August WASDE report indicates a continued downward trend in futures prices, with a high likelihood that prices remain depressed through harvest. The 2024/25 marketing year is setting up to be a challenging year for profitability for most farmers. Producers need to ensure they are obtaining the most out of their marketing plans under these challenging circumstances.
Table 1. Futures Market Prices around the August WASDE Report for Nov/Dec Contract Dates for Select Commodities
Source: Prices obtained from https://www.barchart.com/. Note: Prices are the last trade price reported on the given date. The August WASDE report was released at 12pm ET on 8/12.
Storage is an important marketing and risk management tool that allows producers to extend the marketing interval and avoid seasonal low prices at harvest. As harvest rapidly approaches, producers will need to determine the amount of production that can be stored on-farm or in commercial storage and which commodities to store if limited space is available. Looking at current futures market price spreads provides an indication of whether the futures market is incentivizing storing corn or soybeans (Table 1 and 2). To compare the benefit of storage between commodities, we can look at the spread between the nearby and deferred futures contracts and the interest cost associated with carrying the commodity for sale at a later date. In this analysis, the interest rate is assumed to be 8.0%. This results in a monthly interest cost of $0.026/bu ($3.83/bu x 8% x 1/12 months) for corn and $0.067/bu/month ($10.08/bu x 8% x 1/12 months) for soybeans.
Comparing the May futures contract and interest cost for corn and soybeans indicates a benefit to storing corn over soybeans. The futures market spread between the September and May corn contract is $0.46/bu ($4.29/bu – $3.83/bu). The interest cost is $0.20/bu ($0.026/bu/month x 8 months). The spread less interest is $0.26/bu. For soybeans, the September and May spread is $0.54/bu ($10.62/bu – $10.08/bu) with an interest cost of $0.54/bu ($0.067/bu/month x 8 months). This results in a soybean spread less interest of $0.00/bu. Examining other deferred contract months provides a similar result. Thus, the futures market is indicating a stronger incentive to store corn than soybeans. It is important to note that this analysis does not include changes in basis, which will vary by location and could change the storage preference between commodities.
Gross Domestic Product (GDP) is likely the most closely watched and commonly cited economic indicator. GDP is “…the market value of all goods and services produced within a country in a given period of time” and is “…the best single measure of a society’s economic well-being” (Mankiw, 2007). While tracking and forecasting GDP is important for businesses, labor, investors, policymakers, and economists, it has important implications for the farm economy as well. GDP can be thought of as how well off your customers are to buy the things you produce.
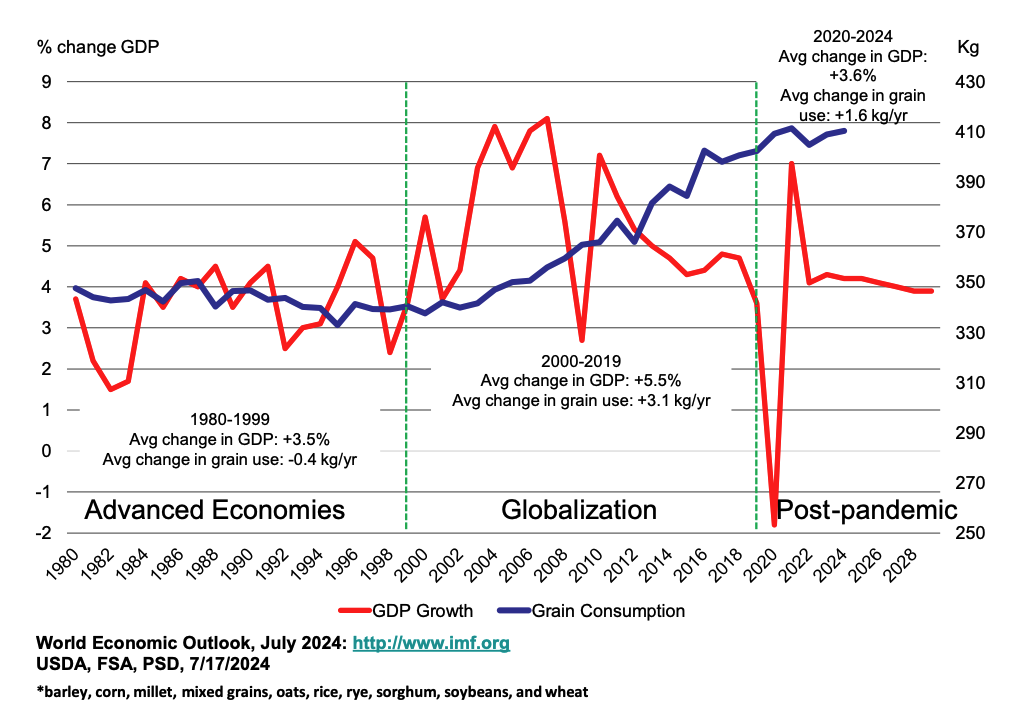
The International Monetary Fund uses GDP to track global economic growth by country and country groups. Real GDP growth (adjusted for inflation) has exhibited interesting trends since 1980 that have implications for grain markets (Figure 1). From 1980 to 2000, there was very little difference between growth rates of GDP between advanced economies (e.g., U.S., Japan, most of Europe, Canada, Australia, U.K), and emerging market and developing economies (e.g., Brazil, Russia, India, China, Mexico). Advanced economies grew at an average rate of 2.9%, with emerging market and developing economies growing by 3.5%.
Figure 1. Global Economic Growth, real GDP, 1980-2029
In the early 2000s, world economic growth rates began to be driven by emerging economies. Gains in productivity, rising per capita incomes, and a growing middle class have made many emerging economies more competitive as suppliers to world export markets and increased the size of their domestic markets (Kose and Prassad, 2010). From 2000 to 2019, the growth rate of advanced economies was 1.9%, with emerging and developing economies growing by an average of 5.5%.
Since 2020, economic growth rates in emerging economies have slowed. Global conflicts, trade tensions, inflation, and rising interest rates are a few of the factors cited for a slowdown in economic growth, factors that hit emerging and developing economies especially hard (IMF, 2024). Estimates for 2020-2024 show advanced economies growing by an average of 1.5% and emerging and developing economies by 3.6%. Including forecasts by the IMF for the next five years, average GDP growth from 2020-2029 is projected to be 1.7% for advanced economies and 3.8% for emerging and developing.
Figure 2. Real GDP growth in emerging and developing economies and world per capita grain consumption
Trends in world grain consumption have shown significant changes since 1980 as well (Figure 2; blue line). In 1980, consumption of barley, corn, millet, mixed grains, oats, rice, rye, sorghum, soybeans, and wheat was 348 kg per person. By the end of the 1999/2000 marketing year, that number was down to 340 kg. Then, per capita consumption began to grow, reaching over 400 kg by 2019. With increasing protein in diets and grain for fuel, the most recent estimate of world per capita grain consumption in 2024 is 410 kg.
An overlay of GDP growth in emerging and developing economies and world per capita grain consumption shows the relationship between these factors (Figure 2). From 1980-1999, a period with little difference between growth in advance economies and emerging economies, GDP grew by 3.5% while grain use per capita fell by 7 kg (-0.4 kg/yr). From 2000-2019, an era of globalization and expanding economic impact in emerging economies with GDP on the rise, grain use increased by 62 kg (+3.1 kg/yr). Since 2019, post-pandemic, with slower rates of growth in GDP, grain use has increased by 8 kg (1.6 kg/yr), about half the rate of growth of the previous 20 years.
Per capita grain consumption is one measure of global grain demand. Even if per capita consumption is unchanged, growth in the population base would still mean an increase in grain consumption. In 1980, the world population was increasing by 1.6% per year. In 2000, population growth was 1.3%. That growth rate is down to 0.9% in 2024 and forecast to be 0.8% by 2030, half the rate of growth in 1980 (USDA, ERS, 2024).
Important to levels of grain use are patterns of global economic growth, especially GDP growth in emerging and developing economies. As growth rates in this region slow down over the next decade, per capita grain use may yet increase, but at a slowing rate.
The combination of slowing population growth and a slowdown in economic growth may alter recent patterns in world grain use. That means gains in productivity (weather permitting) have a higher likelihood of exceeding gains in use. When that happens, that is a recipe for lower prices.
References:
International Monetary Fund (IMF). World Economic Outlook, July 2024, http://www.imf.org.
Kose, M.A. and E. Prassad. “Emerging Markets Come of Age”, Finance and Development, Vol. 47, No 4, December 2010.
Mankiw, Gregory. Brief Principles of Macroeconomics, Fourth Edition, Thompson South-Western, Mason, Ohio, 2007.