The USDA Risk Management Agency (RMA) published final 2023 county yields for upland cotton on July 3, 2024. Upland cotton producers who purchased 2023 crop year Stacked Income Protection Plan (STAX) policies are now receiving final indemnity payments, thus contributing to current cash flow. Based on RMA’s Summary of Business reporting as of July 15, total STAX indemnities across all states for 2023 will slightly exceed $352.7 million dollars.
STAX is a crop insurance product for upland cotton that provides coverage for a portion of the expected revenue in an area. Most often, the “area” will be a specific county, but may include other counties or production practices as necessary to obtain a credible amount of data to establish an expected yield and premium rate. STAX coverage is available in all counties where crop insurance for upland cotton is currently offered.
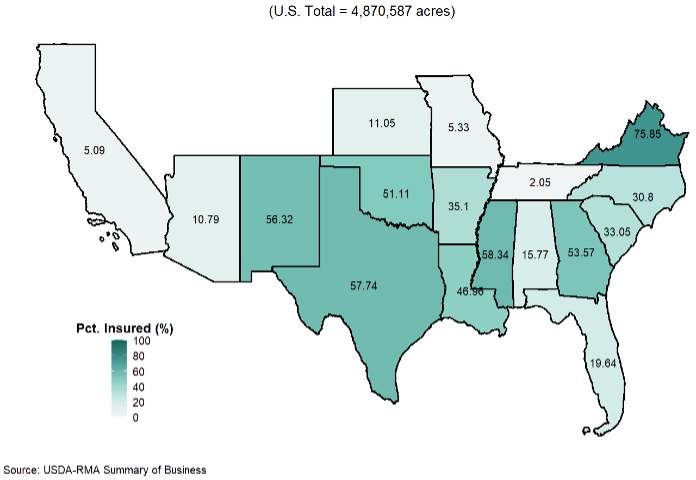
According to USDA-RMA data, 4.87 million acres of upland cotton were insured under STAX in 2023 (Figure 1). This was 48 percent of nearly 10.1 million planted acres. In the majority of cotton producing states, STAX participation is much lower than 48 percent. The high concentration of U.S. cotton acreage in Texas inflates the level of total participation in the STAX program. On a regional basis, the Southwest (Kansas, Oklahoma, and Texas) accounted for 70 percent of the total acres enrolled in STAX last year. This region also has the largest concentration of upland cotton acreage in the U.S at almost 6.1 million acres. Texas alone planted over one-half or 5.55 million acres of the U.S. upland cotton total in 2023. Furthermore, Texas accounted for 66 percent, or 3.2 million of the 4.87 million total acres insured under STAX.
Figure 1. State-Level Percentage of Upland Cotton Planted Acres Enrolled in STAX (2023)
STAX pays a loss on an area-wide basis, and an indemnity is triggered when there is an area loss in gross revenue. Gross revenue is a function of both yield and price. Common to many crop insurance products, STAX utilizes a futures price (i.e. December cotton futures) to determine the Projected and Harvest prices used to calculate indemnity payments. For most states in 2023, revenue losses resulted solely from below-average yields, which means that Projected and Harvest prices in those states were either the same or Harvest prices were higher than Projected prices.
The state level price discovery periods and the 2023 Projected and Harvest prices for cotton are summarized in Table 1. Only Kansas, New Mexico and Oklahoma had a lower Harvest Price that may have contributed to revenue losses. Thus, for fourteen (14) of the seventeen (17) cotton producing states, any STAX payments were the result of actual yields being at least 10 percent less than the expected county/area yield (assuming the 90 percent area loss trigger was selected).
Table 1. State Level Crop Insurance Price Discovery Periods for Cotton.
| State(s) | Projected Price Discovery Period | Harvest Price Discovery Period | 2023 Projected Price/lb | 2023 Harvest Price/lb |
| Southern TX | 12/15 – 1/14 | 9/1 – 9/31 | $0.81 | $0.87 |
| AL, AZ, AR, CA, FL, GA, LA, MS, NC, SC, central TX | 1/15 – 2/14 | 10/1 – 10/31 | $0.85 | $0.85 |
| MO, northern TX, TN, VA | 2/1 – 2/28 | 10/1 – 10/31 | $0.84 | $0.85 |
| KS, NM, OK | 2/1 – 2/28 | 11/1 – 11/30 | $0.84 | $0.78 |
Since the inception of the STAX program ten years ago, in response to the provisions in the 2014 Farm Bill, some consideration can be given to how effective the product is as a price risk management tool. Although coverage levels can vary, the majority of STAX policies in the U.S. would see indemnities begin when area revenue falls below 90% of its expected level. In selecting a crop insurance product, growers may consider the likelihood of a STAX revenue loss being generated solely by declining prices. Figure 2 illustrates that over the past decade Harvest Prices relative to Projected Prices have experienced a 10 percent or greater decline in three crop years in the period 2014 to 2023, with an average change of -1.2%. Thus, similar to 2023, STAX most often protects against either only yield effects or a combined yield and price effect.
Figure 2. Percent Price Change from Projected to Harvest Price*, December Cotton Futures (2014 – 2023)
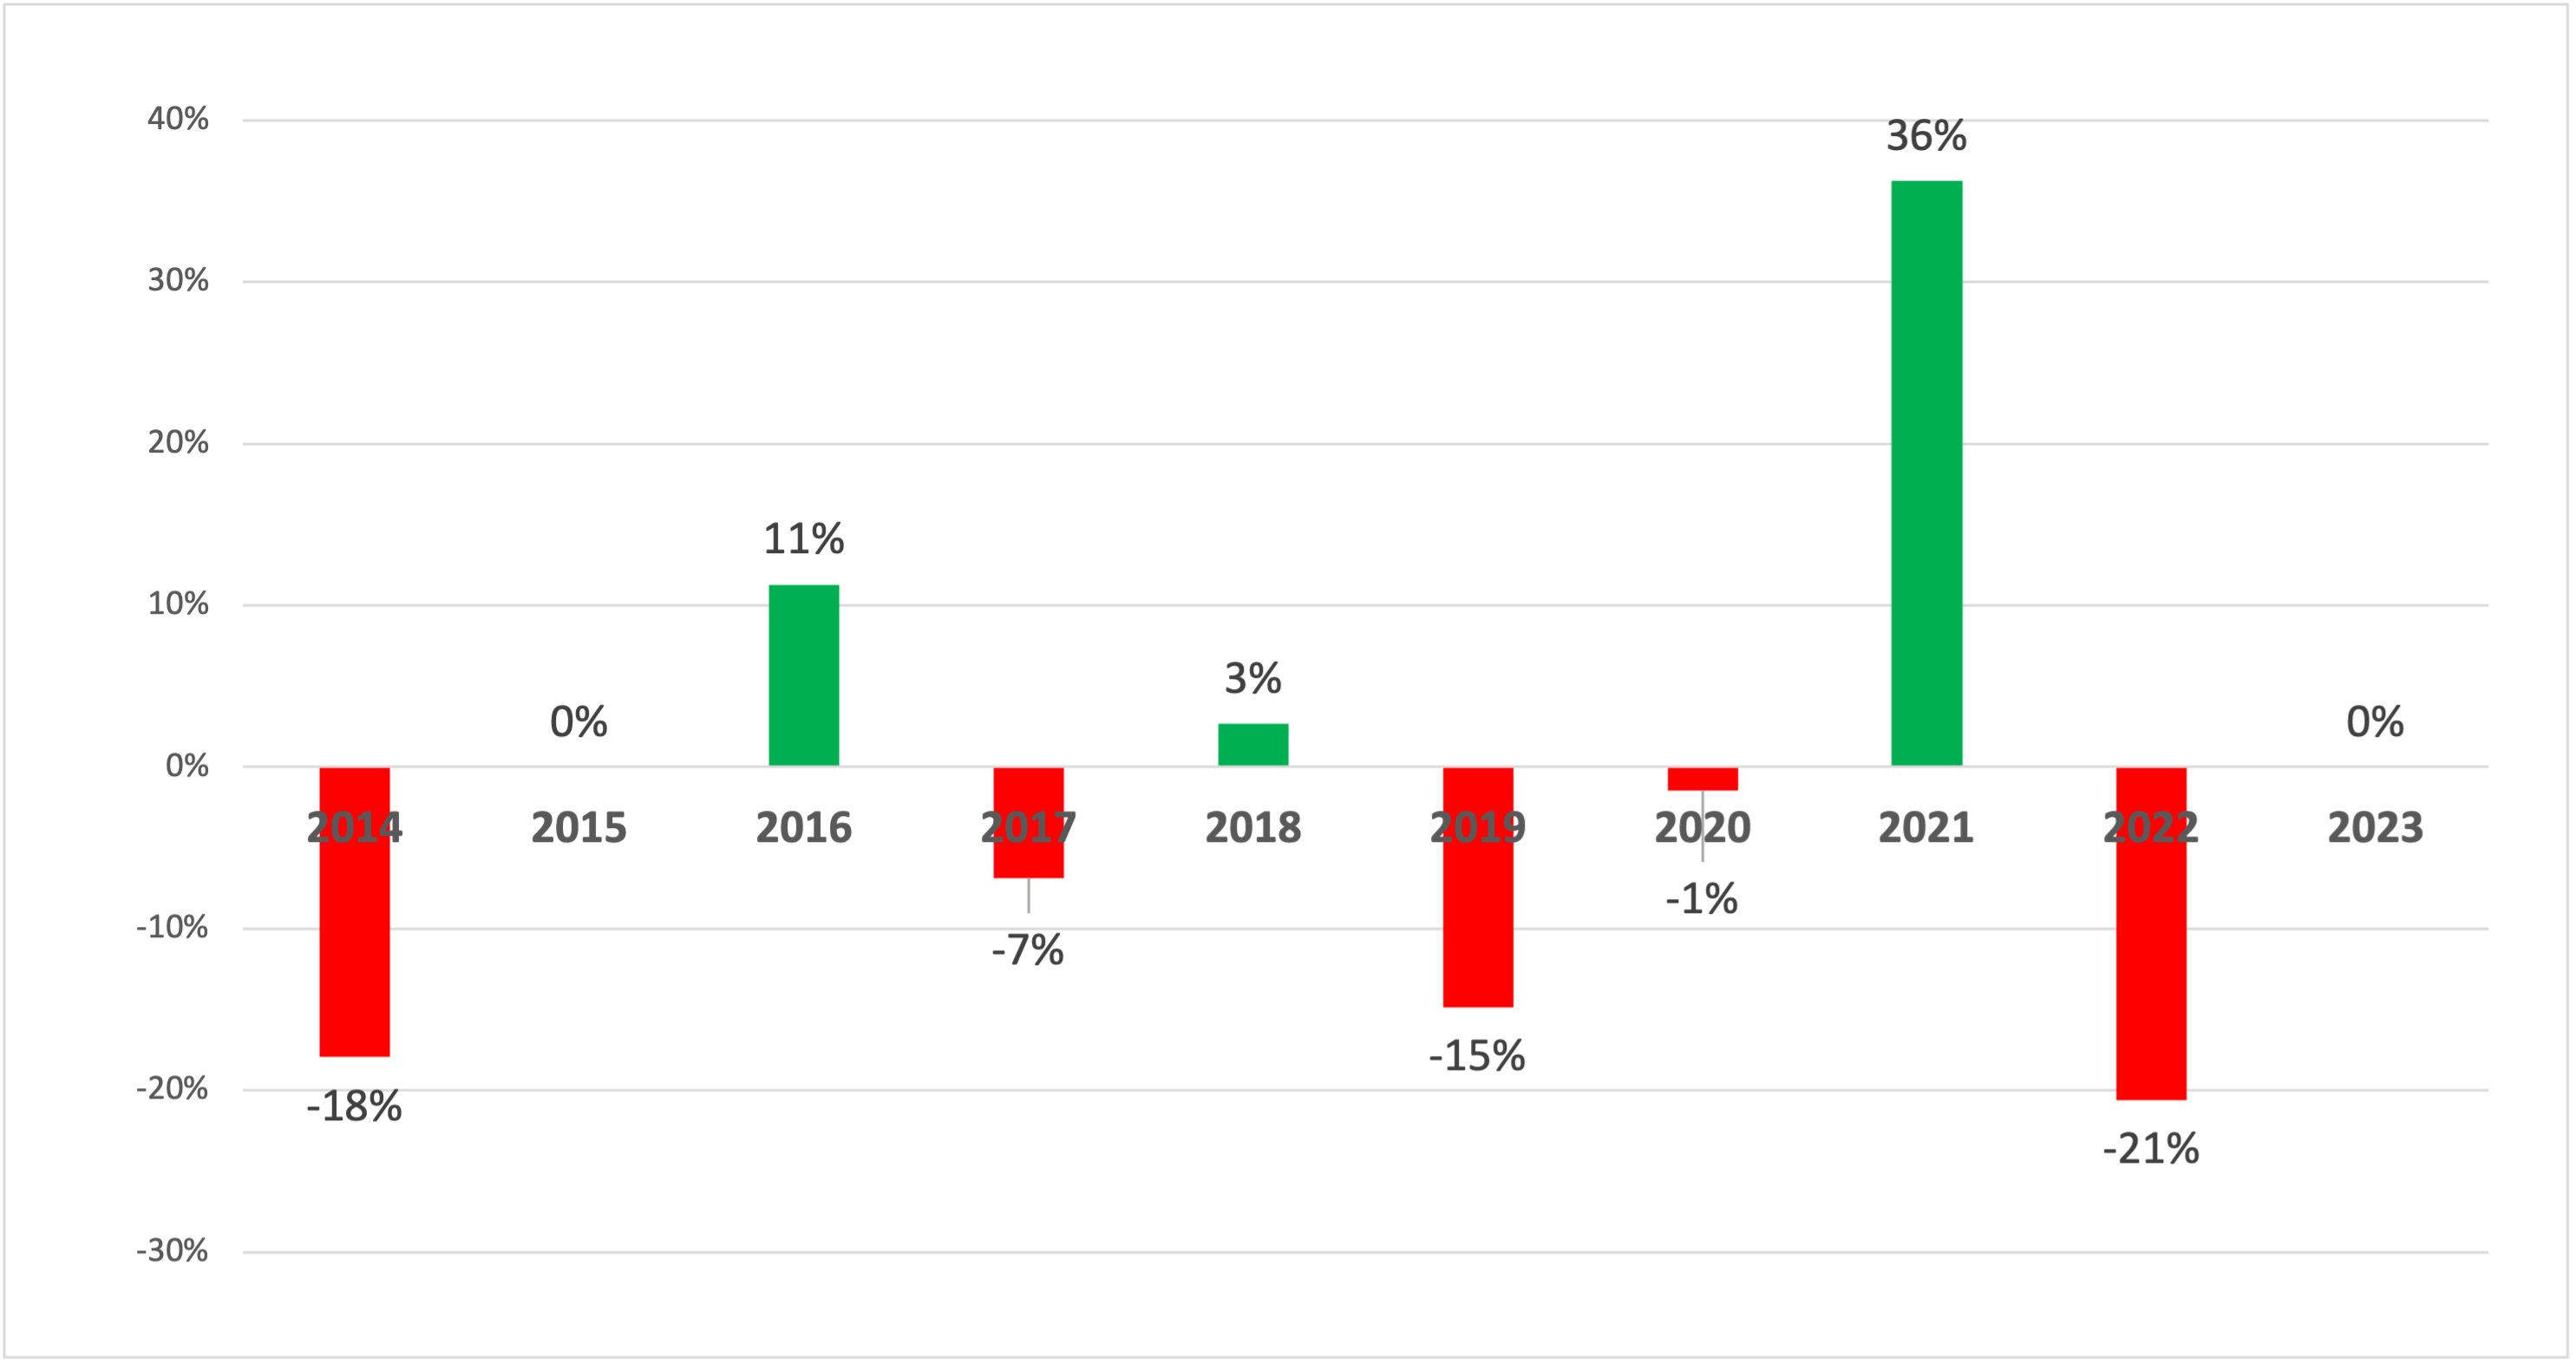
*Price discovery periods for: AL, AZ, AR, CA, FL, GA, LA, MS, NC, SC, central TX.
References
USDA-RMA (2024, July). USDA Risk Management Agency Summary of Business.
URL: https://www.rma.usda.gov/SummaryOfBusiness.
USDA-RMA (2024, July). USDA National Agricultural Statistics Service QuickStats.
URL: https://quickstats.nass.usda.gov/.
Stiles, H. Scott, and Hunter D.Biram. “Review of 2023 STAX Payments and Implications for Price Risk Management in Cotton.” Southern Ag Today 4(31.1). July 29, 2024. Permalink