Category: Crop Marketing

  • Marketing Challenges from Storage Capacity and Excess Supply

    Marketing Challenges from Storage Capacity and Excess Supply

    The 2025 grain crop year has presented several challenges, including elevated production costs, significant competition from Brazil and Argentina in the global marketplace, and disruptions in U.S. exports as a result of tariffs. As the midpoint of the 2025 harvest season approaches in the southern region, this year’s grain production is projected to be a second consecutive record crop, while depressed market prices continue. During a year of increased supply, questions arise regarding the availability of grain storage, both on and off the farm, and the potential to delay selling until the market shows favorable prevailing prices. Additionally, producers without on-farm grain storage are burdened with issues of product transportation, off-farm storage availability, and the ability to better control post-harvest grain quality. 

    Figure 1 shows each of the southern states’ on and off-farm grain storage capacity as of December 2024. The top three states with the most storage capacity are Texas, Arkansas, and Kentucky. In the case of Kentucky, on-farm storage capacity is more than double that of off-farm storage capacity. Oklahoma and Texas have significantly more off-farm storage capacity than on-farm.  On-farm storage can play an important role for producers, providing three key advantages to a farm. First, there is the ability to store and hold the harvested crops, allowing flexibility in delivery and the possibility to benefit from higher prices outside of harvest.  Maples (2022) illustrates monthly price variations in a previous Southern Ag Today article, showing that May-July were the highest average prices for corn and soybeans from 2014-2021. Second, on-farm storage permits earlier harvest. Assuming bins have dryers, producers can harvest at higher moisture levels and dry the grain before delivery, avoiding moisture discounts. The third advantage of on-farm storage is increased harvest efficiency. Transportation time is less with on-farm storage and is dependable, versus off-farm storage that may be impacted by time spent waiting at the local grain elevator or barge points. This is increasingly important in southern regions where distance to grain buyers can be particularly challenging. 

    A comparison of grain storage capacity to the total estimated production of corn, soybeans, and wheat in 2025, as well as the average production of the same grains from 2021 to 2024, is also shown in Figure 1. The combination of on-farm and off-farm grain storage capacity exceeds the 2025 estimated production in Alabama, Arkansas, Georgia, North Carolina, Oklahoma, Texas, and Virginia.  Meanwhile, production exceeds the combined grain storage capacity in Kentucky, Mississippi, and Tennessee, presenting a potential for marketing challenges if space is not available for the remaining harvest. South Carolina and Louisiana also show production higher than off-farm storage capacity, but on-farm storage capacity data are not available for these states.

    The relationship between grain storage capacity and estimated production is important to consider at harvest because when production exceeds capacity, producers generally face having to sell at a negative basis or transport grain farther distances where storage may be available. In a year when excess supply occurs and storage capacity may be strained, there is an increase in the number of producers that are objectively left with the question of, “What do I do with my grain to avoid accepting a really bad price?” Marketing strategies to help answer that question might include deferred pricing contracts, futures, or options, all of which were discussed in a Southern Ag Today article in 2022 and continue to be relevant marketing strategies today.

    Source: USDA-NASS Quickstats
    Notes:: *On-farm storage capacity is not reported for Louisiana and South Carolina.
    2025 Estimated Production is the sum of corn, soybean, and wheat production published by USDA as of August.
    Florida not shown because on-farm storage capacity data and grain production data are not available.

    References:

    Maples, William E. “On-Farm Grain Storage in Southern States”. Southern Ag Today 2(38.1). September 12, 2022. https://southernagtoday.org/2022/09/on-farm-grain-storage-in-southern-states/.

    Smith, S. Aaron. “Marketing Strategies if Producers Do Not Have Access to On-Farm Storage.” Southern Ag Today 2(40.1). September 26, 2022. https://southernagtoday.org/2022/09/26/marketing-strategies-if-producers-do-not-have-access-to-on-farm-storage/.


    Pittman, Wilton, and Adam Rabinowitz. “Marketing Challenges from Storage Capacity and Excess Supply.Southern Ag Today 5(36.3). September 3, 2025. Permalink
  • The Mississippi River is Set to Fall to Severe Levels for the Fourth Year in a Row

    The Mississippi River is Set to Fall to Severe Levels for the Fourth Year in a Row

    The Mississippi River level measured by the U.S. Geological Survey at Memphis, TN, may drop to severe lows for the fourth year in a row (USGS, 2025). The Mississippi River has fallen below the agreed-upon zero reference point of the USGS stream gage during harvest (i.e., August 1 through November 30) eight of the last ten years, underscoring the impacts drought can have on river levels. We discussed what is meant by a river level below the zero reference point in a previous article (Biram, Mitchell, and Stiles, 2024; National Weather Service, 2024). Further, the level has now fallen to the “low” stage, defined by the National Weather Service as -5 feet, five times (2015, 2017, 2022, 2023, and 2024). These historically low river levels carry serious implications for cash basis, or the local cash price offered by a grain elevator less the futures price traded on a global market (Biram and Mitchell, 2025). 

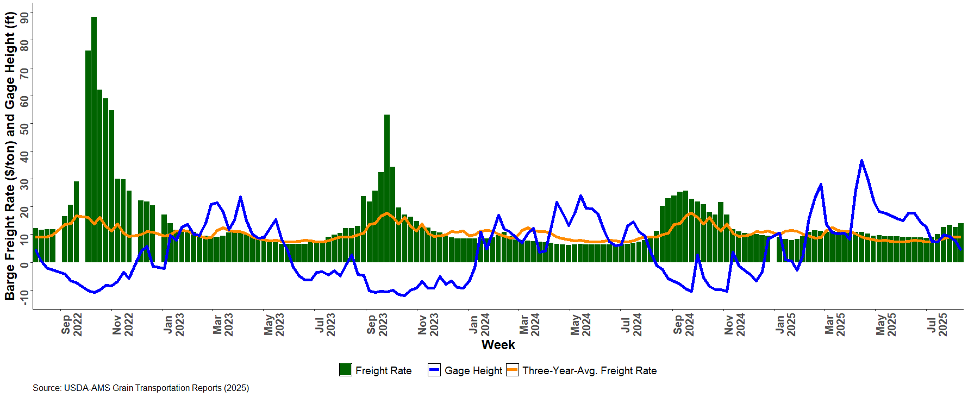
    Figure 1 plots the Mississippi River level measured at Memphis, Tennessee, for the period August 11, 2022, through August 20, 2025. This figure also provides the weekly average freight, as well as the expected barge freight rate measured by the non-drought three-year average freight rate (i.e., 2019-2021). Barge freight rates are established by the U.S. Inland Waterway System using a percent of tariff system and have been discussed in a prior article (Biram, Mitchell, and Stiles, 2024). Since the 2022 drought event, we have observed that when the gage height falls, barge freight rates increase, and vice versa. However, it appears that barge operators have adjusted as the weekly average freight rate has declined since the drought event of 2022.

    Figure 1. The relationship between the Mississippi River level and barge freight rates for moving cargo from Cairo, IL or Memphis, TN (August 2022 – August 2025)

    Nonetheless, midsouth soybean basis is not only weaker than the non-drought five-year-average (i.e., 2017-2021) but is also weaker than the average basis observed over the last three drought years (i.e., 2022, 2023, and 2024). Basis can change abruptly due to economic or environmental events, such as low river levels. Changes in basis reflect changes to local market conditions. Local cash bids offered by elevators on the Mississippi River tend to be influenced by river level in periods of drought as described by previous SAT articles (Biram, et al., 2022; Biram, 2023; Gardner, Biram, and Mitchell, 2023; Biram, Mitchell, and Stiles, 2024). This is because it is more expensive to ship the same amount of grain in more loads to reduce barge draft.

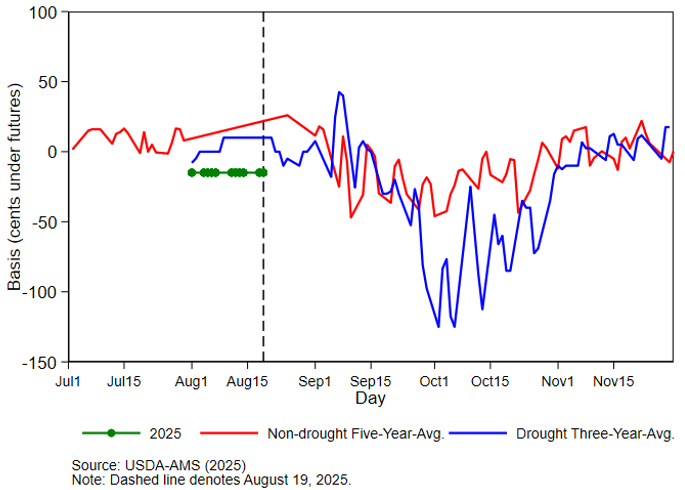
    Figure 2 shows the soybean basis response to low river levels in Helena, Arkansas in 2022-2024 with current basis for 2025 well below average as of August 20, 2025. The green line in Figure 2 provides the most recent basis for new crop soybeans and is well below both the averages for non-drought and drought years. The dashed vertical line denotes the basis most recently reported (-15) on August 20, 2025, and is 41 cents below the average non-drought-event basis of 26 cents and 25 cents below the average drought-event basis of 10 cents.

    Figure 2. Daily Soybean Basis at Helena, AR in Harvest Window

    The economic impacts of marketing in this window are clear. Mitchell and Biram (2025) determined that in 2022, alone, Arkansas farmers faced nearly $300 million in losses due to widening basis driven by low river levels, with a similar impact in Mississippi. A potential option farmers might have is to store grain in the bin and market it during the post-harvest window as described in previous Southern Ag Today articles (Gardner, 2023; Gardner and Maples, 2023; Gardner, 2024; Smith, 2024). Historically, futures and basis tend to recover in the months when there is little domestic production to buy, and stocks are drawn down. However, we recognize that not all farmers have the infrastructure in place (i.e., 48% of expected total crop production in 2024 was held in storage (USDA-NASS, 2025a and 2025b)) to store grain and market in the post-harvest window, which has implications for 2025 returns and 2026 loan renewal.

    References

    Biram, Hunter, John Anderson, Scott Stiles, and Andrew McKenzie. “Low Water Levels in the Mississippi River Result in Abnormally Weak Soybean Basis“. Southern Ag Today 2(45.1). October 31, 2022. Permalink

    Biram, Hunter. “Flooding in the Upper Mississippi River is Associated with Relatively Weak Soybean Basis in the Midsouth.” Southern Ag Today 3(21.1). May 22, 2023. Permalink

    Biram, Hunter, James L. Mitchell, and H. Scott Stiles. “Low Rivers Levels on the Mississippi River: Not the Three-Peat We Want.” Southern Ag Today 4(39.3). September 25, 2024. Permalink

    Biram, Hunter, and James L. Mitchell. “Estimating the Impact of Low Mississippi River Levels on Soybean Basis in the Midsouth.” Southern Ag Today 5(12.3). March 19, 2025. Permalink

    Gardner, Grant, Hunter Biram, and James Mitchell. “Low River Levels, Barge Freight, and Widening Basis.” Southern Ag Today 3(39.1). September 25, 2023. Permalink

    Gardner, Grant. “Interest Rates and Grain Storage.” Southern Ag Today 3(26.1). June 26, 2023. Permalink

    Gardner, Grant. “To Store or Not to Store? Old Crop Exit Strategies.” Southern Ag Today 4(35.1). August 26, 2024. Permalink

    Gardner, Grant, and William E. Maples. “River Levels and Off-Farm Storage Disbursement.” Southern Ag Today 3(43.1). October 23, 2023. Permalink

    Mitchell, J. L., & Biram, H. D. (2025). The effects of extreme weather on rural transportation infrastructure and crop prices along the Lower Mississippi River. Applied Economic Perspectives and Policy.

    National Weather Service. “How can a river stage be negative?” National Oceanic and Atmospheric Administration, National Weather Service. Accessed September 16, 2024. Permalink

    Smith, Aaron. “Storing corn or soybeans: what is the futures market incentivizing?” Southern Ag Today 4(33.1). August 12, 2024. Permalink

    United States Geological Survey. 2025.  Monitoring location, Mississippi River at Memphis, Tennessee. Available at: https://waterdata.usgs.gov/monitoring-location/USGS-07032000/#dataTypeId=continuous-00065-0&period=P7D  

    USDA-NASS. 2025a.  August 2025 Crop Production Report. Available at: https://downloads.usda.library.cornell.edu/usda-esmis/files/tm70mv177/6m313n48h/bk12b9684/crop0825.pdf

    USDA-NASS. 2025b.  QuickStats Query. Available at: https://quickstats.nass.usda.gov/#E31D1B9E-04B3-3954-939A-273CD6380DF9

    USDA-AMS. 2025.  Grain Transportation Reports. Available at: https://www.ams.usda.gov/services/transportation-analysis/gtr


    Biram, Hunter D., James Mitchell, and H. Scott Stiles. “The Mississippi River is Set to Fall to Severe Levels for the Fourth Year in a Row.Southern Ag Today 5(35.3). August 27, 2025. Permalink

  • Next Year’s Cotton Market Possibilities

    Next Year’s Cotton Market Possibilities

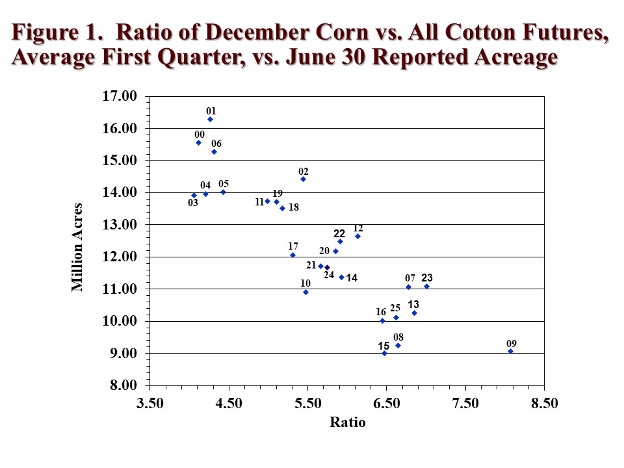
    Longer run price outcomes for the 2026 crop will be influenced by expectations of supply and demand.  A major supply-related question is how much 2026 acreage will be planted to cotton.  The price of competing crops, relative to cotton prices, is an important consideration to the level of planted cotton acreage. Figure 1 shows a fairly strong relationship between the level of U.S. upland and pima cotton planted (as measured on June 30) and the ratio of December CBOT corn futures and ICE cotton futures during the first quarter of the year.  The higher the ratio, the less cotton is planted. 

    Of course, there are other important competing crops as well, e.g., sorghum, soybeans, and peanuts.  There are non-price influences, including how dry it is in Texas, the insurance base price, fixed cost influences, and the psychological influence of the preceding growing season.  But the price ratio of corn to cotton appears to capture a lot of these other influences in explaining variations in cotton plantings.

    What does Figure 1 imply for 2026?  As of early August, the Dec’26 CBOT corn/Dec’26 ICE cotton price ratio is roughly 6.5 (i.e., $4.50 corn divided by 69-cent cotton).   Assuming this ratio prevails during Q1 of 2026, it is historically associated with between 10.0 and 10.5 million acres of all cotton.

    Assuming 10.0 million acres of all cotton in 2026, and further assuming ten-year Olympic averages of U.S. all cotton abandonment (21%) and yield (869 lbs) per harvested acre, the result is a healthy crop of 14.3 million bales. This combines with NASS’s August 12, 2025 projection of 3.6 million bales of carry-in for a 17.9 million bale supply. Further assuming 14.2 million bales of total use, the result is under four million bales of ending stocks of U.S. cotton in 2026/27.  That outcome is neutral for prices as it represents static year-over-year ending stocks. 

    Caveats.  Obviously, the analysis above depends on price ratios which may change between now and early 2026.  Furthermore, the price ratio approach to forecasting planted acreage will be replaced by grower survey results, beginning at the Beltwide Conference (January 7) and continuing with the National Cotton Council’s survey release (February 9) and United States Department of Agriculture’s Prospective Plantings report (March 31) and Acreage report (June 30).

    The National Oceanic and Atmospheric Administration’s Climate Prediction Center forecasts equal chances for continuing ENSO-neutral conditions or the development of La Niña conditions during the winter.  The latter would imply more dryness and higher abandonment during 2026. 

    Data Sources: 
    Historical June 30 planted all cotton acreage data from https://www.nass.usda.gov/Quick_Stats/
    CBOT Dec corn and ICE Dec cotton futures settlements compiled from www.barchart.com

    Robinson, John. “Next Year’s Cotton Market Possibilities.Southern Ag Today 5(34.3). August 20, 2025. Permalink

  • USDA Projects Largest Corn Supply in History

    USDA Projects Largest Corn Supply in History

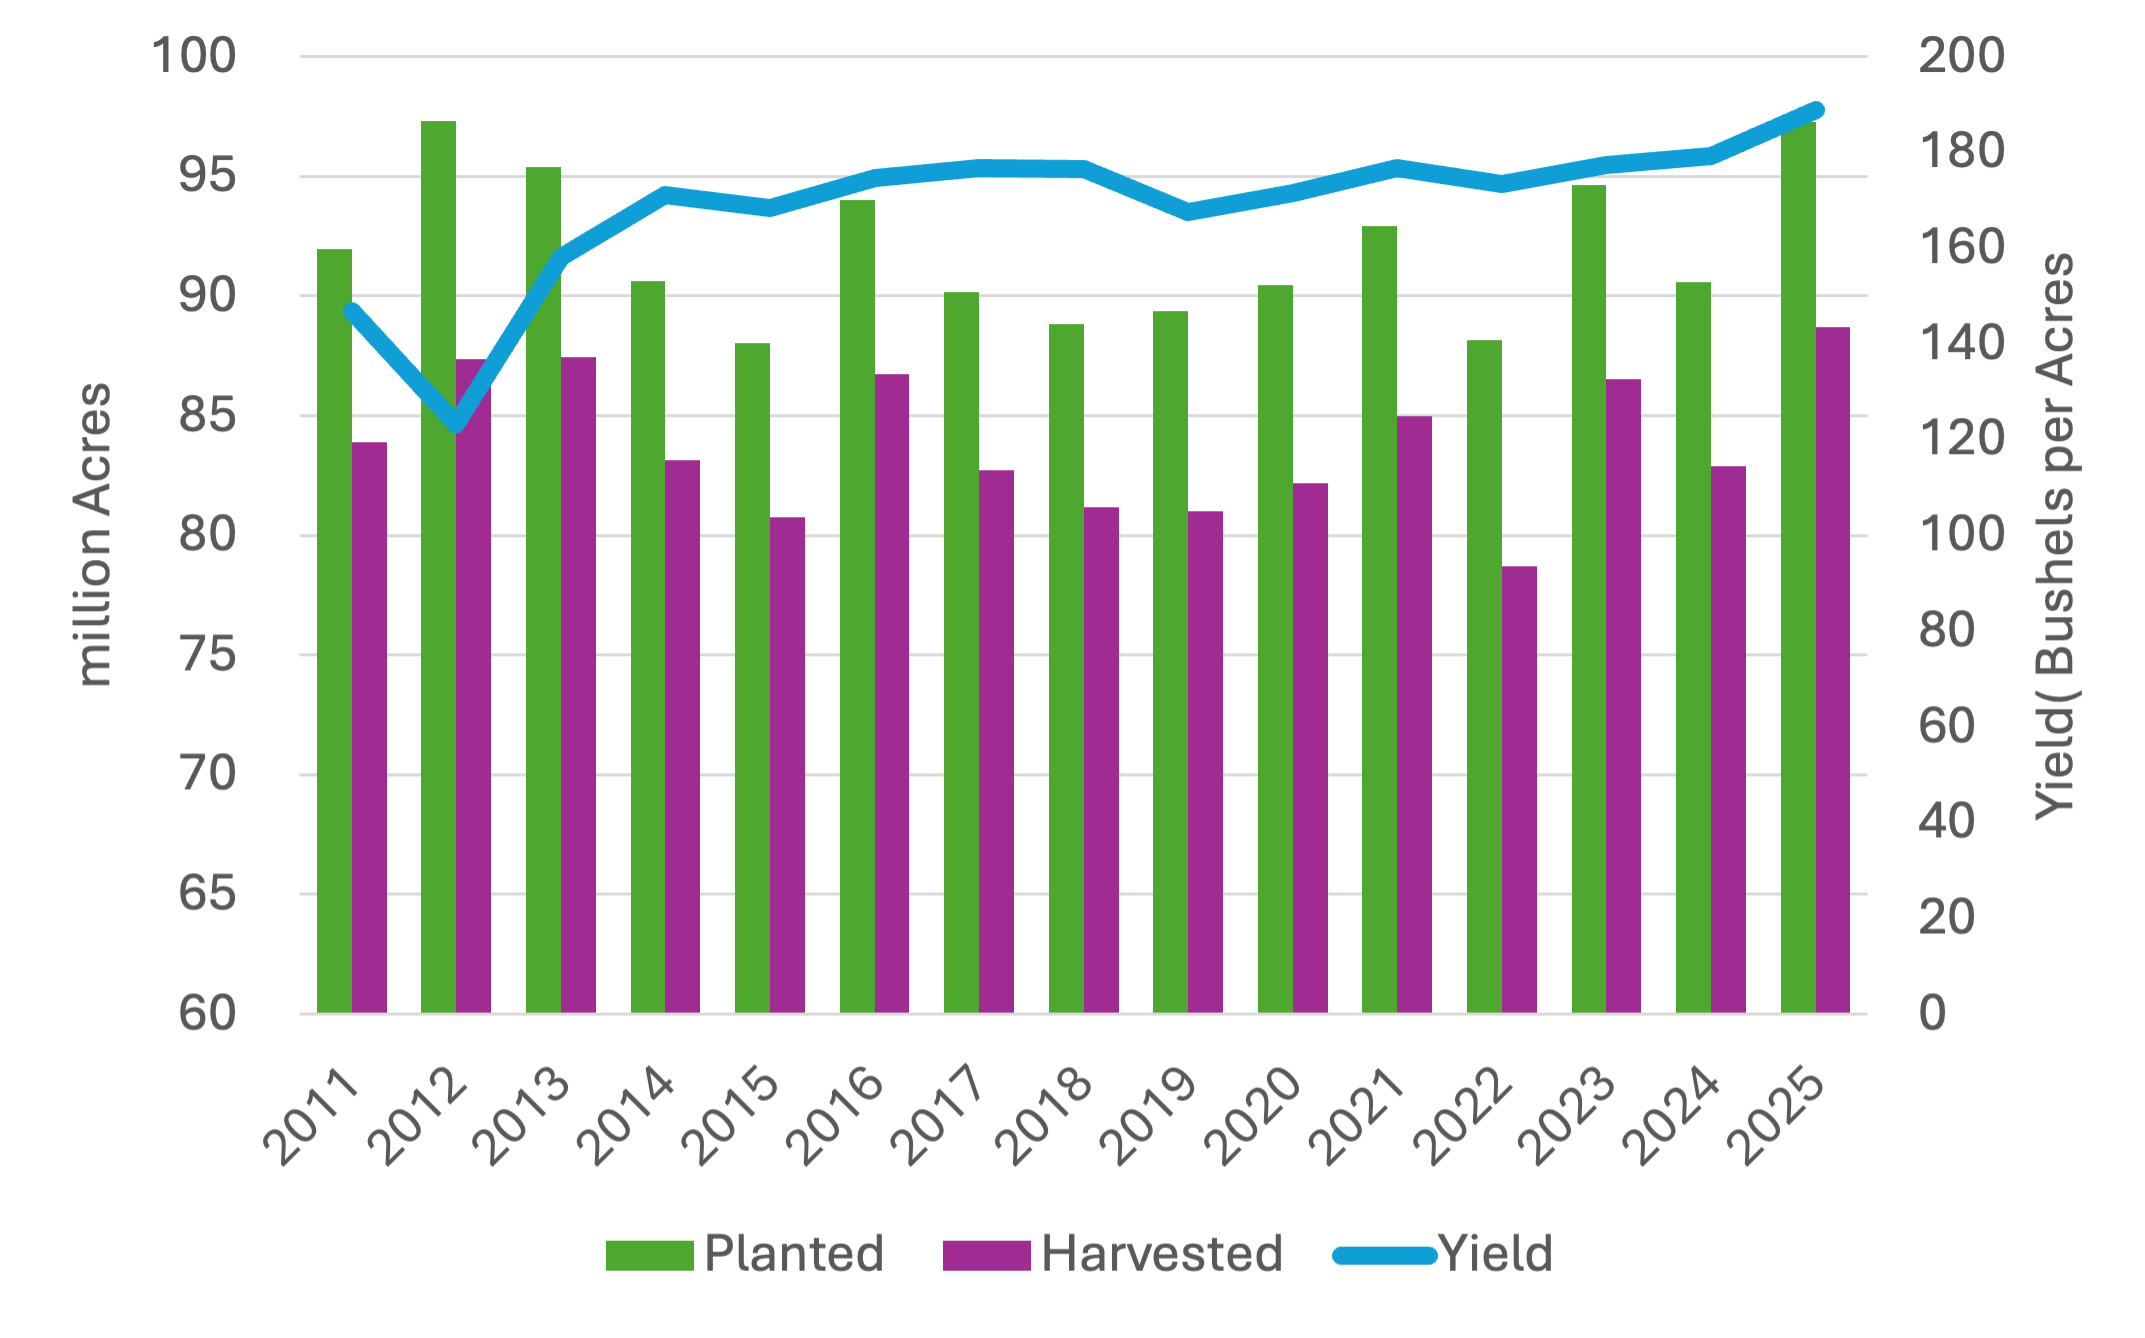
    All summer, much of the corn market conversation has focused on how strong the corn crop looks nationwide and the potential for a record-breaking harvest. The August WASDE, the first report of the year to incorporate yield estimates from the National Agricultural Statistics Service, confirmed that outlook. National corn yield was pegged at a record 188.8 bushels per acre, up 7.8 bushels from July. An additional 1.9 million harvested acres also pushed production to a forecasted 16.7 billion bushels, 1.4 billion more than the previous record set in 2023. While total U.S. corn use was raised to 16.0 billion bushels, the larger supplies still left the market facing the largest ending stocks since 2018 at 2.1 billion bushels. With that surplus, USDA trimmed the season-average price to $3.90 per bushel.                

    While corn is setting new supply records, soybean estimates were far less dramatic. USDA trimmed harvested area from 82.5 million acres to 80.1 million, but a higher yield estimate of 53.6 bushels per acre offset much of that reduction. As a result, 2025 production is forecast at 4.29 billion bushels. Lower supplies and sluggish export sales led USDA to cut export projections by 40 million bushels. Even so, the soybean balance sheet did tighten slightly, with ending stocks lowered by 20 million bushels to 290 million.

    Cotton’s supply outlook shifted sharply this month, with USDA cutting production estimates by 10 percent. Planted acres are now pegged at 9.28 million, down 9 percent from July. Persistent dryness in the Southwest pushed the abandonment rate higher, leaving harvested acres at 7.36 million. With more abandoned low-yield acres removed from the mix, the yield estimate rose to 862 pounds per acre. However, the acreage losses outweighed the yield gains and pulled production down to 13.21 million bales, 1.4 million fewer than last month. Exports were trimmed by 0.5 million bales, and ending stocks are now projected at 3.60 million bales, a reduction of 1 million from July.

    Overall, the latest WASDE report paints a mixed picture across key row crops. Corn is poised for a record harvest with ample supplies putting downward pressure on prices, while soybeans show modest tightening of the supply and demand situation. Cotton faces reduced acreage and production. As harvest progresses, market participants will be closely watching export demand and weather developments during harvest, which will play critical roles in shaping prices and supply dynamics through the rest of the year.

    Figure 1. U.S. Corn Yield, Planted Acres, and Harvested Acres, 2011–2025 (USDA – NASS)       


    Maples, Will. “USDA Projects Largest Corn Supply in History.Southern Ag Today 5(33.3). August 13, 2025. Permalink

  • Examining August FSA Data to Forecast Final Cotton Acreage

    Examining August FSA Data to Forecast Final Cotton Acreage

    Since 2011, the USDA’s Farm Service Agency (FSA) has provided monthly reports of crop acreage beginning in August.   This information is based on farmer reports of planted, prevented planted, and failed acres received and summarized to date.  A final acreage summary is released in January.  Beginning in October (occasionally in September), these data are used by USDA’s National Agricultural Statistics Service (NASS) for comparison to survey-based planted acreage estimates in the monthly Crop Production report. 

    In this article, we examined the relationship between the preliminary August FSA planted acreage and final FSA planted acreage for cotton.  We also looked at the relationship between final FSA planted acreage and NASS planted acreage.

    While FSA acreage data represents a census of planted acreage enrolled in farm programs, the FSA acreage data does not function as official USDA planted acreage estimates (because not all farms are enrolled in the farm programs administered by the FSA). The official planted acreage estimates are the responsibility of NASS, the statistical agency of the USDA.  

    As a starting point, we reviewed the relationship between the August and final (i.e., January) FSA planted acreage estimates for cotton (upland and Pima combined).  As noted in Figure 1, reporting during August 2020 was off significantly due to the reporting extension during the COVID pandemic. The data pre-2020 and post-2020 indicate all but a small percentage of planted acreage for cotton is generally reported to the FSA by August.  For example, over the 2015-2019 period, the average ratio of preliminary to final FSA planted acreage for cotton was 98.9 percent.  In recent years, 2021-2024, the average ratio increased to 99.7 percent in August. Arguably the period 2021-2024 is the most representative part of the sample for making 2025 forecasts. 

    Figure 1. Ratio of August to Final January FSA Estimate of U.S. Cotton Planted Acreage, 2015-2024

    We also looked at the relationship between the final FSA planted acreage and final NASS planted acreage (Table 1).  In the years 2015-2024, the acreage relationship is quite consistent.  For cotton, the final FSA estimate of planted acreage averages 98.2 percent of final NASS planted acreage with a range of 0.9 percent.   The consistency of the relationships can be attributed to the fact that enrollment in FSA farm programs varies relatively little from year to year.

    TablTable 1. U.S. Planted Acres of Cotton Estimated by NASS and Reported to FSA, 2015-2024

    YearNASSFSADifferenceFSA/NASS(%)
    20158,580,5008,450,939129,56198.5%
    201610,073,5009,927,191146,30998.5%
    201712,717,50012,413,314304,18697.6%
    201814,081,30013,824,448256,85298.2%
    201913,722,70013,405,957316,74397.7%
    202012,086,00011,834,619251,38197.9%
    202111,206,50011,025,710180,79098.4%
    202213,749,00013,530,779218,22198.4%
    202310,230,00010,077,091152,90998.5%
    202411,183,00010,997,089185,91198.3%
         
    Average  214,28698.2%
    Low  129,56197.6%
    High  316,74398.5%
    Source: USDA Farm Service Agency and National Agricultural Statistics Service.

    In 2025, historic spring rainfall disrupted cotton planting in some states, which has made for a challenging year.  Many industry observers questioned the NASS June Acreage survey that delivered much higher-than-expected cotton acreage estimates for the Midsouth region. The findings in USDA’s first monthly acreage report of 2025 will be of particular interest to the cotton industry.  The report will be released on August 12th and can be found at this link:  FSA Crop Acreage Data. The information in these reports is widely followed by the market for clues about possible future revisions to the official USDA planted acreage estimates. Based on recent history, this report is expected to provide a strong indicator for overall cotton acreage in 2025. 


    Stiles, H. Scott. “Examining August FSA Data to Forecast Final Cotton Acreage.Southern Ag Today 5(32.3). August 6, 2025. Permalink