Most of the milling, spinning, and textile manufacturing supply chain has moved from the Western world to developing countries, primarily Southeast Asia. U.S. textile manufacturing peaked in the 1994/95 marketing year with domestic use of cotton estimated at 11.198 million 480-pound bales. Since the 1994/95 marketing year, U.S. domestic cotton use has steadily declined to a projected record low of 1.75 million bales in the 2023/24 marketing year. As a result, exports are a significant source of demand for U.S. cotton. Since the early 2000s, exports, as a proportion of U.S. cotton production, have been on an upward trend, increasing from 39% in 2000 to a high of 112% in 2020. For the past decade, the U.S. exported, on average, 85% of the cotton produced domestically. The export market has been the driving force for U.S. cotton demand.
The highest quantity of U.S. cotton exports was achieved in 2005, with 17.7 million bales, and the second highest total U.S. cotton exports were achieved in 2020, with 16.4 million bales exported. Since 2020, U.S. cotton exports have been declining. For the 2023/24 marketing year, U.S. cotton exports are projected to be 12.3 million bales, the second-lowest quantity in the past decade.
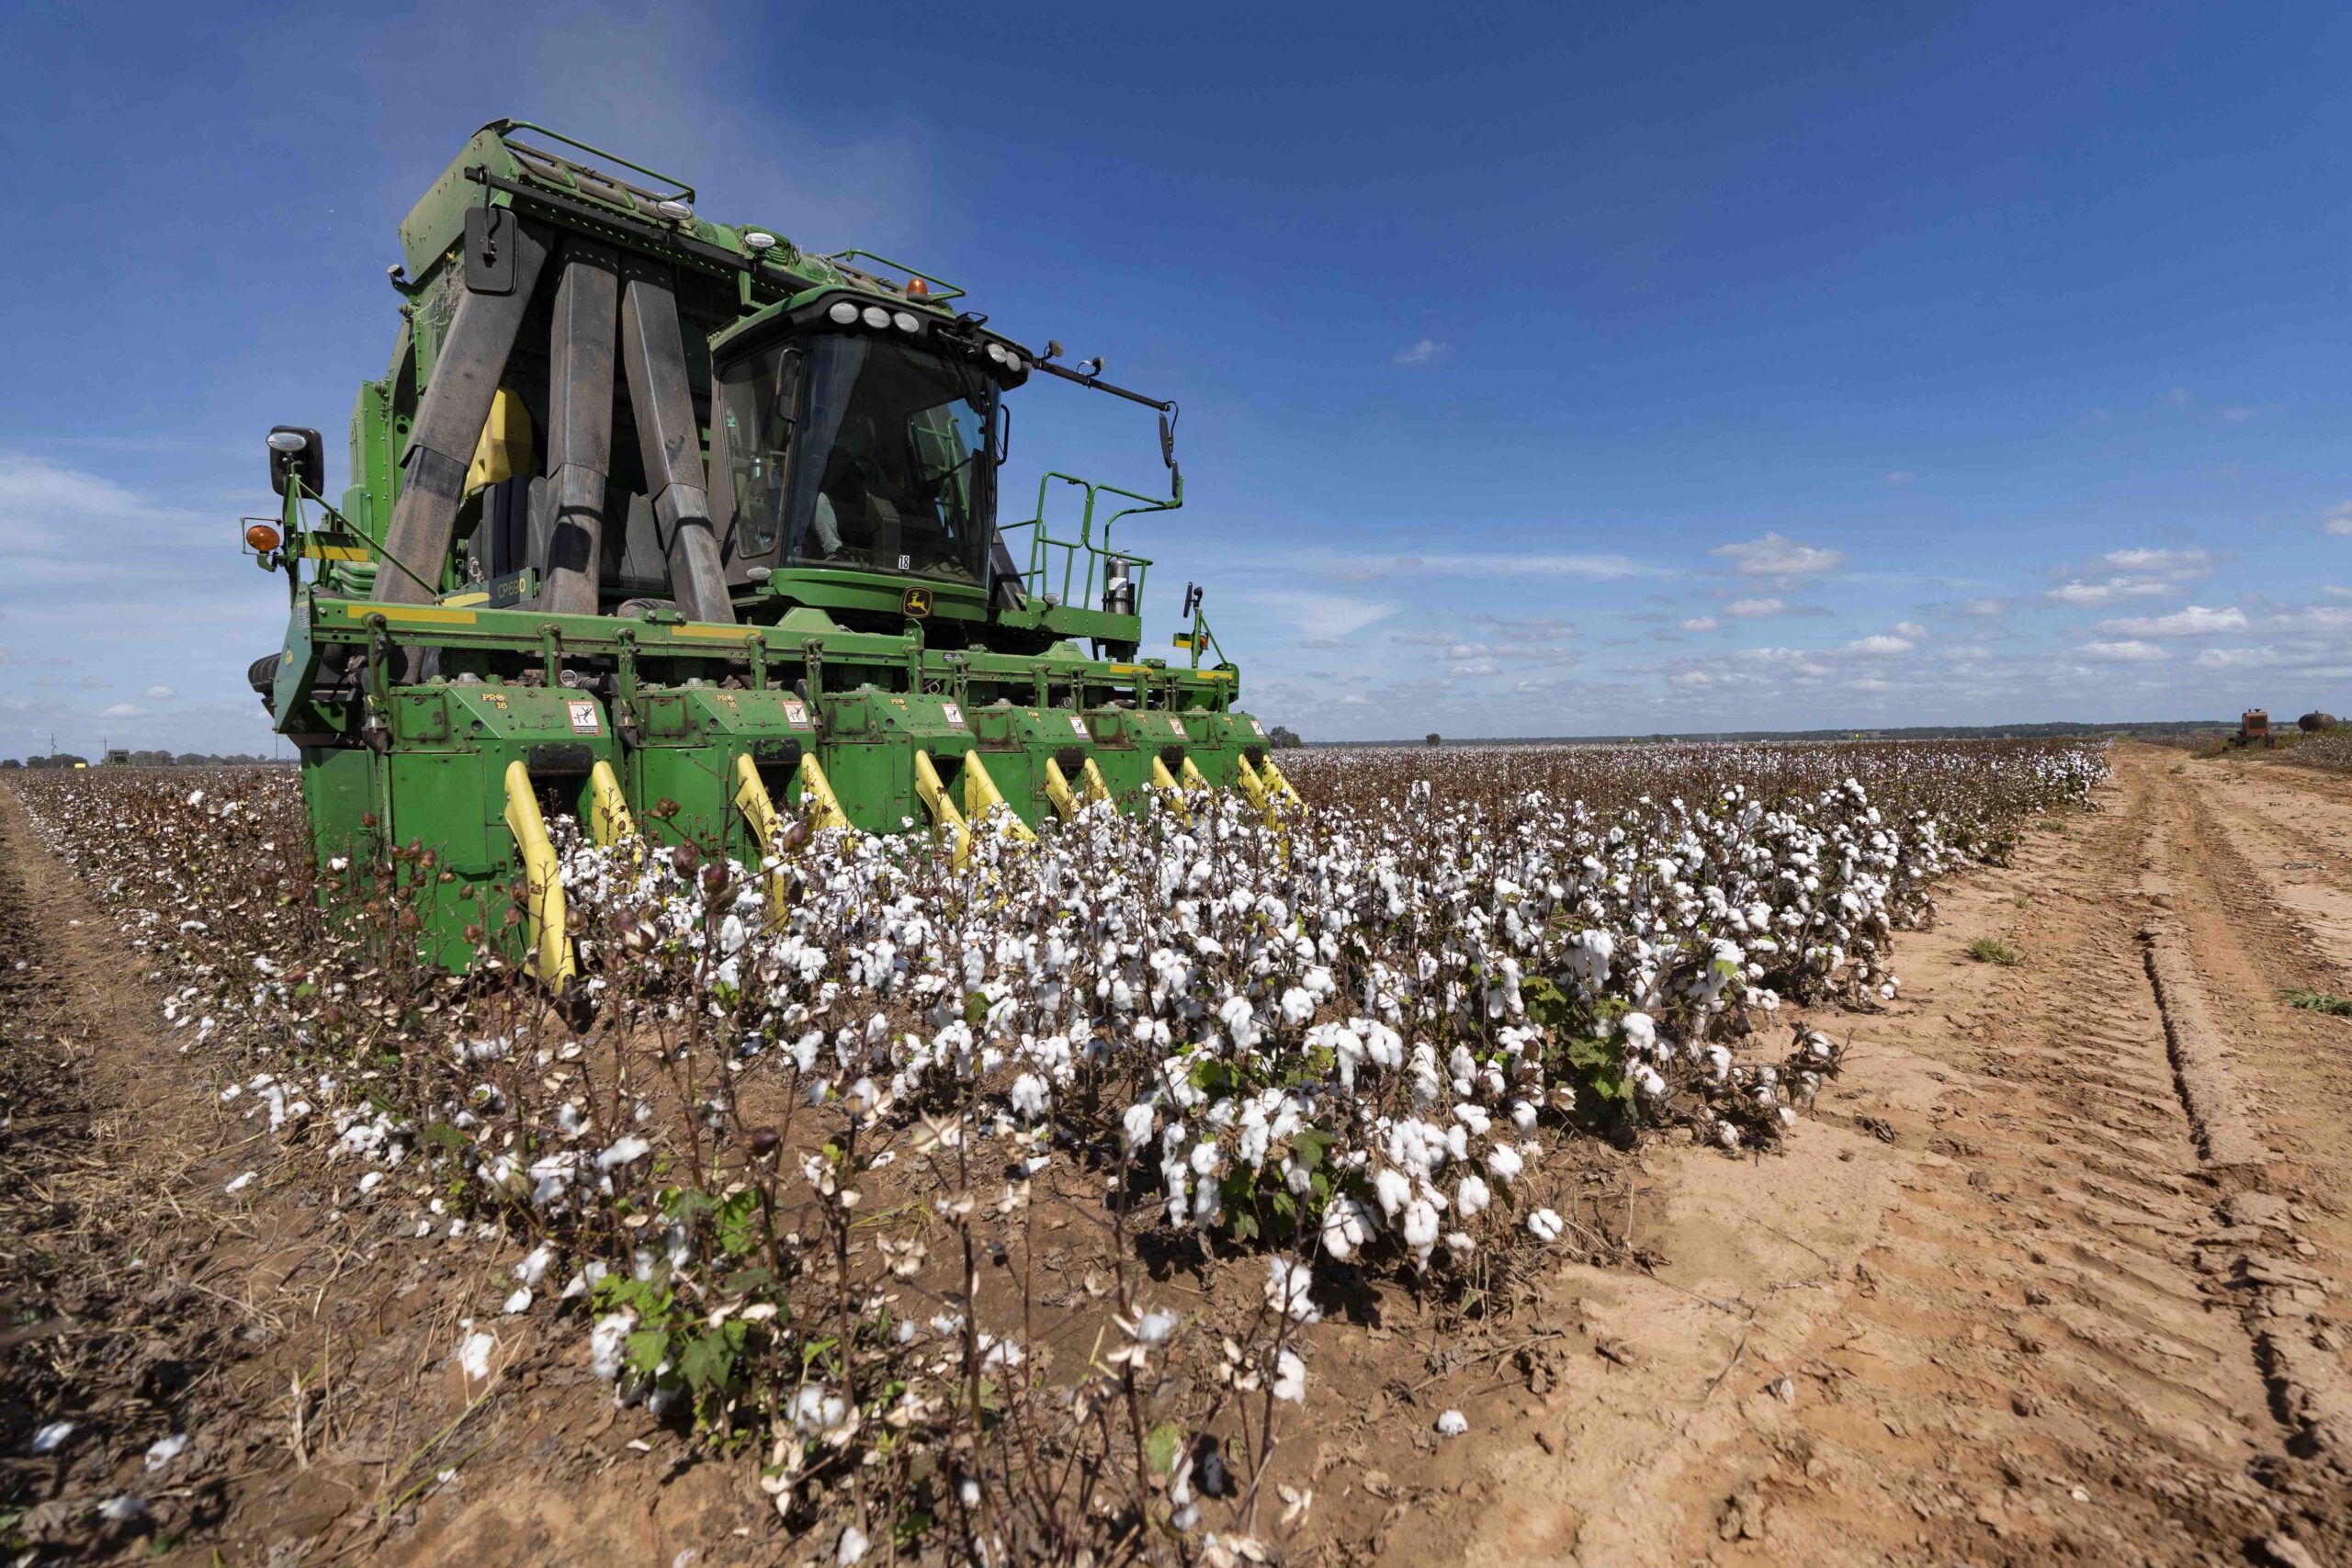
The quantity of U.S. cotton exports is impacted largely by total U.S. cotton production. When production is large, exports typically rise, and with lower production, U.S. cotton exports decline. In 2023, the United States planted 10.2 million acres of upland cotton, the lowest since 2016. The harvested area for upland cotton in 2023 was estimated at 7.06 million acres, down from 7.29 million acres the previous year, the second lowest harvested acres on record since 1866. U.S. cotton production is projected at 12.4 million bales for the 2023 crop, nearly 2 million bales below the 2022 crop and the lowest since 2009. In 2023, due to lower production, U.S. ending stocks were projected at 2.8 million bales. The U.S. stocks-to-use ratio is forecast at 19.9 percent for the 2023/24 marketing year.
As a result of lower production and increased competition, the United States is losing global market share, declining from a peak of 39% in both 2016 and 2017 to 29% in 2023. The last time the U.S. market share was below 30% was in 2015, when the Unites States planted the second-fewest annual cotton acres in more than 100 years. After that, the U.S. market share recovered quickly with a rebound in production. However, it could be different for 2023, with more competition in the global cotton export market. Brazil has become a significant global cotton producer and exporter. In 2023, Brazil surpassed the United States and became the third-largest cotton-producing country after China and India. Brazil has become the second largest cotton exporting country and is projected to export 11.2 million bales of cotton in 2023, only 1.1 million bales lower than the United States. Increased competition will make it difficult for the United States to recover global market share. Supply and demand for U.S. cotton determines the prices for U.S. cotton producers. Even though there is a smaller global market share, U.S. production was low in the 2023/24 marketing year, leading to a high percentage of U.S. production being exported and cotton prices staying stable in the low 80s. This was prior to the bump in the last month in cash prices into the 90-cent range. However, with the increase in global production, a lot will depend on whether U.S. production rebounds, resulting in lower cotton prices. Lower cotton prices might then result in a decline in future cotton acreage in the United States.
Figure 1. U.S. cotton exports, market share in the global market, and export as a proportion of U.S. production.

References and Resources:
USDA Foreign Agricultural Service. Production Supply and Distribution. Exports, Production, and Domestic Use. Available at: https://apps.fas.usda.gov/psdonline/app/index.html#/app/advQuery.