Category: Crop Marketing

  • USDA Acreage Report Results: Price and Crop Insurance Impacts

    USDA Acreage Report Results: Price and Crop Insurance Impacts

    Throughout the year, the United States Department of Agriculture (USDA) updates its estimates of U.S. supply and demand factors for selected crops. This article explores projection updates, via the USDA Acreage Report (AR), released on June 30, 2023, and marketing and risk management implications. The initial estimates for the 2023/24 growing season planted acreage were released in February at the USDA Agricultural Outlook Forum (AOF) (Smith and Gardner, 2023). The estimates were then updated in March via the Prospective Planting Report (PPR) (Biram and Maples, 2023). Projected acreage for five crops (corn, soybeans, wheat, rice, and cotton) and the percentage change in acreage estimates can be found in Table 1.

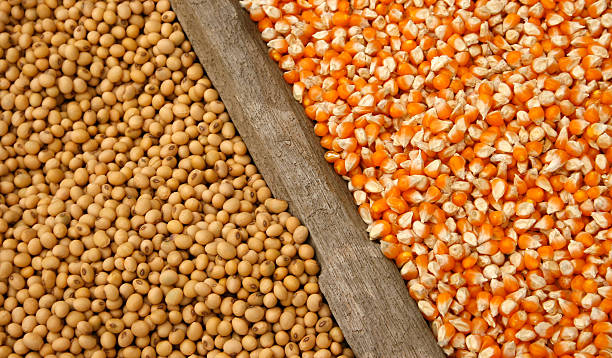
    The initial estimate for corn acreage was 91 million acres in February, which was increased to 92 million in March, and now sits at 94 million in June. This is the third-highest number of acres planted to corn since 1944 (USDA-NASS, 2023). It is worth noting that corn harvested for grain makes up a smaller number of acres at 86.3 million acres but is still up 9% from last year (USDA-NASS, 2023). Estimated soybean acreage dropped 4.6% to 83.5 million acres in the most recent acreage report, whereas wheat acreage has been similar in all three reports. Rice acres have increased sequentially by month and are up 7.5% from the initial February projection. Cotton acres increased from 10.9 million acres to 11.3 million acres in March before finding common ground at an estimated 11.1 million planted acres in June. 

    Looking at the possible price impacts in the acreage report, we take a close look at corn and soybeans, which have experienced the largest acreage changes. Recent upticks in the prices of both commodities have been driven by drought throughout major crop-producing states, causing a weather induced “crop scare event.” During this crop scare, the drought impacted corn and soybean supply expectations which caused market and futures prices to increase drastically. Prices peaked on June 21st and began to fall due to rainfall in key production states such as Indiana, Illinois, and Iowa. The large increase in corn acreage in the June acreage report will make the corn market price less susceptible to future supply shocks, causing a lower price environment. However, the opposite may hold true for soybeans which have dropped 4 million acres. As there are fewer soybean acres than previously projected, soybean prices could be more susceptible to further price increases due to detrimental weather, which causes deterioration in crop conditions and expected yield.

    Corn and soybeans had complete opposite price responses to the June Acreage Report, with the corn price decreasing 33 cents to $4.95/bu and soybeans increasing 77 cents to $13.42/bu. Rough rice and cotton futures had essentially no response to the June acreage report with rough rice remaining flat at $15.25/cwt and cotton only increasing to 80.37 cents/lb from 79.04 cents/lb. A marketing tool  available to producers that could be considered is buying a put option to place a floor on the futures price. A put option gives the right but not the obligation to sell a futures contract at the strike price specified in the put option contract, so long as the futures price is below the strike price at the time the option is exercised (i.e., “in the money”). Producers can use this strategy to protect against futures market price declines while allowing them to benefit if prices rally. See Biram and Smith (2022) for an explanation of using options to augment one’s risk management plan. Additionally, producers can manage price risk in their local cash market by locking in prices received at harvest at a local grain elevator or grain purchaser through forward contracting (see Maples, 2023). 

    Lastly, we take a look at the potential price protection a producer has if they purchased crop insurance by considering the futures price as of the afternoon of June 30, 2023, relative to the Projected Crop Insurance Price released by USDA-RMA in the winter (Table 2). Harvest month futures contracts for corn, soybeans, rice, and cotton are lower relative to their respective Projected Price with corn having a substantially lower price. Notably, if the 2023 growing season were to end today, holding 2023 harvest yield the same as APH yield, 85% Revenue Protection would already trigger an indemnity for corn with ZCZ23 being 83% of the Projected Price. The current harvest month corn futures price would also trigger an indemnity under Enhanced Coverage Option (ECO) and Supplemental Coverage Option (SCO), assuming no difference in the county expected harvest yield and established APH. This is because ECO and SCO  trigger an indemnity once county-level revenue falls below 95% and 86% of the county-level revenue guarantee, respectively. We also see ECO would trigger an indemnity for rice, assuming no change in the expected harvest yield.

    Table 1: Acres Planted by USDA Report and Percentage Change

    ReportAOFPPRAR% Change from February% Change from March
    MonthFebruaryMarchJune
    Corn Acres (Millions)9192.094.13.4%2.3%
    Soybean Acres (Millions)87.587.583.5-4.6%-4.6%
    Wheat Acres (Millions)49.549.949.60.3%-0.5%
    Rice Acres (Millions)2.52.62.77.5%4.0%
    Cotton Acres (Millions)10.911.311.11.7%-1.5%

    Table 2. Current Futures Price as a Percentage of RMA Projected Crop Insurance Price

    CropFutures PriceProjected PriceFutures Price as % of Projected Price
    Corn (ZCZ23)$4.95/bu$5.94/bu83%
    Soybeans (ZSX23)$13.42/bu$13.65/bu98%
    Rough Rice (ZRX23)$15.25/cwt$16.90/cwt90%
    Cotton (CTZ23)80.31 ¢/lb85.00 ¢/lb95%

    References:

    Biram, Hunter, and William E. Maples. “Key Takeaways and Reliability of the 2023 Prospective Plantings Report.” Southern Ag Today 3(14.1). April 1, 2023. Permalink

    Biram, Hunter, and S. Aaron Smith. “The Option to Augment the Crop Insurance Price Floor“. Southern Ag Today 2(35.1). August 22, 2022. Permalink

    Maples, Will. “Considerations for Developing a Pre-Harvest Marketing Plan.” Southern Ag Today 2(47.1). November 14, 2022. Permalink

    Smith, Aaron, and Grant Gardner. “February USDA Agricultural Outlook Forum Projections Compared to USDA Final Estimates.” Southern Ag Today 3(10.1). March 6, 2023. Permalink

    United States Department of Agriculture. “Cotton Outlook,” 2023. https://www.usda.gov/sites/default/files/documents/2023AOF-grains-oilseeds-outlook.pdf.

    United States Department of Agriculture. “Grain and Oilseeds Outlook,” 2023. https://www.usda.gov/sites/default/files/documents/2023AOF-grains-oilseeds-outlook.pdf.

    USDA-NASS. “Acreage” 2023. https://downloads.usda.library.cornell.edu/usda-esmis/files/j098zb09z/hh63v8465/zg64w269x/acrg0623.pdf

    USDA-NASS. “Prospective Plantings Report” 2023. https://downloads.usda.library.cornell.edu/usda-esmis/files/x633f100h/rv044597v/gx41nz573/pspl0323.pdf

  • Interest Rates and Grain Storage

    Interest Rates and Grain Storage

    For the 2023/24 marketing year, higher interest rates will negatively impact producers’ costs for holding grain in storage, especially for producers utilizing operating loans. This article expands on the recent Smith and Johnson Southern Ag Today article to examine operating loan interest costs of storing grains at different interest rates and lengths of time and how to calculate operating loan interest costs when grain is stored. The article also provides charts to depict the change in operating loan interest cost of storing corn, soybeans, and wheat. For example, an increase in interest rate from 4% to 8% will increase the storage costs of corn stored for five months by 112.5% or $0.09/bushel. 

    The Federal Reserve began increasing the Federal Funds rate in February 2022 to combat inflation. When the Federal Reserve raises the Federal Funds rate, the prime rate increases. The prime rate is used as a reference interest rate for many types of loans, including operating, term, and credit card loans. On May 4, 2023, the prime rate reached 8.25%, the highest since 2006/07. Higher interest rates impact every aspect of a farming operation, including marketing strategies, especially producers using operating loans to hold grain in storage. Typically, operating loans are variable interest rate, meaning they are not fixed but increase when the prime rate changes; however, some lenders have started offering fixed-rate operating loans to provide customers with cost certainty. Operating loans are used to pay for inputs until grain can be sold and the operating loan paid back. There is an interest cost for holding grain in storage compared to selling at harvest and paying down operating loans. Grain in storage typically allows producers to increase profit through marketing strategies which utilize market or basis carry. However, the operating loan interest costs need to be accounted for when interest rates are elevated. 

    The operating loan interest cost on a dollar-per-bushel basis can be calculated by multiplying the harvest price by the interest rate and dividing the number of months the crop is stored by 12. For example, a producer that holds corn harvested in October until March (5 months), has an operating loan interest rate of 8% and is expecting a harvest price of $5.00/bushel would have operating loan interest costs of storage of $5.00 × 0.08 × (5/12). 

    Figures 1, 2, and 3 show the impact of the number of months of storage and interest rates on corn, soybeans, and SRW wheat operating loan storage costs. Harvest prices are assumed to be $5.00/bu for corn, $12.00/bu for soybeans, and $6.00/bu for SRW wheat. The storage costs increase the longer grain is stored. Additionally, costs increase as the price of the commodity increase, i.e., interest costs are higher for soybeans than corn or SRW wheat. 

    The table at the bottom of each chart can be used to estimate increased operating loan interest costs for grain held in storage due to climbing interest rates. Following our previous example, if corn is harvested in October for March delivery (5 months) and the interest rate is 4%, operating loan interest costs of storage for $5 corn would have been $0.08/bu. When the rate increases to 8%, closer to current rates, the operating loan interest costs of storage are $0.17 per bushel. This result indicates an increased operating loan interest cost of $0.09/bu ($0.17 minus $0.08), a 112.5% increase due to a 4% increase in interest rates. 

    In conclusion, high-interest rates increase the storage costs for producers holding grain via an operating loan, affecting each operation’s bottom line and potentially negating the price benefits of storage. Storage costs are rising with interest rates and should be accounted for in your grain marketing decisions. 

    Figure 1: Impact of Interest Rates Increases on Corn Storage Costs

    Figure 2: Impact of Interest Rate Increases on Soybean Storage Costs

    Figure 3: Impact of Interest Rate Increases on SRW Wheat Storage Costs

    References

    Smith, Aaron, and William “Bill” Johnson. “The Impact of Interest Rates and Basis on Net Cash Price for Corn.” Southern Ag Today 3(23.1). June 5, 2023.


    Gardner, Grant. “Interest Rates and Grain Storage.Southern Ag Today 3(26.1). June 26, 2023. Permalink

  • The Relationship Between Wheat Stocks Held by Exporting Countries, Global Imports, and the U.S. Marketing Year Average Price  

    The Relationship Between Wheat Stocks Held by Exporting Countries, Global Imports, and the U.S. Marketing Year Average Price  

    There is no statistical relationship between the wheat stocks-to-use ratio and the U.S. Marketing Year Average (MYA) price. From 2000 to 2022, the linear relationships between U.S. and world stocks-to-use and price indicated an R-squared of 0.0138 and 0.0024, respectively (Figure 1).  R-squared (R2) is a measure that represents the proportion of the variance for a dependent variable (MYA price) that’s explained by an independent variable (stocks-to-use) in a regression model. Simply stated, U.S. stocks-to-use explains 1.38% of the variance in the MYA wheat price. For comparison, a simple linear regression for U.S. corn price and stocks-to-use ratio results in an R2 of 0.56. Wheat provides many unique challenges for projecting prices. Different classes exist – hard red spring, hard red winter, soft red winter, hard white, soft white, and durum – that influence the USDA wheat MYA price. Additionally, wheat is one of the most geographically dispersed crops, with production in both hemispheres and six continents. U.S. wheat production is a small percentage of global production. From 2000 to 2022 the U.S. has accounted for 5.7% (2022) to 11.5% (2003) of global production. Thus, international forces have a greater impact on U.S. wheat prices compared to corn and soybeans. 

    However, there is a statistical relationship between stocks held by major exporters (Argentina, Australia, Canada, European Union, Russia, Ukraine, and U.S.), world wheat imports, and the U.S. MYA wheat price (Figure 2). This relationship has an R2 of 0.4198 – meaning stocks held by major exporters divided by world imports explains less than half the variance in MYA wheat prices. For the 2022/23 marketing year, the seven major exporters held ending stocks of 60.5 million metric tons (MMT) and total world imports were estimated at 207.2 MMT, a ratio of 0.29:1. The 2022/23 USDA estimated MYA price is $8.85/bu. Using the linear relationship between this ratio and MYA price would have predicted a price of $6.67/bu for the 2022/23 marketing year, or $2.17/bu under the USDA’s May estimate. However, using the linear relationship, this is the largest under estimation of price from 2000 to 2022, and the average miss of MYA price compared to the estimated relationship trendline over this time period is +/- $1.13/bu.  This larger-than-average discrepancy between the predicted price and MYA price can partially be explained by Russia’s invasion of Ukraine which created chaos in global wheat markets in 2022 and skewed prices due to concerns over production and access to supplies in both countries. 

    What does this relationship mean for the wheat MYA price for the 2023/24 marketing year? Currently, USDA projects ending stocks for the seven major wheat exporters at 52.8 MMT and world wheat imports at 207.5 MMT, a ratio of 0.255:1. Using the simple linear relationship in Figure 2, this would predict a U.S. MYA price of $7.06/bu.  However, using plus and minus the average miss, we can obtain a price range of $5.93/bu to $8.19/bu. This projection seems reasonable given the current futures market prices for wheat. However, it should be restated that this relationship has limitations (R2 of 0.4198), meaning that other factors strongly influence wheat MYA prices. An escalation of the Ukraine-Russia conflict or other geopolitical / global events could have a dramatic influence on U.S. MYA wheat prices in 2023/24. 

    Figure 1. The Relationship between U.S. Wheat Marketing Year Average Price and U.S. and World Stocks-to-Use Ratio, 2000/01 to 2022/23

    Figure 2. U.S. Marketing Year Average Price and Stocks held by Major Exporters divided by World Imports, 2000/01 to 2022/23 

    References:

    U.S. Department of Agriculture Foreign Agricultural Service (USDA – FAS). Production, Supply, and Distribution (PS&D) Accessed at: https://apps.fas.usda.gov/psdonline/app/index.html#/app/home  

    U.S. Department of Agriculture National Agricultural Statistics Service (USDA – NASS). Quick Stats Accessed at: https://www.nass.usda.gov/Quick_Stats/

  • Our Most Read Articles for 2022-2023

    Our Most Read Articles for 2022-2023

    Every July at the Southern Extension Committee Meetings, Southern Ag Today likes to take the opportunity to recognize our authors for all their hard work. We look at all the articles written over the past year May 2022 – April 2023 and decide which were read, viewed, and shared the most using our analytics. We are pleased to announce our 2022-2023 winners.

    Overall Winner – Yanshu Li, “Do I need to pay the Net Investment Income Tax on my timber income?

    Crop Marketing Monday Winner Hunter Biram & Will Maples, “Key Takeaways and Reliability of the 2023 Prospective Planting Report

    Livestock Marketing Tuesday David Anderson, “Another Week, Another Record

    Farm Management Wednesday Max Runge, “ Wheat Straw Nutrient Removal

    Policy/Trade Thursday Bart Fischer and Joe Outlaw, “An Early Look at the Farm Safety Net for Cotton in 2023

    AgLaw/Specialty Topics Friday (Cooperatives) – John Park,   “Should We Form a Cooperative?

  • Difficulty in Forecasting 2023 U.S. Cotton Production

    Difficulty in Forecasting 2023 U.S. Cotton Production

    It is frequently challenging to forecast crop production because of varying local weather and crop conditions.  In the case of upland cotton, the situation is further complicated by plant biology. The major row crop substitutes to U.S. cotton include corn, sorghum, wheat, soybeans, and peanuts. The first three of these are annual grasses, while the latter are annual legumes. The reproductive strategy of these annuals is to produce as much seed (yield) as allowed by weather and soil conditions. As a result, aggregate yields of annual crops are often thought to be well correlated with weekly crop condition rates. 

    In contrast, upland cotton is relatively more complicated in its growth habits and resulting predictability.  The reason is that cotton is a perennial in its native tropical environment, akin to a crepe myrtle bush.  When grown as an annual crop in temperate regions, cotton plants can still shift back and forth between vegetative and reproductive growth.  This mixed and indeterminate growth habit is illustrated by a poor visual inspection of the weekly cotton crop condition and the resulting Texas average cotton yield (Figure 1).  The Texas aggregate situation is even further complicated by the range of planting dates, from March-April in southern Texas to May-June in northwestern Texas.  Such phenomena in Texas can have a major influence on U.S. production estimates since Texas represents over half of U.S. planted acreage (USDA NASS). 

    The situation in 2023 is further complicated by a mid-year shift in the weather.  The first quarter of 2023 saw severe drought conditions over much of Texas (Figure 2, left panel).  Widespread and repeated rains since April have reportedly helped developing crops in southern Texas while complicating planting in northwestern Texas.  How much the latter will contribute to more or less cotton production is unknown. It is possible that the State will realize prevented planting from drought preceding prevented planting from too much rain.  With much of the growing season still ahead, further shifts in weather may also occur.  It may not be until early fall before we have reliable forecasts of the resulting production outcome.

    Figure 1. Texas Cotton Crop Condition Index

    Source USDA/NASS

    Figure 2. U.S. Drought Monitor Maps from March 7, 2023, and June 6, 2023


    Robinson, John. “Difficulty in Forecasting 2023 U.S. Cotton Production.Southern Ag Today 3(24.1). June 12, 2023. Permalink