Category: Crop Marketing

  • 2023 Peanut Market Outlook

    2023 Peanut Market Outlook

    U.S. peanut production decreased in 2022, driven by both lower acres harvested and lower yields. Peanut acres planted were down by 8% nationwide, to 1.46 million acres. Yields dropped by 2.7% from 2021 to 4,019 lb. per acre nationwide. Georgia – the largest producing peanut state – saw yields fall to 4,250 lb. per acre, a 200 lb. per acre drop, as its crop was affected by the tomato spotted wilt virus. The main driver of the lower nationwide yields came from drought-stricken Texas, which had a 21.6% decline in yield to 2,800 lb. per acre, its lowest value since 2011. Furthermore, Texas saw 25% of its planted acreage go unharvested due to the drought. Total peanut production in the U.S. is estimated at 2.8 million tons, a 12% decrease from 2021 (orange line in Figure 1). 

    On the demand side, peanut use is expected to decline by 4% this marketing year (bars in Figure 1). This is primarily due to a 7% forecasted decrease in exports. Food – which makes up the largest portion of peanut disappearance – is projected to increase by 1% from 2021. A 13% increase in peanut candy consumption kept peanut food use from falling much during the 2021-2022 marketing year, despite decreases in disappearance for peanut snacks, peanut butter, in-shell peanuts, and other edible peanut products. Over the first five months of the 2022-2023 marketing year (August through December), the quantity of peanuts used for peanut butter is at record levels, up 2.9% over the same period last year. This is crucial because over half the peanuts used for food end up as peanut butter. 

    Peanut carryover at the end of the marketing year is expected to decrease by 8% to 1.1 million tons. While peanut supply and demand factors are not the main drivers of peanut prices, peanut prices are expected to remain high amid the projected lowered peanut stocks. The expected price for the 2022-2023 marketing year is at $540 per ton, which would be the highest level in ten years. This comes as high prices for several alternative crops boost competition for peanut acreage this Spring.

    Figure 1. U.S. Peanut Production, Stocks, and Disappearance by Year

    Data Source: USDA Economic Research Service. Oil Crops Outlook: February 2023.

    Photo by Marina Leonova: https://www.pexels.com/photo/close-up-shot-of-peanuts-7717463/

    Sawadgo, Wendiam. “2023 Peanut Market Outlook.” Southern Ag Today 3(8.1). February 20, 2023. Permalink

  • Possible Extreme Outcomes for 2023 Cotton

    Possible Extreme Outcomes for 2023 Cotton

    U.S. cotton production is typically uncertain in any given year, in part because roughly half the acreage is in Texas.  Still, the 2023 season is starting off with a more than usual degree of uncertainty.

    First, the early season forecasts of U.S. cotton plantings vary by as much as two million acres, i.e., from 9.5 to 11.5 million acres.  Such a discrepancy puts a premium on the milestone planting intentions reports from the National Cotton Council (released February 12) and USDA (March 31 Prospective Plantings report and June 30 Acreage report).

    The weather is a second major source of variability.  The National Oceanic and Atmospheric Administration’s Climate Prediction Center (CPC) is forecasting a transition from the hotter/drier La Niña condition to a neutral influence by late Spring.  CPC further predicts the onset of the cooler/wetter El Niño condition by early Fall.  That’s all well and good, but there is uncertainty around all weather forecasts.  Will the beginning dryness lead to above average early season abandonment?  Or will neutral El Niño-Southern Oscillation (ENSO) conditions by planting time surprise us with timely planting rains and good growing conditions?

    The third consideration is whether the recent signs of improving cotton demand will continue.  There is plenty of uncertainty about whether the broader economy is recovering or entering a double dip recession.  

    These three variable situations outline some possible extremes.  If, for example, U.S. cotton growers plant a low level of acreage, and it continues dry, and abandonment is above average, and demand continues to recover, the result could be ending stocks below 3 million bales.  Historically, it suggests that Dec’23 futures might follow the seasonal path of the green line in Figure 1, strengthening as the growing season goes on.  In the context of this year’s price levels, it suggests a march back up through the 90s towards a dollar.

    On the other hand, what if 11+ million acres are planted and receive timely rains?  That could lead to three million more bales of production than the first scenario.  If demand doesn’t recover enough to absorb these bales, the carryover outcome could be five or six million bales.  In years of building excess stocks, the historical seasonal average of December ICE futures reflects weakening prices.  The pattern of the blue line in Figure 1 could push prices under 80 cents.

    Figure 1’s red line reflecting “Stable Carryover” years is simply the in between scenario, with middling implications for ending stocks and prices. The level of these seasonal averages isn’t as important as the pattern itself.  Time will tell how all these variables play out.  

    Figure 1. December Futures Seasonal Average Price in Stable, Larger and Smaller Carryover Years

    Author: John Robinson

    Professor and Extension Economist


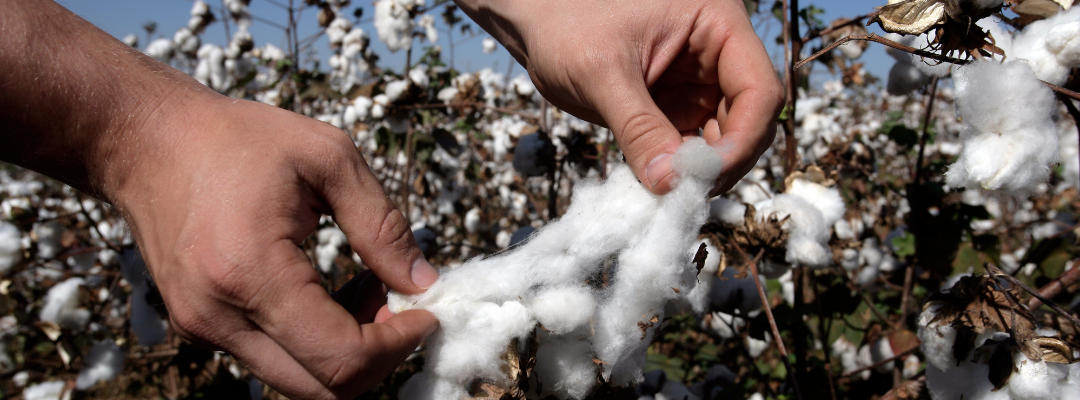
    Cotton Photo by Mark Stebnicki: https://www.pexels.com/photo/plantation-of-cotton-in-a-cropland-10287687/

    Robinson, John. “Possible Extreme Outcomes for 2023 Cotton.Southern Ag Today 3(7.1). February 13, 2023. Permalink

  • Do Corn and Soybean Harvest Futures Rise or Fall During the February Projected Crop Insurance Price Determination Period?

    Do Corn and Soybean Harvest Futures Rise or Fall During the February Projected Crop Insurance Price Determination Period?

    For corn and soybean producers, activity in futures markets in February is very important. For many producers, projected crop insurance prices and volatility factors are determined from February 1-28. The projected price will set revenue guarantees and potentially affect planting decisions. At the start of February 2023, December 2023 corn futures ($5.94) were slightly above last year’s projected crop insurance price of $5.90 per bushel and November 2023 soybean futures ($13.65) were well below last year’s futures price of $14.40. The direction of prices from now until the end of February will be key for producers when examining risk management and marketing strategies for the 2023 crop.

    Every year, during winter producer meetings, when discussions turn to risk management and marketing strategies, someone inevitably states that December corn and November soybean futures tend to fall during the projected crop insurance price determination period (February 1-February 28, in Tennessee and numerous other Mid-South states). This statement usually coincides with the assertion that external forces (government and/or global grain companies) are moving markets to reduce premium expense or foster utilization of other price risk management tools to boost profits. 

    Does a simple analysis support this? No. From 2010 to 2022, the data does not back this claim (Figures 1 and 2). Instead, the data shows prices follow the month-over-month price trend. For example, December corn average monthly prices from December to April declined in 2010, 2013, 2015, 2019, and 2020. For 2011, 2014, 2018, 2021, and 2022, December corn futures prices increased. The remaining years 2012, 2016, and 2017, showed no trend and moved mostly sideways over the five-month interval. For the November soybean contract, average monthly prices from December to April declined in 2013, 2015, 2017, 2019, and 2020. For 2011, 2012, 2014, 2016, 2018, 2021, and 2022, November futures contract price increased. The remaining year, 2010, had no trend and moved mostly sideways over the five-month interval.

    What does this mean for the 2023 crop insurance price determination period? Not much. This is a backward-looking metric; the trend is not revealed until the trend has occurred. However, a small month-over-month average decline occurred between December and January for both corn and soybean harvest futures. The final projected crop insurance prices for corn and soybeans will be important to producer marketing and risk management decisions moving forward.

    Figure 1. Monthly average December corn futures prices from December to April, 2010-2023

    Figure 2. Monthly average November soybean futures prices from December to April, 2010-2023

    References

    Barchart.com. December Corn and November Soybean Historical Daily Closing Prices. Accessed at: https://www.barchart.com/futures/quotes/ZCZ23/historical-download and https://www.barchart.com/futures/quotes/ZSX23/historical-download

    USDA – Risk Management Agency (RMA). Price Discovery. https://prodwebnlb.rma.usda.gov/apps/pricediscovery

    Author: S. Aaron Smith

    Associate Professor, Crop Marketing Specialist

    University of Tennessee


    Smith, S. Aaron. “Do Corn and Soybean Harvest Futures Rise or Fall During the February Projected Crop Insurance Price Determination Period?Southern Ag Today 3(6.1). February 6, 2023. Permalink

  • Traditional Stock-to-Use Ratios are of Little Value in Determining Peanut Prices

    Traditional Stock-to-Use Ratios are of Little Value in Determining Peanut Prices

    A common approach adopted by analysts and researchers is to investigate the relationship between the marketing year average price and the stocks-to-use ratio.  The stocks-to-use ratio (S/U) is often cited as an easy representation of the relationship between supply and demand.  When the S/U ratios are low, the supply of the commodity is low relative to the demand.  This is typically an indicator of high prices.  When the S/U ratios are high, the supply of the commodity is high relative to the demand.  Prices in these cases would be expected to be much lower.

    The marketing year average price, as determined by the National Agricultural Statistics Service (NASS), is the weighted average of monthly prices of commodities surveyed during the marketing year, whereas the S/U ratio is computed as the ratio of ending stocks to total demand during the marketing year. The marketing year varies for different commodities. Corn and soybeans have marketing years from September 1 to August 31.  Peanuts has a marketing year of August 1 to July 31. 

    We look at the relationship between S/U ratios and prices for corn and soybeans in figures 1 and 2.  During the period of 2003-2021, we clearly observe the expected downward sloping relationship for corn and soybeans.  As the supply increases, relative to the demand, the price of the commodity is lower.  Figure 3 shows the relationship between S/U ratios and the price of peanuts, or more precisely the lack of any relationship between these two indicators.  In other words, there is no relationship between current peanut prices and current measures of supply and demand.

    The negative relationship in the corn and soybean market can be attributed to the size of the crop, significant number of spot market transactions and the existence of a futures market, with the latter two contributing to price discovery in the market.  However, the similarity between corn and soybeans and that of peanuts is that all are grown in the south – yet that is where it ends. The peanut crop is small relative to these larger commodities, with sales largely done through contracts between the growers and a concentrated sheller market. The absence of a futures market is also a factor that limits price discovery and transparency which could account for the lack of responsiveness in prices to current market conditions. So, while S/U ratios are helpful in explaining prices of many commodities, the same is not true for the peanut sector.

    Figure 1. Corn Marketing Year Average Price and Stocks-to-Use Ratios from 2003-2021

    Source: USDA National Agricultural Statistics Service (USDA-NASS) and USDA World Agricultural Supply and Demand Estimates (USDA WASDE) 

    Figure 2. Soybean Marketing Year Average Price and Stocks-to-Use Ratios from 2003-2021

    Source: USDA National Agricultural Statistics Service (USDA-NASS) and USDA World Agricultural Supply and Demand Estimates (USDA WASDE) 

    Figure 3. Peanut Marketing Year Average Price and Stocks-to-Use Ratios from 2003-2021

    Source: USDA National Agricultural Statistics Service (USDA-NASS) and Oil Crops Yearbook (USDA ERS)

    Attah, Festus, and Adam Rabinowitz. “Traditional Stocks-to-Use Ratios are of Little Value in Determining Peanut Prices.Southern Ag Today 3(5.1). January 30, 2023. Permalink

  • Trading Ranges and Volatility for November Soybean and December Corn Futures Prices

    Trading Ranges and Volatility for November Soybean and December Corn Futures Prices

    The 2021 and 2022 corn and soybean harvest futures prices for November and December had increased trading ranges (Figures 1 and 2). November 2022 soybean futures, from November 1, 2021, to contract expiration, had a trading range of $3.81 ($12.02 to $15.81; Figure 1). December 2022 corn futures, from December 1, 2021, to contract expiration, had a trading range of $2.23 ($5.43 to $7.66; Figure 2). Tight U.S. stocks, the Russia-Ukraine conflict, global inflation, supply chain disruptions, and drought in the U.S. and South America have propelled prices higher but have also increased volatility. In 2021 and 2022, the November soybean contract had 45 and 74 trading days, respectively, with a 20-cent up or down move. For the previous five years, the November soybean contract had a total of 64 days with a 20-cent up or down move. Similarly, the 2021 and 2022 December contracts had 49 and 65 trading days, respectively, with moves of 10 cents up or down. The previous five years had a total of 54 trading days with a 10-cent move.

    Figure 1. November Soybean Futures Contract Price from November 1 to Expiration, 2010-2023*

    Data Source: Barchart
    * November 1, 2022, to January 19, 2023
    Data Source: Barchart
    * December 1, 2022, to January 19, 2023

    What will 2023 bring for soybean and corn futures prices and how should this affect producers marketing and risk management decisions? As of January 19, the 2023 average daily closing futures prices for corn and soybean harvest contracts were near the top of the 2010-2022 price range – November soybeans averaged $13.89 and December corn averaged $5.98. As such, it would be reasonable to think that prices have more downside risk than upside potential, but this will be largely determined by weather. Additionally, there remains a tremendous amount of uncertainty in the global economy, geopolitics, and U.S. and global production for the 2023 crop year. It is likely that volatility will continue in corn and soybean futures markets. 

    What should producers do? Protecting against downside risk seems logical given current market conditions. This can be accomplished using numerous marketing tools (futures, contracts, options, etc.). Put options provide an opportunity to establish a futures price floor. There are several strategies that producers can consider – at-the-money put options, out-of-the money put options, or a combination of put and call options to reduce premium expense. Each producer will have different risk tolerances, so there is no one size fits all approach. The key is to evaluate strategies and choose the one that makes the most sense for your individual circumstances. A simple example of an out-of-the money put option strategy (current December corn futures are trading at $6.00) is:

    Buy a $5.50 December Put Option for 27 cents setting a $5.23 futures floor. This removes 87% ($5.23/$6.00) of the futures price risk, while leaving the upside open and the flexibility to set basis at a later date.

    For producers interested in learning more about using futures and options to manage risk in grain and oilseed markets, the CME group has a self-study guide that explains several strategies.  The current uncertainty and volatility in corn and soybean futures markets necessitates downside price protection. Producers should evaluate strategies that can remove price risk for the 2023 crop. 

    References

    Barchart.com. December Corn and November Soybean Historical Daily Closing Prices. Accessed at: https://www.barchart.com/futures/quotes/ZCZ23/historical-download and https://www.barchart.com/futures/quotes/ZSX23/historical-download

    CME Group. 2019. Self-Study Guide to Hedging with Grain and Oilseed Futures and Options Accessed at: https://www.cmegroup.com/trading/agricultural/files/pm255_self-study-guide_hedging_en_2019.pdf

    Author: S. Aaron Smith

    Associate Professor and Extension Economist

    University of Tennessee Institute of Agriculture


    Smith, Aaron. “Trading Ranges and Volatility for November Soybean and December Corn Futures Prices.” Southern Ag Today 3(4.1). January 23, 2023. Permalink