Category: Crop Marketing

  • What is Behind the Recent Cotton Futures Market Plunge?

    What is Behind the Recent Cotton Futures Market Plunge?

    The cotton futures market is on the decline, having experienced a dramatic selloff starting June 17, 2022. As shown in Figure 1, December 2022 Cotton Future prices dropped from the May 17, 2022 high of 134 cents per pound to around 120 cents per pound on June 15, 2022, only to be followed by a plunge to a low of 91.2 cents per pound on June 28, 2022. The selloff has created concerns among cotton producers about this year’s profitability. What was the cause of the recent market plunge? 

    Figure 1. December 2022 Cotton Future Prices for the Past Year

    Source: barchart.com

    Since September of last year, the cotton futures market experienced an inflow of speculative money, which pushed cotton prices to levels that exceed those indicated by supply and demand fundamentals (more information here). The flow of speculative money in and out of cotton markets makes prices unpredictable and volatile. However, with the recent speculative money leaving the cotton market, prices fell sharply, possibly with a temporary correction below the price supported by global cotton supply and demand fundamentals. What caused this sudden withdrawal of money from the cotton market? 

    Cotton and cotton-related products are discretionary items. Thus, cotton prices tend to follow the economy, with cotton prices rising during economic growth and declining during recessions. Many economic indicators point to the direction of a global economic slowdown, with the possibility of a recession in the United States. The S&P 500 index, one of the main indexes for the U.S. stock market, recorded a 20% drop in June from its January closing peak to confirm a bear market. Meanwhile, soaring inflation put extra pressure on consumers. The annual inflation rate in the U.S. accelerated to 8.6% in May of 2022, the highest since December 1981. Embedded in inflation, energy prices rose 34.6% and food costs surged 10.1%. Severe supply disruptions caused by geopolitical tension and Covid-19 reduced global economic productivity, hindered the ability to meet consumer demand, which resulted in an economic slowdown and high inflation rates globally. 

    The soaring inflation, especially for food and energy, reduced consumer confidence and forced the consumer to rebalance their budgets for spending. This could lead to consumers reducing the purchase of apparel and apparel-related products. Meanwhile, in response to high inflation, the Federal Reserve increased the federal funds rate to tamp down inflation – on June 15th the Federal Reserve increased interest rates by three-quarters of a percentage point, its largest rate increase since 1994 and the third rate increase in 2022. The Federal Reserve’s commitment to bringing inflation back down to its target of 2% indicates a strong possibility of further interest rate hikes in 2022 and 2023. The rising interest rate further accelerated the appreciation of the U.S. dollar, as the U.S. Dollar Index reached its three-year high at 104.01. Cotton is a global commodity; on average, over 80% of cotton produced in the U.S. is exported. The appreciation of the U.S. dollar increases prices paid by foreign consumers and makes U.S. cotton less attractive. All of these concerns contributed to the withdrawal of money from the cotton market and the recent decline in cotton prices from the peak. 

    The impact of this year’s global cotton production on prices is yet to be seen. High cotton prices during the planting season attracted more cotton planted acres globally. However, the Southwest United States, the major cotton-producing region in the U.S., is experiencing severe drought and is anticipating lower production this year. Globally, the USDA June forecast for cotton production could reach 121.3 million bales, 4 million bales larger than last year. The projected USDA global ending stocks are maintained at a relatively low level at 82.7 million bales. Lower cotton production in the U.S. could provide some support for harvesting prices domestically. However, with a higher global cotton production forecast, global cotton prices could drop further if the global economy enters a recession and stock markets continue to experience losses for the remainder of this year. 

    Producers who are not in a marketing pool are encouraged to develop a marketing plan to protect the harvest price, as it is risky to lock in high input prices without a marketing plan for the crop. In addition, producers can adjust their harvest price expectations and manage their in-season production decisions accordingly.

    Liu, Yangxuan. “What Is Behind the Recent Cotton Futures Market Plunge?”. Southern Ag Today 2(29.1). July 11, 2022. Permalink

  • Wheat Production of Major Exporters in the Southern Hemisphere

    Wheat Production of Major Exporters in the Southern Hemisphere

    In the latest WASDE report, USDA projected lower world wheat production than last season. This lower projection was primarily a result of lower expected wheat production in Ukraine, although partially offset by higher spring wheat production in Canada. 

    The southern hemisphere represents 6-10% of annual global wheat production, 45-72 MMT over the past 10-years (USDA-PSD). The two dominant producers in the southern hemisphere are Australia and Argentina, contributing 75-82% of total southern hemisphere production. An increase in winter wheat acreage for the two main exporters from the southern hemisphere, Argentina and Australia, would have been expected given soaring prices. On the contrary, USDA projects lower wheat production for the upcoming 2022-23 season in Argentina and Australia (Graph 1) which are both coming from record high production levels in their previous seasons. The effect of La Niña and high production costs have reduced 2022-23 wheat projections, compared to last year’s records. 

    The lack of moisture in the soil has decreased planting progress in much of the Pampas region of Argentina. Total acreage projections have also decreased below USDA estimates (20 MT) during the last month (Rosario Stock Exchange). High production costs, high breakeven prices, high breakeven yields, and uncertainty in government policies discourage wheat planting in areas with a lack of moisture and higher production risk. According to the Rosario Stock Exchange, 2022-23 winter wheat planting projections decreased to 15.32 million acres (10% less than last season). Wheat estimated production in Argentina could reach 18.5 MT if assuming an average yield of 46 bu/acre. 

    The Australian Bureau of Agricultural and Resource Economics and Sciences (ABARES) projects winter wheat production below last year in Australia. Weather conditions were reported favorable for wheat planting in most of the country. ABARES production projections are similar to the USDA’s (30 MT) and 16.5% lower than last season. High fertilizer prices have decreased yield projections for the next campaign, especially considering last season’s record high production of 36 MT. 

    High costs and non-favorable weather have primarily offset the influence of high prices to increase wheat production in the southern hemisphere this season, reduce the chances of increasing worldwide ending stocks, and support prices in the short term.

    Abello , Francisco Pancho . “Wheat Production of Major Exporters in the Southern Hemisphere“. Southern Ag Today 2(28.1). July 4, 2022. Permalink

  • Some Quirky Aspects of Cotton Marketing

    Some Quirky Aspects of Cotton Marketing

    This article highlights some differences between U.S. cotton and other ag commodity markets. The subject really involves the nexus of politics and economics.  There is a long history of government regulation of commodity markets. A textbook example is the Onion Futures Act of 1958 which banned trading of onion futures (and which was the basis for subsequent studies of efficient markets by Working[i] and Gray[ii]).  

    Our cotton example begins in 1929 when the U.S. Congress singled out cotton in a notable policy restriction.  It seems that two years earlier, one of USDA’s routine monthly forecasts had projected lower cotton prices.  When this forecast proved accurate, some in the cotton industry assumed that the forecast caused the price decline. This led to a political reaction where the USDA was banned from forecasting (only) cotton prices, a policy that remained in place until the 2008 Farm Bill.  

    Cotton was unique in dropping out of Title 1 commodity programs in the 2014 Farm Bill, only to come back in 2018 with “seed cotton” as a new, covered commodity in the Bipartisan Budget Act of 2018.  Space does not allow an adequate discussion of the underlying events of that story.

    A unique reporting requirement of U.S. cotton since the 1950s is the CFTC Cotton On-Call report (https://www.cftc.gov/MarketReports/CottonOnCall/index.htm ).  This is a weekly report of merchant on-call (i.e., basis contract) transactions reflecting purchases from farmers and sales to textile mills that are unfixed with ICE futures, presented by delivery month.  These data are potentially informative in identifying large, hedged positions in ICE cotton futures (see the peaks of the red line in Figure 1).  This market transparency could benefit suppliers and smaller merchandisers and market analysts, but in some cases it could lead to speculative trading on anticipated short covering prior to futures contract expiration (https://southernagtoday.org/2021/12/current-squeeze-dynamics-in-ice-cotton-futures/ ).  

    Why have these different policies existed for cotton? One reason is the historical dominance of southern politicians during the 20th century.  Thus, if the cotton grower segment was angry at USDA, even mistakenly, they had the political power to have something done about it for a southern crop like cotton.  The global aspect of cotton is another feature that brought about the trade talk attention, the Doha Round, and the WTO case, which precipitated cotton leaving and returning to federal farm programs. Finally, some cotton-specific regulations may have to do with the concentration of the cotton merchandising sector, relative to grains.  Compared to grains, the U.S. cotton market is dominated by a handful of global merchandising firms.  The cotton on-call reporting requirement originated as a way for the cotton merchant sector to report their futures transactions as legitimate hedges, which they are. Curiously, it is the cotton merchant sector that now opposes the collection and publication of the cotton on-call data, which they consider proprietary (https://acsa-cotton.org/wp-content/uploads/2020/05/ACSA-Position-Limits-Comment-Letter.pdf).  The merchant sector also has had an ongoing concern since 2008 with excess speculation in ICE cotton futures.  This may explain their opposition to publication of cotton on-call data.  


    [i] Working, Holbrook (1960-02). “Price Effects of Futures Trading.” Reprinted from Food Research Institute Studies, Vol. 1, No. 1, February 1960, in Selected Writings of Holbrook Working, Anne E. Peck, ed., Chicago Board of Trade, 1977. pp. 45–71.

    [ii] Gray, Roger.  1963. “Onion Revisited.” Journal of Farm Economics,. Vol. 45, No. 2, May 1963.

    Robinson, John. “Some Quirky Aspects of Cotton Marketing“. Southern Ag Today 2(27.1). June 27, 2022. Permalink

  • Shelled Peanut Product Disappearance Increasing

    Shelled Peanut Product Disappearance Increasing

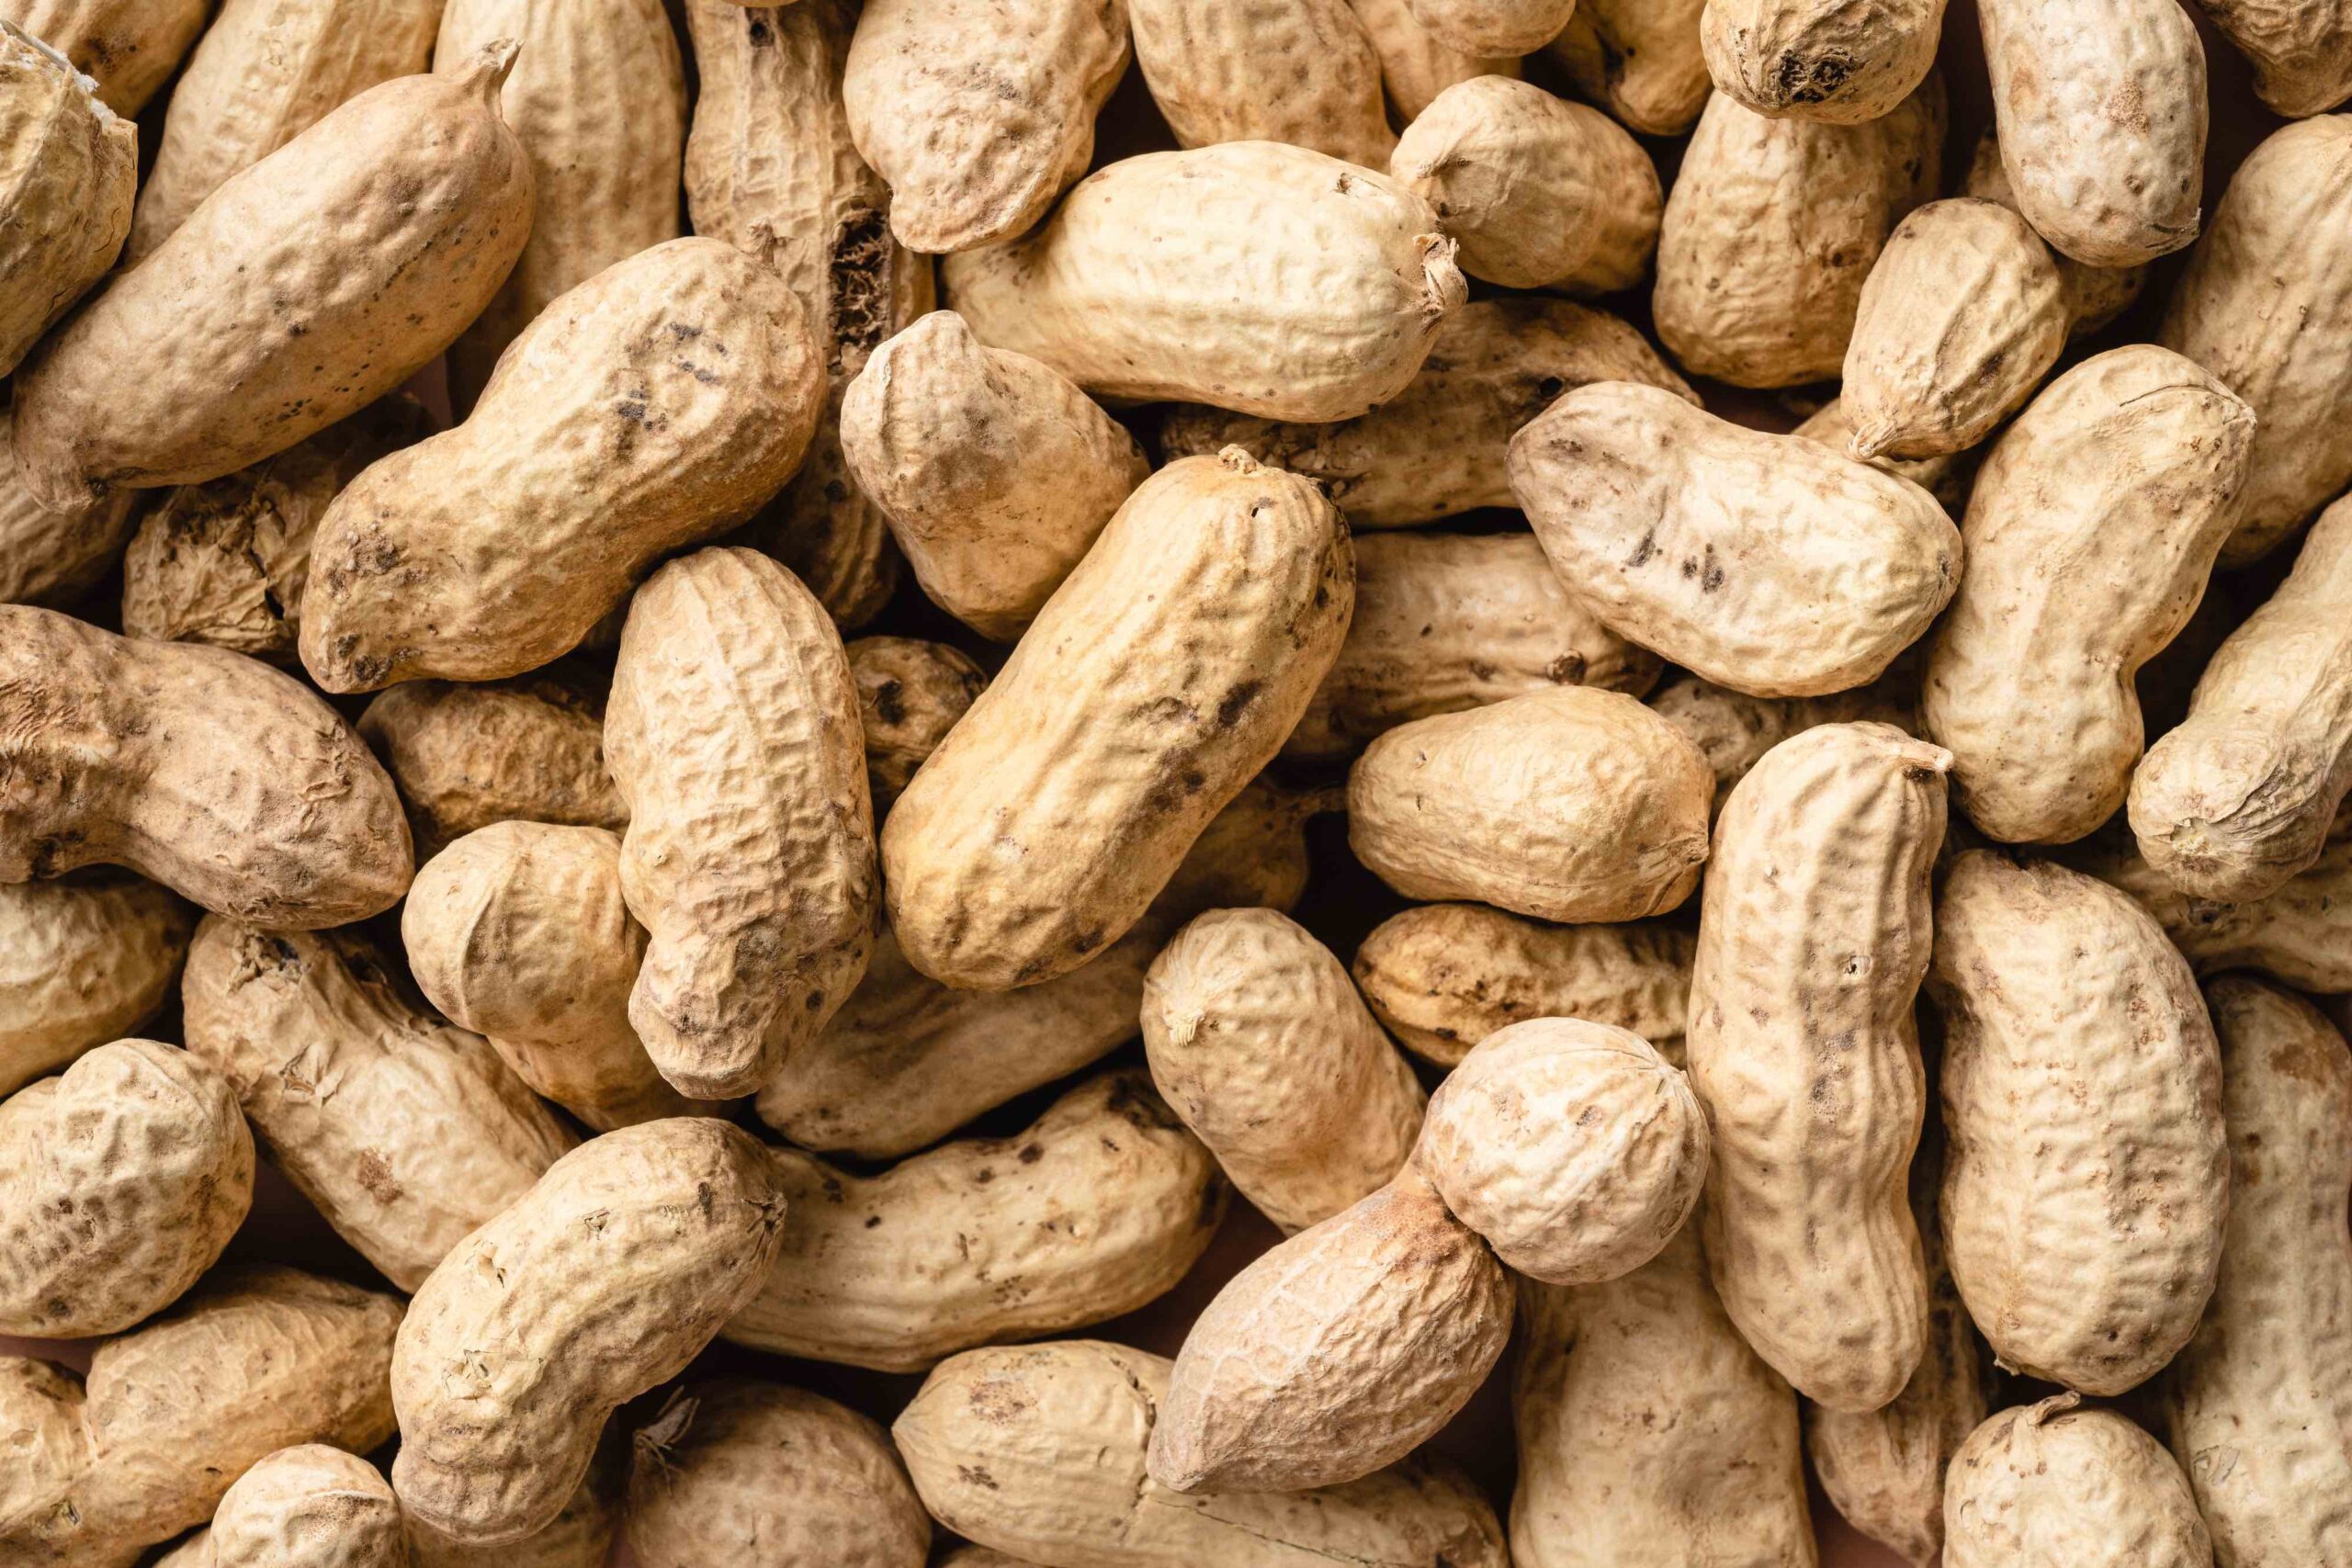
    Consumption of shelled peanut products has been strong through the third quarter of the 2021/2022 peanut marketing year (which began in August 2021). Ninety percent of peanuts produced in the U.S. are sent to shelling processors and end up being manufactured into food products or crushed for oil. Thus far, disappearance of the old crop is outpacing levels from previous marketing years. As shown in Figure 1, peanuts crushed for oil are at 218 million pounds this marketing year (through April), outpacing the same timeframe during the 2020/2021 marketing year by 5.8%. This marks a third consecutive year of increased peanut crude oil disappearance. Other U.S. oilseed crops such as soybeans have seen record oil crushings this year. This is likely an effort to offset disruptions to vegetable oil markets caused by the Russian invasion of Ukraine, which has led to reduced sunflower production by Ukraine, the world’s leading sunflower producer and sunflower-oil exporter. 

    Blue-Food Products / Green-Crude Oil
    Data source: USDA-NASS. Peanut Stocks and Processing. May 25, 2022. Available at: https://downloads.usda.library.cornell.edu/usda-esmis/files/02870v87z/z603s454w/m900pz82z/pnst0522.pdf
    Note: Peanut marketing year begins August 1st

    Similarly, disappearance of peanut food products has increased by 14.8% to start the marketing year compared to the same period last year, at 2.4 billion pounds. This follows relatively small changes each of the previous three years. The higher disappearance on the food side has been primarily driven by increases in peanut food used for candy production, which is up 15.4% compared to last year. Usage for peanut butter and peanut snacks are down 1.5% and 5.8%, respectively, from last year, continuing the trend observed over the first quarter of this marketing year.

    As we inch closer to the 2022 peanut harvest, it is unlikely that the increased peanut usage this marketing year will have a significant change on peanut stocks. This is because the 2021 harvest saw a 4% increase in peanut production, enough to meet this year’s high disappearance. Peanut production might also fall this year due to the lower projected planted acres, but the upcoming publication of the USDA Acreage report will provide more information at the end of the month.

    Sources:

    USDA National Agricultural Statistics Service. 2022. “Fats and Oils: Oilseed Crushings, Production, Consumption and Stocks.” June 1, 2022. Available at: https://www.nass.usda.gov/Publications/Todays_Reports/reports/cafo0622.pdf

    USDA National Agricultural Statistics Service. 2022. “Peanut Stocks and Processing.” May 25, 2022. Available at: https://downloads.usda.library.cornell.edu/usda-esmis/files/02870v87z/z603s454w/m900pz82z/pnst0522.pdf

    Sawadgo, Wendiam. “Shelled Peanut Product Disappearance Increasing“. Southern Ag Today 2(26.1). June 20, 2022. Permalink

  • World Per Capita Grain Consumption and Global Economic Growth

    World Per Capita Grain Consumption and Global Economic Growth

    Since the early 2000’s, global economic growth has been driven by emerging market and developing economies (Figure 1). Since 2000, the average annual increase in Gross Domestic Product (GDP) from this group of nations has been five percent, compared to just under two percent for advanced economies.  The “altered economic landscape” of the 21st century that drove this growth includes technical change (the internet, and access to it), lower transportation and communication costs, reductions in tariff rates and other barriers to trade, in general, lower costs of international trade.  This transformation reduced poverty and improved living standards across much of the globe (Krueger, 2006).  

    Figure 1. Global Economic Growth, Annual Percentage Change, GDP, 1980-2022, 2023-2027 projected

    Average incomes in the largest economies within the category of ‘Emerging market and developing economies’—Brazil, Russia, India, China, Mexico, Indonesia, Vietnam, Philippines, Thailand, Malaysia, a group that accounts for half of the world’s population—started to rise rapidly in 2003 (Figure 2) (IMF, 2022).  Measured in current $US, the average income in these ten countries (weighted by population) from 1980 to 2002 increased from $433 to $1,232, about $35 per year.  Incomes grew from $1,356 in 2003 to $6,319 in 2020, about $275 per year.  

    Figure 2. Emerging Economies Gross National Income Per Capita and World Per Capita Grain Use

    World Bank. DataBank. Accessed June 8, 2022 and available online at https://databank.worldbank.org/home.aspx.

    This economic activity has had a direct impact on grain markets. While world grain consumption (barley, corn, millet, mixed grains, oats, rice, rye, sorghum, and wheat) increased steadily from 1980 to 2002, per capita grain consumption was flat to trending lower from 1980 to 2002.  Beginning in the 2003/2004 marketing year, per capita consumption began to increase along with incomes in emerging economies, from 312 kg per person to 364 kg per person in 2021/22, an increase of 17 percent. As incomes grew in emerging economies, so did the demand for grain—for food, feed, and fuel—in the subsequent marketing years. For comparison, per capita grain use in the rest of the world (all countries other than emerging economies) increased seven percent from 2003/04 to 2021/22. Measuring consumption on a per capita basis accounts for overall population growth experienced in these emerging economies over this time span. 

    Since 2003, there have been five marketing years in which a decline in production has been associated with a drop in per capita use: 2006/2007, 2012/2013, 2015/2016, 2017/2018, and projections for the new marketing year, 2022/2023 (Table 1).  In 2012/13 and 2015/16, the setback in grain use was short lived, in that after a one-year decrease, consumption increased to a new, higher level in the year following.  That increase in use coincided with increased production and a continued rise in average incomes.   

    Table 1. World Grain Production* and Per Capita Grain Use

    Marketing YearWorld Grain ProductionmmtProduction Change mmtPer Capita Grain UseKg/personUse Change
    2003/20041,86643 312 1.97 
    2004/20052,044178 315 3.43 
    2005/20062,017(27)317 2.02 
    2006/20072,005(12)316 (0.71)
    2007/20082,132127 322 5.46 
    2008/20092,252120 327 5.48 
    2009/20102,253330 2.78 
    2010/20112,213(40)330 0.15 
    2011/20122,344130 339 9.02 
    2012/20132,296(48)329 (10.71)
    2013/20142,512217 343 14.41 
    2014/20152,56048 346 3.25 
    2015/20162,518(42)341 (4.80)
    2016/20172,668150 358 16.39 
    2017/20182,619(49)354 (4.25)
    2018/20192,63213 355 1.98 
    2019/20202,68048 356 0.44 
    2020/20212,72444 361 5.03 
    2021/20222,79469 364 3.06 
    2022/2023p2,765(28)360 (4.32)
    *Barley, corn, millet, mixed grain, oats, rice, rye, sorghum, and wheat
    Source: USDA, FAS PSD

    Due to mostly geopolitical events, the 2022/2023 marketing year for grains is shaping up as a short crop year.  Inflation, rising interest rates, and lingering pandemic impacts are among the factors limiting economic growth prospects in the near term. Among the factors that will determine whether we extend the recent trend in world per capita grain use are future crop production levels and global economic conditions.  The combination of a short-crop and a slowdown in income growth can impact per capita grain use beyond the current marketing year.  

    References:

    Krueger, Anne O. “The World Economy at the Start of the 21st Century”, International Monetary Fund, Annual Gilbert Lecture, Rochester University, New York, April 6, 2006. Accessed May 31, 2022 and available online at https://www.imf.org/en/News/Articles/2015/09/28/04/53/sp040606.

    International Monetary Fund (IMF). IMF Datamapper. Accessed May 31, 2022 and available online at https://www.imf.org/external/datamapper/NGDP_RPCH@WEO/OEMDC/ADVEC/WEOWORLD.

    USDA, Foreign Agricultural Service. Production, Supply and Distribution (PSD). Accessed June 8, 2022 and available online at https://apps.fas.usda.gov/psdonline/app/index.html#/app/home.

    World Bank. DataBank. Accessed June 8, 2022 and available online at https://databank.worldbank.org/home.aspx.

    Welch, J. Mark. “World Per Capita Grain Consumption and Global Economic Growth“. Southern Ag Today 2(25.1). June 13, 2022. Permalink