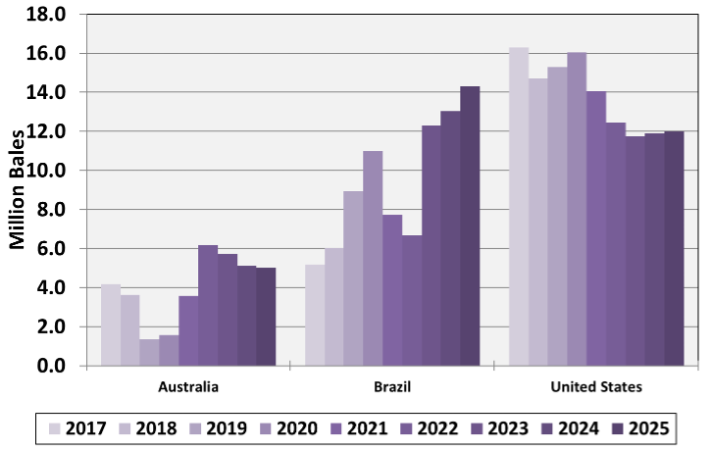
Category: Crop Marketing

  • Sugarbeet and Sugarcane Production and Farm Trends 

    Sugarbeet and Sugarcane Production and Farm Trends 

    Like many other agricultural sectors, there has been consolidation in United States (US) farm-level sugar production. Sugar is a unique commodity because about 56 percent of the domestic production of sugar originates from sugarbeets and 44 percent originates from sugarcane. The US domestic production of sugar has increased from 8.02 million short tons raw value (STRV) in 1997 to 9.31 million STRV in 2024, an increase of 16% (USDA ERS, 2025a). However, there are now 50 percent fewer sugarbeet and sugarcane farms in the country. 

    In 1997, the USDA Census of Agriculture recorded a total of 8,136 sugarbeet and sugarcane producing farms (USDA NASS, 2025). However, by 2022 that number had declined to 4,002, a decrease of over 50 percent. Figure 1 shows sugarbeet and sugarcane production from 1997 through 2024 and the number of sugarbeet and sugarcane farms recorded by the US Census of Agriculture every five years, beginning in 1997. 

    Figure 1. Sugarbeet and Sugarcane Production and Farms. 

    Source: USDA ERS (2025a) and USDA NASS (2025).

    Sugarbeets

    From 1997 through 2022, while there was a decrease in sugarbeet farms and sugarbeet harvested acres, there was an increase in the amount of sugar produced from sugarbeets. The number of sugarbeet farms fell by 54 percent, from 7,057 farms in 1997 to only 3,257 in 2022 (Figure 1). Sugarbeet acres also fell by 20 percent from 1.43 million acres in 1997 to 1.14 million acres in 2022 (USDA ERS, 2025a). However, there was an 18% increase in sugar produced from sugarbeets during this time, with 4.39 million STRV of sugar produced from sugarbeets in 1997 and 5.19 million STRV of sugar produced from sugarbeets in 2022 (Figure 1). 

    These trends indicate that in 1997, the average sugarbeet farm size was 203 acres contributing to final sugar production of 622 STRV (3.06 STRV of sugar per acre). Meanwhile in 2022, the average sugarbeet farm size was 350 acres contributing to final sugar production of 1,593 STRV (4.55 STRV of sugar per acre). Thus, sugarbeet farms have become not only larger (350 acres per farm versus 203 acres per farm), but they have also become 49 percent more efficient! One reason for this increased efficiency is that all sugarbeets grown in the US have been genetically modified since 2009 (Kennedy, Schmitz and Lewis, 2020).

    Sugarbeets are currently grown in four regions and 11 states: the Great Lakes (Michigan), the Upper Midwest (Minnesota, South Dakota, and North Dakota), the Great Plains (Colorado, Montana, Nebraska, Wyoming), and the Far West (Idaho, Oregon, Washington).[1] Sugarbeets are grown in rotation with other crops. Historically, sugarbeet yields in the Far West have been highest. Western sugarbeet production typically utilizes irrigation, which is in contrast to the eastern regions of sugarbeet production that do not use irrigation (USDA ERS, 2025a, b). The largest region for sugarbeet production is the Upper Midwest (Minnesota and North Dakota) (USDA ERS, 2025a). The Upper Midwest represented 42 percent of sugarbeet total production in 1997 and represented 53 percent of sugarbeet total production in 2022 (USDA ERS, 2025a). 

    Each sugarbeet producing region has experienced both consolidation and increased efficiency over the years. For example, the number of sugarbeet farms in Michigan was 1,164 in 1997 (USDA NASS, 2025). That number decreased 43 percent by 2022 to only 663. However, the number of tons of sugarbeets harvested in 1997 was only 3.0 million, and by 2022 the state harvested 4.1 million tons of sugarbeets. 

    Sugarcane

    Sugarcane has also experienced consolidation over the period of 1997 through 2022, where the number of sugarcane farms fell by approximately 31 percent from 1,079 in 1997 to 745 in 2022 without experiencing declines in sugar production or acres engaged in sugarcane production. Sugarcane acres actually increased by 3 percent in 2022 (913,738 acres) relative to 1997 (890,193 acres) (USDA NASS, 2025). Production of sugarcane (for sugar) also increased by approximately 11 percent to 4.06 million STRV in 2022 relative to 1997 (3.63 million STRV) (Figure 1). 

    These trends indicate that in 1997, the average size of a sugarcane farm was 825 acres and contributed to final sugar production of 3,365 STRV (4.08 STRV of sugar per acre). By 2022, the average sugarcane farm size was 1,226 acres and contributed to final sugar production of 5,454 STRV (4.45 STRV of sugar per acre). Thus, the sugarcane sector has seen improvements in production efficiency of approximately 9 percent over the observed period (1997-2022). 

    As recently as 2016, sugarcane was produced in four states (Florida, Louisiana, Hawaii, and Texas). Sugarcane production in Hawaii and Texas ceased in 2016 and 2023, respectively. In Hawaii, rising labor and land cost were contributing factors in the closure of Hawaiian Commercial & Sugar Company (HC&S) in Maui. Production in Texas ceased due to water shortages exacerbated by Mexico’s consistent failure to fulfill its treaty obligations to share irrigation water from the Rio Grande. The lack of sugarcane production due to uncertain water availability resulted in the closure of the only sugar mill in the state, Rio Grande Valley Sugar Growers, Inc. Since 2017, overall sugarcane production has increased in the remaining sugarcane producing states of Louisiana and Florida, despite closure of the sugarcane industries in Hawaii and Texas. In Florida, the number of farms has actually increased from 152 to 240, with the average farm size contracting from 2,772 to 1,656 acres. However, in Louisiana, farms have decreased from 705 to 420 farms. The average size of a Louisiana farm has increased from 561 to 1,158 acres. 

    In Florida, sugarcane is mainly produced in organic soils along the southern and southeastern shore of Lake Okeechobee in southern Florida. The decrease in Florida’s sugarcane acreage leading to 2007 reflected conversion of cropland to public water storage in response to the Comprehensive Everglades Restoration Plan and reallocation of cropland for sod production in the early 2000’s (VanWeelden et. al., 2023). Sugarcane cultivation on sandy soil is expanding as the expense of citrus cultivation has increased due to citrus greening disease (Sandhu et. al., 2024). 

    Sugarcane acreage across Louisiana has been expanding for the past decade, primarily because of the reduced volatility in sugar prices relative to other crops such as corn, rice, and soybeans. (Gautreaux, 2025). Louisiana sugarcane production has also expanded with the development and adoption of high-yielding sugarcane varieties and with the evolution of custom harvesting groups that induce nontraditional producers into sugarcane cultivation by alleviating concerns for those producers regarding increased capitalization costs of purchasing and maintaining specialized sugarcane harvest equipment.

    [1] California is producing sugarbeets in 2025, but the processing facility will close following this crop season (https://www.smbsc.com/ourstory-2/SMBSCMediaReleaseReSpreckelsSugarCompany2025.04.22.pdf).

    References

    Gautreaux, K. (2025). “Sugarcane expansion moving northward and westward but also increasing in traditional areas.” Louisiana State University AgCenter. https://www.lsuagcenter.com/articles/page1738854832844 . 

    Kennedy, P. L., A. Schmitz, and K.L. DeLong. (2020). Biotechnology and demand concerns: the case of genetically modified US sugar beets. AgBioForum, 22(1), 49-60.

    Sandhu, H., M. VanWeelden, A. Sharma, and W. Davidson. (2024). CP 03-1912: A Sugarcane Cultivar Expanding on Sand Soil in Florida, University of Florida, IFAS Extension. https://edis.ifas.ufl.edu/publication/SC111 .  

    United States Department of Agriculture (USDA), Economic Research Service (ERS). (2025a). Sugar and Sweeteners Yearbook Tables. Group 3 Tables. Retrieved from: https://www.ers.usda.gov/data-products/sugar-and-sweeteners-yearbook-tables

    United States Department of Agriculture (USDA), Economic Research Service (ERS). (2025b). Sugar and Sweeteners-Background. Retrieved from: https://www.ers.usda.gov/topics/crops/sugar-and-sweeteners/background#:~:text=Sugarbeet%20production%20in%20the%20Far,is%20typically%20on%20irrigated%20land

    United States Department of Agriculture (USDA), National Agricultural Statistics Service (NASS). (2025). U.S. Census of Agriculture, Volume 1, Chapter 1: U.S. National Level Data. Retrieved from:  https://www.nass.usda.gov/Publications/AgCensus/2022/index.php . 

    VanWeelden, M., C. Kammerer, W. Davidson, M. Baltazar, and R. Rice. (2023). Sugarcane Variety Census: Florida 2022, Sugar Journal 86 (2), July 2023.


    Headline Photo By: Young Stock photos by Vecteezy


    Delberto, Michael, Brian Hilbun, and Karen L. DeLong. “Sugarbeet and Sugarcane Production and Farm Trends.” Southern Ag Today 5(26.3). June 25, 2025. Permalink

  • June WASDE Delivers Sharp Reduction in U.S. Rice and Cotton Crops

    June WASDE Delivers Sharp Reduction in U.S. Rice and Cotton Crops

    The USDA’s June Supply and Demand report (WASDE) is generally characterized as a “quiet” report with few, if any, changes from the previous month.  That held true for the U.S. corn and soybean outlook.  The only adjustments USDA made to the 2025/26 corn balance sheet included a 50-million-bushel reduction in beginning stocks.  This reflected an increase in exports for 2024/25. With no demand changes for 2025/26, ending stocks were lowered 50 million bushels to 1.75 billion. The season-average farm price received by producers was unchanged at $4.20 per bushel. There were no changes this month to the U.S. 2025/26 soybean outlook, with new crop ending stocks remaining at 295 million bushels. The U.S. season-average soybean price is forecast at $10.25 per bushel.  On the World balance sheet, Brazil’s production estimate was unchanged at 169 million metric tons and Argentina’s was also unchanged at 49 million metric tons.

    One of the big surprises in the June WASDE was the aggressive cut to 2025 long-grain rice production.  Not waiting for the June Acreage survey, USDA made note of “the excessive spring precipitation in the Delta” and anticipated this would result in lower rice acreage in the region compared to the March Prospective Plantings. On the long-grain balance sheet, production was lowered by a sizeable 7.5 million cwt. (-4.5%) this month to 159.7 million cwt (see Table 1).  Partially offsetting the sharp production cut was a 1 million cwt. increase in imports and a 3 million cwt. reduction in domestic and residual use.  The net result was a 3.5 million cwt reduction in 2025/26 ending stocks to 34 million. This is slightly below the 35.3 million ending stocks of 2024/25.  The projected 2025/26 long-grain season-average farm price was increased by $0.50 per cwt to $12.50 or $5.63 per bushel.

    In another surprise move, USDA wasted no time lowering their expectations for the 2025/26 U.S. cotton crop.  Pointing to the excessive rain and planting delays in the Delta, harvested acreage was lowered 2 percent this month to 8.19 million acres (see Table 2). The national average yield for 2025/26 was reduced more than 1 percent from last month to 820 pounds per acre, also because of the conditions in the Delta. As a result, the production forecast was reduced 500,000 bales to 14.0 million, below the 14.4 million bales produced in 2024/25 and the second smallest crop in the past decade. Beginning stocks for 2025/26 were reduced 400,000 bales following a corresponding increase in projected exports for 2024/25. The net result being a 900,000 bale reduction in 2025/26 ending stocks to 4.3 million bales, very close to the 4.4 million bale 2024/25 carry-over. The projected season-average price for 2025/26 was unchanged this month at 62 cents per pound.

    As a reminder, USDA will release its Acreage report on June 30. It will provide survey-based indications of planted and harvested area.  The acreage findings of the survey will be used in the July 11th WASDE. A link to the June 2025 WASDE report may be found here.

    Table 1. U.S. Long-Grain Rice Supply and Demand
    2025/26Monthly Change 
    unit: million cwt.2024/25MayJune
    Beginning Stocks19.335.335.30.0 
    Production172167.2159.7(7.5)
    Imports4243.044.01.0 
    Total Supply233.3245.5239.0(6.5)
    Domestic Use133140.0137.0(3.0)
    Exports6568.068.00.0 
    Total Use198208.0205.0(3.0)
    Carry-Over35.337.534.0(3.5)
    stocks-use %17.8%18.0%16.6%
    Avg. Producer Price ($/cwt.)$     14.20$           12.00$       12.50$     0.50
    Avg. Producer Price ($/bu.)$       6.39$              5.40$          5.63$     0.23
    PLC Reference Price ($/bu.)$       6.30$              6.30$          6.30$          –
    Proj. PLC Payment Rate ($/bu.)$             –$              0.90$          0.68$ (0.23)
    Source: USDA World Agricultural Supply and Demand Estimates, June 2025
    Table 2. U.S. Cotton Supply and Demand
    2025/26Monthly Change
    unit: million 480# bales2024/25MayJune
    Beginning Stocks3.154.804.40(0.400)
    Production14.4114.5014.00(0.500)
    Imports0.010.010.010.000 
    Total Supply17.5719.3118.41(0.900)
    Mill Use1.701.701.700.000 
    Exports11.5012.5012.500.000 
    Total Use13.2014.2014.200.000 
    Carry-Over4.405.204.30(0.900)
    stocks-use %33.3%36.6%30.3%
    Avg. Producer Price ($/lb.) $     0.63  $                  0.62  $          0.62 $   0.000 
    Avg. Seed Cotton Price ($/lb.) $0.3401  $            0.3299  $    0.3279 $ (0.002)
    PLC Reference Price ($/lb.) $0.3670  $            0.3670  $    0.3670 $   0.000 
    Proj. PLC Payment Rate ($/lb.) $0.0269  $             0.0371  $    0.0391 $   0.002 
    Source: USDA World Agricultural Supply and Demand Estimates, June 2025

    Stiles, Scott, and Hunter Biram. “June WASDE Delivers Sharp Reduction in U.S. Rice and Cotton Crops.” Southern Ag Today 5(25.3). June 18, 2025. Permalink

  • How can crop marketing and crop insurance go together?

    How can crop marketing and crop insurance go together?

    Agriculture is inherently risky, with producers facing a complex array of production, market, and financial risks. These risks can significantly impact farm profitability, necessitating robust risk management strategies. Risk management in agriculture has become a complex system of financial instruments and strategies, with crop insurance and forward contracting serving as two key components.

    Forward contracting allows producers to mitigate price risk by securing a predetermined price and buyer for their grain. This approach can be especially attractive due to the potential weather risk premium embedded in forward contract grain prices. Buyers are often willing to pay higher prices to hedge against weather-related uncertainties affecting crop production, which allows farmers to lock in favorable prices and potentially increase their revenue. However, it’s crucial to note that while forward contracting addresses market risk, it does not directly mitigate production risk. Aggressive use of forward contracting can expose farmers to unexpected yield risk as farmers may be unable to meet contracted quantities, leading to non-delivery penalties imposed by elevators and potentially substantial financial losses.

    Farmers can also purchase crop insurance as a complementary risk management tool to address the production risk associated with forward contracting. The federal crop insurance program offers various products, with yield (YP) and revenue protection (RP) accounting for 71% of the $158.6 billion of liability in 2024 (USDA-RMA, 2024). YP provides production risk management using a farm-specific Actual Production History (APH), while RP additionally provides price risk management using futures prices. Pairing forward contracting with either insurance product could potentially help offset non-delivery penalties and reduce the financial burden on farmers who experience yield shortfalls. The combination of forward contracting and insurance protection allows farmers to confidently engage in more aggressive marketing strategies. By protecting against both price and yield risks with RP and yield risk with YP, this integrated approach could potentially lead to a more stable farm income and improved overall risk management.

    We provide a visual example of how these two risk management tools can work together in Figure 1 below. The red bar is the potential revenue generated from corn production by locking in a price of $4.50/bushel via a forward contract at a farm yield expectation of 200 bushels/acre. If a farmer booked 80% of expected production, the expected revenue from forward contracting would be $720.00/acre. The blue bar behind the red bar shows an RP crop insurance policy at 80% coverage that is layered underneath the expected revenue from forward contracting which guarantees $744.00/acre.

    Figure 1. Layers of Protection Provided by Simultaneously Using Revenue Protection (RP) Crop Insurance and Forward Contracting in the Local Cash Market 

    NOTE: The purpose of this figure is to show two different “layers” of revenue coming from two different revenue risk management tools: forward contracting and RP crop insurance. The forward contracted revenue is in red while the crop insurance revenue guarantee is in blue behind the forward contracted revenue.

    To illustrate the importance of this “layering” strategy, consider when a yield shortfall occurs leaving only 150 bushels/acre to sell at the forward price of $4.50/bushel rather than the 160 bushels/acre promised for delivery. This leaves a 10 bushel/acre shortfall. The local grain elevator is offering a cash delivery price of $4.00/bushel with a $0.05/bushel non-delivery penalty resulting in a non-delivery price of $4.05/bushel, and therefore, a total penalty of $40.50/acre. The resulting harvest revenue is about $635.00/acre (see table 1). Despite the penalty, the RP policy – which is in blue underneath the forward priced grain – provides an indemnity of $121.00/acre at a producer-paid premium of $56.00/acre. This results in a final cash revenue of about $700.00/acre rather than $635.00/acre, showing how the RP policy was able to pull crop revenue almost completely back to the expected amount of $720.00/acre despite the inability to fully deliver the promised amount (see table 2). This finding highlights the benefit of locking in prices during spring time as part of a pre-harvest marketing plan.

    Table 1. Calculating Crop Revenue Using a Forward Price and Non-Delivery Penalty

    Expected Yield (a) 200 bpa
    Booked Yield (b = 80% x  a)160 bpa
    Realized Yield (c)150 bpa
    Yield Shortfall (d = b – c)10 bpa
      
    Forward Price (e)$4.50/bushel
    Harvest Price (f)$4.00/bushel
    Non-Delivery Fee (g)$0.05/bushel
    Non-Delivery Price (h = f + g)$4.05/bushel
      
    Forward -Priced Revenue (i= c x e)$675.00/acre
    Non-Delivery Penalty (w = d x h)$40.50/acre
    Revenue with Penalty (i– w)$634.50/acre
    Note: bpa = bushels per acre

    Table 2. Including Crop Insurance in the Crop Revenue Using a Forward Price and Non-Delivery Penalty

    Revenue with Penalty (a)$634.50/acre
    Crop Insurance Indemnity (b)$121.00/acre
    Revenue + Indemnity (c = a + b)$755.50/acre
      
    Producer Premium (w/subsidy) (d)$56.00/acre
      
    Revenue + Indemnity – Premium (c – d)$699.50/acre

    Biram, Hunter, Andrew M. McKenzie, and Chanda Bhattrai. “How can crop marketing and crop insurance go together?Southern Ag Today 5(24.3). June 11, 2025. Permalink

  • Seasonal Movements of the Monthly December Corn Futures Price 

    Seasonal Movements of the Monthly December Corn Futures Price 

    Over the past 10 years the monthly average December corn futures contract price has peaked in June and declined through harvest (Figure 1). However, prices react differently each year. This article examines the December corn futures contract monthly average price from 2010 to 2024, for years when national average corn yield is above the predicted trendline (2014, 2015, 2016, 2017, 2018, 2021, and 2024) and below the predicted trendline (2010, 2011, 2012, 2013, 2019, 2020, 2022, and 2023). In years when the national average yield is above the trendline, the monthly average December corn futures price peaks in May and declines to September, before recovering at the end of the year. This trend can also be seen in 2024 (blue bars; Figure 1). In years when the national average yield was lower than trendline, average monthly December futures prices increased from May to October. May and June have historically been the months when December futures prices begin to move higher or lower. This is largely due to three factors: 1) confirmation of planted acreage (USDA June Planted Acreage report); 2) early season weather and crop conditions; and 3) increased accuracy for June-July yield forecasts. 

    Figure 1. Average Monthly December Corn Futures Price, 2024, 2025, 10-Year Average, Below Trendline and Above Trendline National Average Yield 

    Currently, 2025 USDA estimates for national corn acres planted are at 95.3 million acres (March Prospective Plantings report). The USDA will release the Acreage report on June 30th which will provide revised estimates. Due to beneficial planting conditions throughout a large portion of corn producing regions of the U.S. and a corn-to-soybean ratio that favors corn planting, many analysts are anticipating an increase in corn acres compared to current USDA estimates. 

    Weather has also been mostly favorable across the corn belt. On May 27th, the USDA estimated that 5% of corn production was in severe drought or worse, indicating most of the major production areas had average to favorable soil moisture conditions. This can change rapidly and in the recent past many states have experienced flash droughts that have reduced state level yield estimates later in the growing season. The May 31st 30-day NOAA precipitation forecast indicates average to above average precipitation for the corn belt, the Mississippi river portal and the southern seaboard. 

    Farmers concerned with downside futures price risk could consider purchasing a December put option at or out of the money to provide short term price protection. If futures prices move lower the put would provide a futures price floor. If futures prices start to trend higher, the put option could be sold and part of the put option premium recovered. Managing the downside futures price risk at key times in the production year can assist in removing risk and protecting against financial losses.     

    References and Resources:

    Barchart.com. December Corn Futures Price. https://www.barchart.com/futures/quotes/ZCZ25/overview.

    NOAA Climate Prediction Center. 30-Day Forecast. https://www.cpc.ncep.noaa.gov/products/predictions/30day/.

    USDA Ag in Drought. https://www.usda.gov/sites/default/files/documents/AgInDrought.pdf.

    USDA Prospective Planting Report. https://usda.library.cornell.edu/concern/publications/x633f100h.


    Smith, Aaron. “Seasonal Movements of the Monthly December Corn Futures Price.Southern Ag Today 5(23.3). June 4, 2025. Permalink

  • The 2025 Sugar Market Domestic Supply and Outlook 

    The 2025 Sugar Market Domestic Supply and Outlook 

    On May 12, 2025, the USDA released its World Agricultural Supply and Demand Estimates (2025) report which provides the first 2025/26 fiscal year (FY) estimate of United States sugar production. United States domestic sugar production, which consists of sugar extracted from both sugarbeets and sugarcane, is estimated at 9.285 million short tons raw value (STRV) for the 2025/26 FY (USDA WASDE, 2025). Domestic beet sugar production is estimated at 5.180 million STRV, or 56% of total domestic production, and domestic cane sugar production is estimated at 4.105 million STRV, or 44% of total domestic production (Figure 1). 

    Total domestic use of sugar is predicted to be 12.355 million STRV which includes estimated domestic sugar production of 9.285 million STRV, U.S. sugar imports of 2.475 million STRV, and net stocks usage (beginning stocks minus ending stocks) of 0.596 million STRV (USDA WASDE, 2025). Thus, net stocks usage plus domestic sugar production is estimated to account for about 80% of the domestic use of sugar.  

    The estimated FY 2025/26 domestic sugar production (9.285 million STRV) represents a 26,000 STRV reduction from last year’s total domestic production of 9.311 million STRV (Figure 1). The 2025/26 FY has an estimated slight increase in cane sugar production that is offset by a decrease in beet sugar production, ultimately resulting in the slight year-over-year decrease in overall domestic sugar production. 

    Beet sugar production is estimated at 5.180 million STRV, a 154,000 STRV decrease (2.9%) from the year prior. Sugarbeets are produced in the Upper Midwest, Great Lakes, Great Plains, and Far West regions of the country. United States estimated 2025/26 FY sugarbeet planted area (1.104 million acres) is based on the USDA National Agricultural Statistics Service (NASS) (2025) March Prospective Plantings report. The estimated harvested area (1.081 million acres) is derived using a 10-year average of harvested-to-planted ratio. The sugarbeet shrink (6.76%) and recovery rate (14.78%) are both projected based on the 10-year national average.

    Sugarcane is now produced in only two states- Florida and Louisiana. Cane sugar output is forecast at 4.105 million STRV, up 128,000 STRV (3.2%) from the year prior. Louisiana’s output is projected at 2.088 million STRV, reflecting six consecutive years of increase, and four years of surpassing Florida sugar production. Sugarcane acres in Louisiana have been increasing due to the attractiveness of sugar compared to other alternative crops, availability of custom harvest groups, and acreage expansion northward in the central region of the state. Florida’s cane sugar production is projected at 2.017 million STRV (USDA WASDE, 2025). 

    Figure 1. United States sugar production by source, 2016/17 FY through estimated 2025/26 FY.

    Source: USDA WASDE (2025). Notes: Parentheses show cane and beet sugar production as a percentage of total domestic sugar production. 

    Like many other agricultural sectors, the sugar sector has faced challenges. Namely, the tightening of operating margins due to rising costs of production (Deliberto and DeLong, 2024a) and flat or falling prices (Deliberto, DeLong, and Fischer, 2024b). This is most evident in the recent closures of sugar processing facilities in several states. Since 2000, roughly 40% of United States sugar mills, refineries, and sugarbeet factories have closed (i.e., 29 closures with 42 remaining open) (American Sugar Alliance, 2025; Louisiana Sugarcane Industry, 2025; Fischer, Outlaw, Raulston, and Herbst, 2022). 

    Most recently, there have been three notable closures. In 2023, the Sidney Sugar Company in Montana closed due to falling prices for sugarbeets (Western Ag Network, 2023).  Next in 2024, the Rio Grande Valley Sugar Growers, Incorporated ceased operations (Food Business News, 2024). The facility terminated operations due to Mexico’s failure to comply with the provisions of the 1944 Water Treaty between the U.S. and Mexico that governs water sharing between the two nations on the Colorado River and the Lower Rio Grande. Most recently, it was announced that the last remaining sugarbeet processing facility in California will be decommissioned at the end of this season – the Spreckels Sugar Company, Incorporated in Brawley, California (Southern Minnesota Beet Sugar Cooperative, 2025). 

    In recent months, U.S. wholesale prices for beet and cane sugar have been falling (USDA Economic Research Service, 2025). Coupled with the rising costs of producing sugarbeets and sugarcane and processing them into sugar, this has created very tight operating margins for sugar producers (Deliberto and DeLong, 2024a). Looking ahead to the next growing season, farmers are optimistic that a new Farm Bill will strengthen the farm safety net and that growing conditions will be favorable for sugarbeets and sugarcane. 

    References

    American Sugar Alliance. (2025). Sugar’s Coast-to-Coast Reach. Retrieved from: https://sugaralliance.org/us-sugar/sugars-coast-to-coast-reach

    Deliberto, M., and K.L. DeLong. (2024a). “Examining Sugarcane and Sugarbeet Production Costs.” Southern Ag Today. Retrieved from: https://southernagtoday.org/2023/12/11/examining-sugarcane-and-sugarbeet-production-costs/.

    Deliberto, M., K.L. DeLong, and B. Fischer. (2024b). “Analyzing World and U.S. Sugar Price Dynamics.” https://southernagtoday.org/2024/05/20/analyzing-world-and-u-s-sugar-price-dynamics/.  

    Fischer, B.L., J.L. Outlaw, J.M. Raulston, and B.K. Herbst. (2022). “Economic Impact of the U.S. Sugar Industry.” Retrieved from: https://sugaralliance.org/wp-content/uploads/2022/06/Sugar-Report.pdf

    Food Business News. (2024). Retrieved from: https://www.foodbusinessnews.net/articles/25615-last-sugar-cane-grower-in-texas-to-close.

    Louisiana Sugarcane Industry. Production Data 1984-2023. Retrieved from: https://amscl.wpenginepowered.com/wp-content/uploads/2024/11/Production-Data-1984-to-2023.jpg

    Southern Minnesota Beet Sugar Cooperative. (2025). Southern Minnesota Beet Sugar Cooperative to Decommission Spreckels Sugar Company, Inc. in California. Retrieved from: https://www.smbsc.com/ourstory-2/SMBSCMediaReleaseReSpreckelsSugarCompany2025.04.22.pdf.

    USDA Economic Research Service. (2025). World, U.S., and Mexican Sugar and Corn Sweetener Prices. Tables 5 and 5a. Retrieved from: https://www.ers.usda.gov/data-products/sugar-and-sweeteners-yearbook-tables.

    USDA National Agricultural Statistics Service (NASS). (2025). Prospective Plantings. Retrieved from: https://usda.library.cornell.edu/concern/publications/x633f100h

    USDA World Agricultural Supply and Demand Estimates. (2025). Retrieved from: https://www.usda.gov/about-usda/general-information/staff-offices/office-chief-economist/commodity-markets/wasde-report.

    Western Ag Network. (2023). “Sydney Sugars to Begin Closure Procedures in April.” Retrieved from: https://westernagnetwork.com/sidney-sugars-to-begin-closure-procedures-in-april


    Deliberto, Michael, and Karen L. DeLong. “The 2025 Sugar Market Domestic Supply and Outlook.Southern Ag Today 5(22.3). May 28, 2025. Permalink