Throughout this growing season, much of the conversation has centered around expectations for a historically large U.S. corn crop. In its September report, USDA projected production at 16.8 billion bushels, nearly 1.5 billion more than the previous record set in 2023. As noted in last week’s Southern Ag Today article, Potential Market Impacts of Missing a WASDE Report During Government Shutdowns, the October WASDE was canceled due to the government shutdown, leaving producers without updated yield or demand estimates. Now that harvest is well underway and yields are coming in, USDA may trim its yield estimate slightly, but even with a small adjustment, we are still looking at a massive crop. The key question moving forward is simple: what are we going to do with all of it?
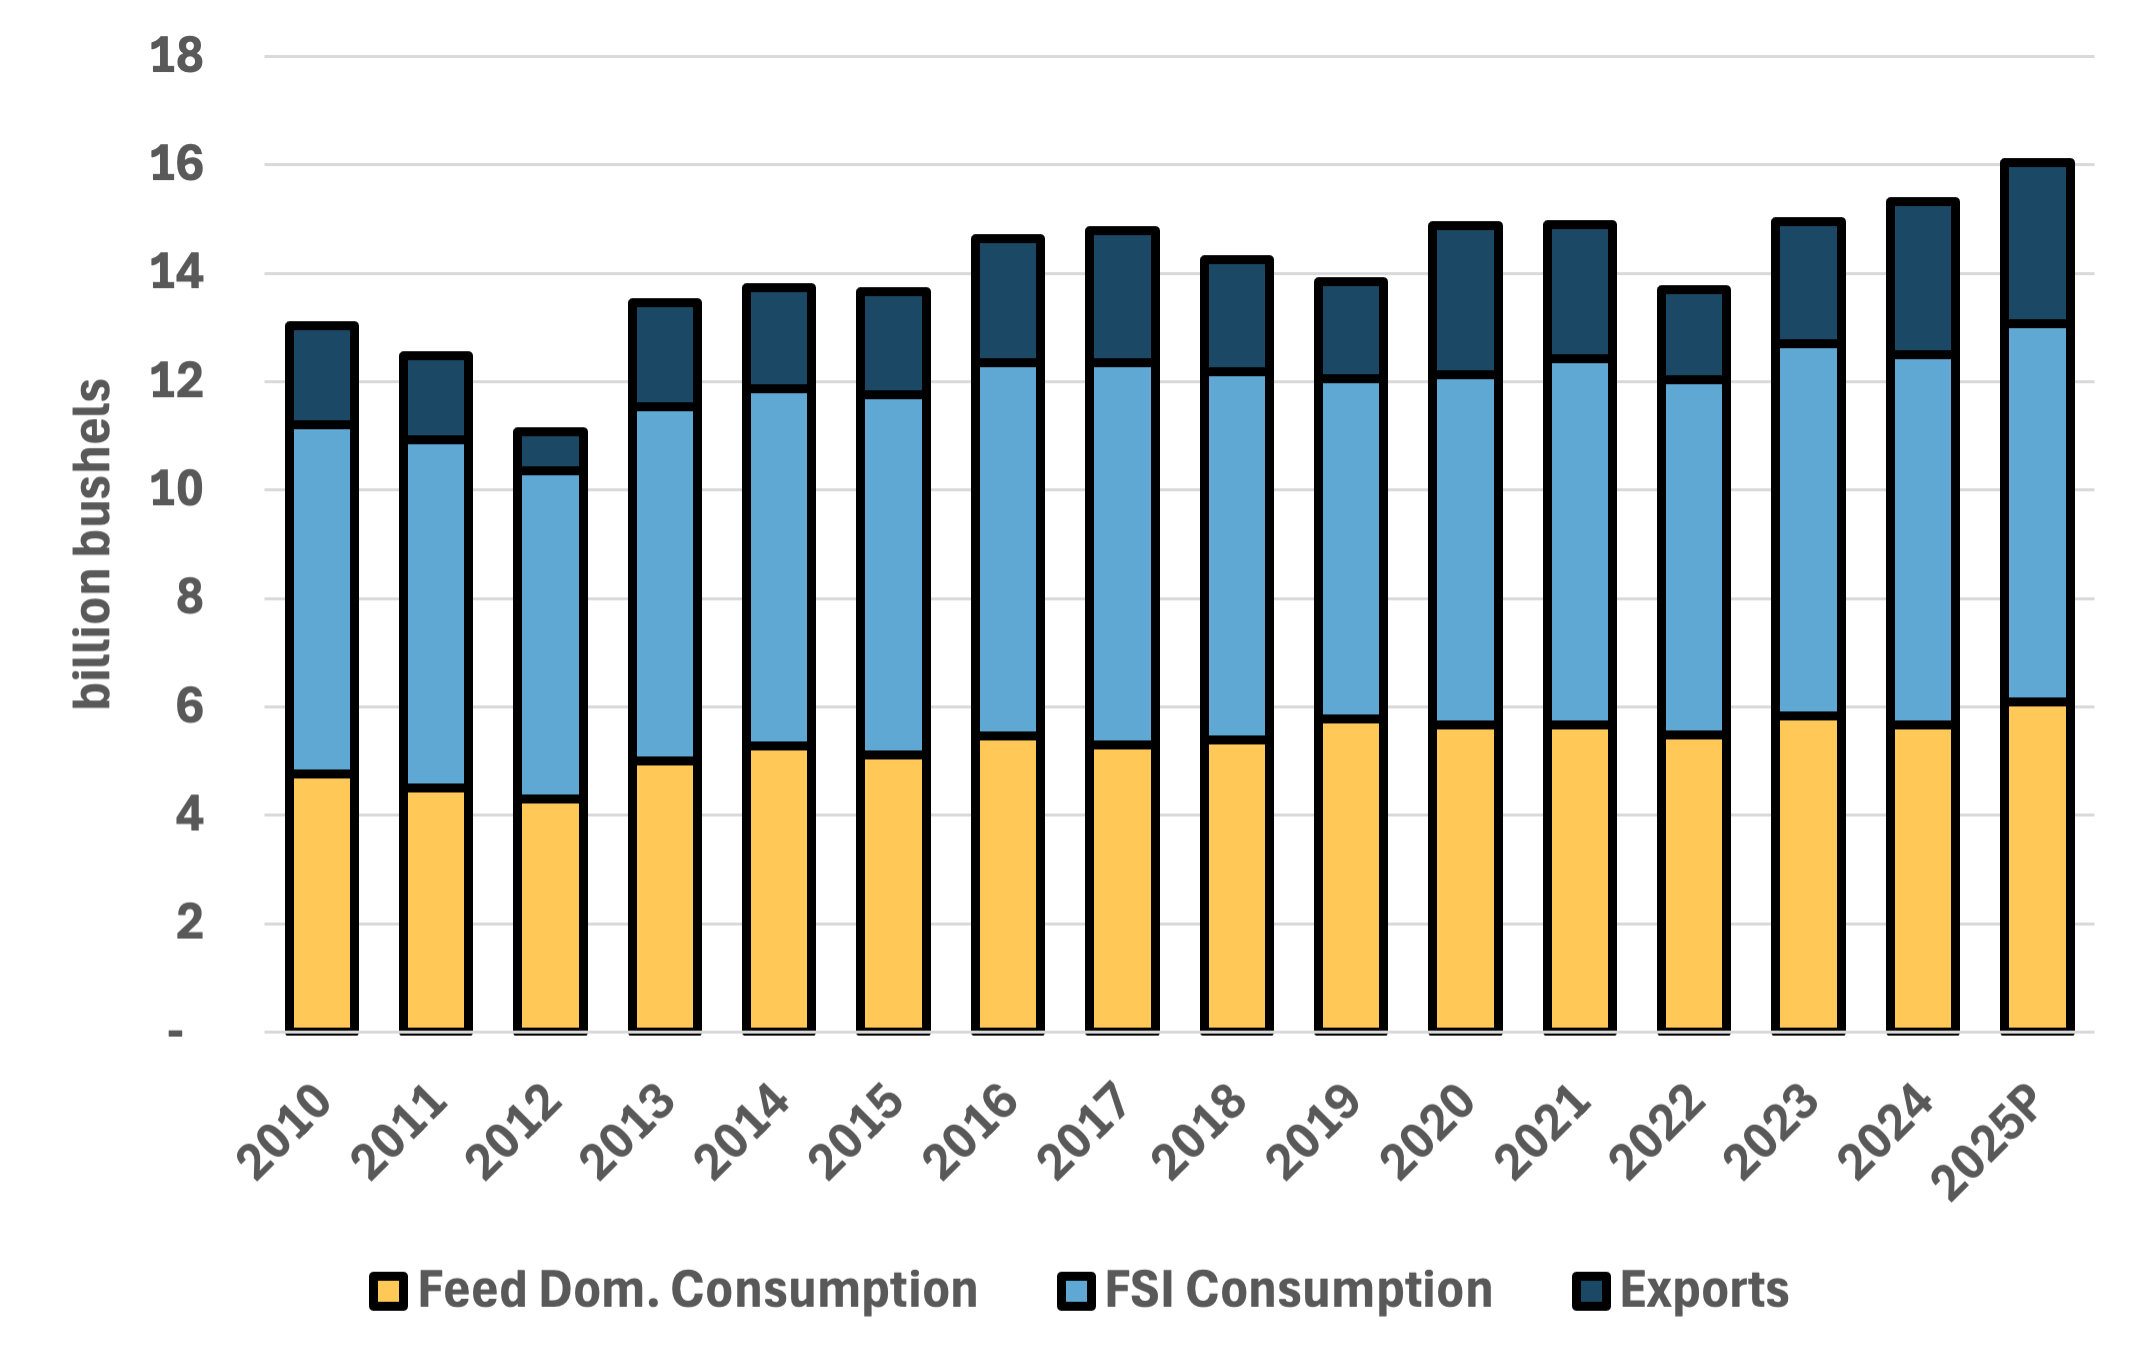
Most U.S. corn is used for three primary purposes: livestock feed, ethanol production, and exports, which together account for roughly 97 percent of total use. The remaining share goes toward food and seed. Figure 1 shows annual corn consumption since 2010. Corn used for feed is currently projected at 6.1 billion bushels, the highest level since at least 2000. The projected grain-consuming animal units (GCAUs), a USDA measure of animals on feed, are estimated at 100.8 for 2025. Even with a smaller cattle supply, this is higher than the 2024 measure of 99.9, driven by increases in hogs, layers, and broilers. Lower corn prices make it a more competitive feed ingredient that will continue to support feed demand in the year ahead.
Corn use for ethanol production is projected at 5.6 billion bushels for the 2025 marketing year, up from 5.4 billion bushels last year. Although ethanol use has leveled off since the rapid expansion seen during the 2010s, it remains a steady and reliable source of demand for U.S. corn. Recent policy discussions around allowing year-round sales of E15 could provide an additional boost to corn demand through expanded ethanol use.
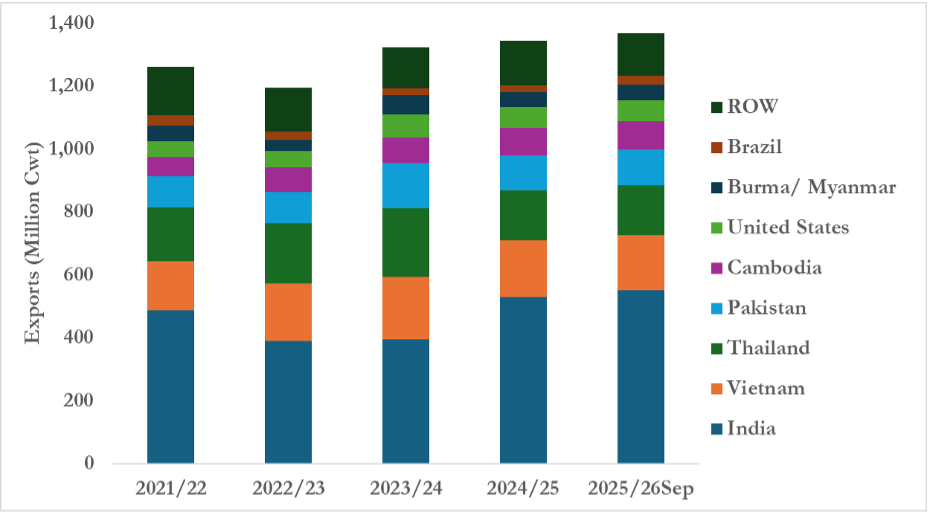
While other commodities have faced headwinds, exports have been a bright spot for corn demand this year. Export sales have moved at a blistering pace, with the current forecast calling for a record 3 billion bushels of U.S. corn exports. Notably, this surge has occurred without purchases from China, which has remained absent from the U.S. corn market since the 2023/24 marketing year. Instead, sales to traditional trading partners have been strong, led by Mexico, followed by Japan and Colombia. Due to the government shutdown, USDA has not updated its weekly export sales report since the week of September 18. When reporting resumes, the next update will be closely watched to see whether corn export sales have maintained their rapid pace.
Given the elevated demand projections for corn, it is hard to see a significant price boost coming from the demand side throughout the rest of the year. Large supplies will continue to weigh on the market, and all eyes will be on the final production numbers. In this environment, managing price risk becomes critical. Producers with unpriced grain should consider setting clear marketing targets and evaluating tools such as forward contracts, futures, or options to lock in favorable opportunities when they arise. A disciplined approach to marketing can help balance downside risk while keeping flexibility for potential rallies later in the year.
Figure 1. U.S. Corn Consumption by Category, 2010-2025. Source: USDA
Maples, Will. “Demand Outlook for a Record U.S. Corn Crop.” Southern Ag Today 5(43.3). October 22, 2025. Permalink