Like many other agricultural sectors, there has been consolidation in United States (US) farm-level sugar production. Sugar is a unique commodity because about 56 percent of the domestic production of sugar originates from sugarbeets and 44 percent originates from sugarcane. The US domestic production of sugar has increased from 8.02 million short tons raw value (STRV) in 1997 to 9.31 million STRV in 2024, an increase of 16% (USDA ERS, 2025a). However, there are now 50 percent fewer sugarbeet and sugarcane farms in the country.
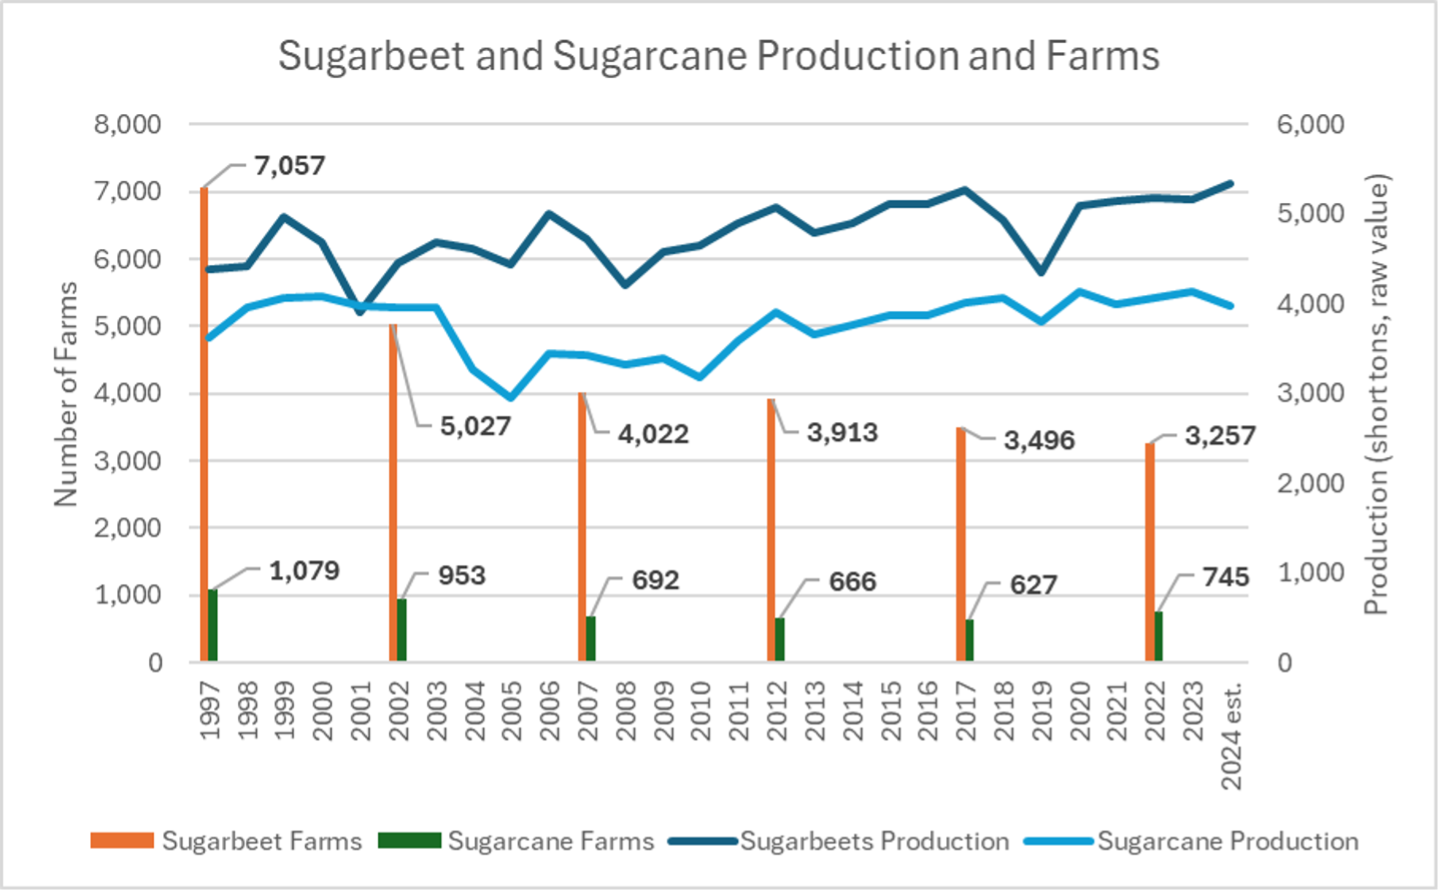
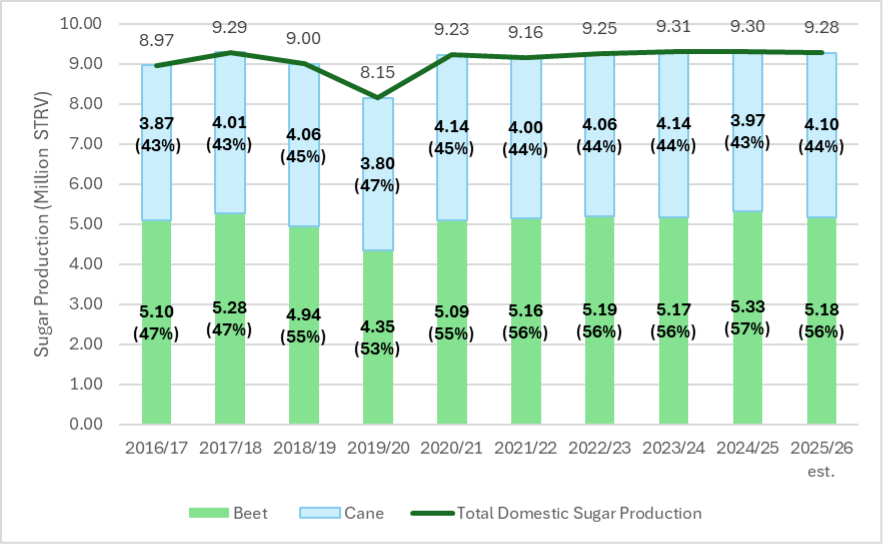
In 1997, the USDA Census of Agriculture recorded a total of 8,136 sugarbeet and sugarcane producing farms (USDA NASS, 2025). However, by 2022 that number had declined to 4,002, a decrease of over 50 percent. Figure 1 shows sugarbeet and sugarcane production from 1997 through 2024 and the number of sugarbeet and sugarcane farms recorded by the US Census of Agriculture every five years, beginning in 1997.
Figure 1. Sugarbeet and Sugarcane Production and Farms.
Sugarbeets
From 1997 through 2022, while there was a decrease in sugarbeet farms and sugarbeet harvested acres, there was an increase in the amount of sugar produced from sugarbeets. The number of sugarbeet farms fell by 54 percent, from 7,057 farms in 1997 to only 3,257 in 2022 (Figure 1). Sugarbeet acres also fell by 20 percent from 1.43 million acres in 1997 to 1.14 million acres in 2022 (USDA ERS, 2025a). However, there was an 18% increase in sugar produced from sugarbeets during this time, with 4.39 million STRV of sugar produced from sugarbeets in 1997 and 5.19 million STRV of sugar produced from sugarbeets in 2022 (Figure 1).
These trends indicate that in 1997, the average sugarbeet farm size was 203 acres contributing to final sugar production of 622 STRV (3.06 STRV of sugar per acre). Meanwhile in 2022, the average sugarbeet farm size was 350 acres contributing to final sugar production of 1,593 STRV (4.55 STRV of sugar per acre). Thus, sugarbeet farms have become not only larger (350 acres per farm versus 203 acres per farm), but they have also become 49 percent more efficient! One reason for this increased efficiency is that all sugarbeets grown in the US have been genetically modified since 2009 (Kennedy, Schmitz and Lewis, 2020).
Sugarbeets are currently grown in four regions and 11 states: the Great Lakes (Michigan), the Upper Midwest (Minnesota, South Dakota, and North Dakota), the Great Plains (Colorado, Montana, Nebraska, Wyoming), and the Far West (Idaho, Oregon, Washington).[1] Sugarbeets are grown in rotation with other crops. Historically, sugarbeet yields in the Far West have been highest. Western sugarbeet production typically utilizes irrigation, which is in contrast to the eastern regions of sugarbeet production that do not use irrigation (USDA ERS, 2025a, b). The largest region for sugarbeet production is the Upper Midwest (Minnesota and North Dakota) (USDA ERS, 2025a). The Upper Midwest represented 42 percent of sugarbeet total production in 1997 and represented 53 percent of sugarbeet total production in 2022 (USDA ERS, 2025a).
Each sugarbeet producing region has experienced both consolidation and increased efficiency over the years. For example, the number of sugarbeet farms in Michigan was 1,164 in 1997 (USDA NASS, 2025). That number decreased 43 percent by 2022 to only 663. However, the number of tons of sugarbeets harvested in 1997 was only 3.0 million, and by 2022 the state harvested 4.1 million tons of sugarbeets.
Sugarcane
Sugarcane has also experienced consolidation over the period of 1997 through 2022, where the number of sugarcane farms fell by approximately 31 percent from 1,079 in 1997 to 745 in 2022 without experiencing declines in sugar production or acres engaged in sugarcane production. Sugarcane acres actually increased by 3 percent in 2022 (913,738 acres) relative to 1997 (890,193 acres) (USDA NASS, 2025). Production of sugarcane (for sugar) also increased by approximately 11 percent to 4.06 million STRV in 2022 relative to 1997 (3.63 million STRV) (Figure 1).
These trends indicate that in 1997, the average size of a sugarcane farm was 825 acres and contributed to final sugar production of 3,365 STRV (4.08 STRV of sugar per acre). By 2022, the average sugarcane farm size was 1,226 acres and contributed to final sugar production of 5,454 STRV (4.45 STRV of sugar per acre). Thus, the sugarcane sector has seen improvements in production efficiency of approximately 9 percent over the observed period (1997-2022).
As recently as 2016, sugarcane was produced in four states (Florida, Louisiana, Hawaii, and Texas). Sugarcane production in Hawaii and Texas ceased in 2016 and 2023, respectively. In Hawaii, rising labor and land cost were contributing factors in the closure of Hawaiian Commercial & Sugar Company (HC&S) in Maui. Production in Texas ceased due to water shortages exacerbated by Mexico’s consistent failure to fulfill its treaty obligations to share irrigation water from the Rio Grande. The lack of sugarcane production due to uncertain water availability resulted in the closure of the only sugar mill in the state, Rio Grande Valley Sugar Growers, Inc. Since 2017, overall sugarcane production has increased in the remaining sugarcane producing states of Louisiana and Florida, despite closure of the sugarcane industries in Hawaii and Texas. In Florida, the number of farms has actually increased from 152 to 240, with the average farm size contracting from 2,772 to 1,656 acres. However, in Louisiana, farms have decreased from 705 to 420 farms. The average size of a Louisiana farm has increased from 561 to 1,158 acres.
In Florida, sugarcane is mainly produced in organic soils along the southern and southeastern shore of Lake Okeechobee in southern Florida. The decrease in Florida’s sugarcane acreage leading to 2007 reflected conversion of cropland to public water storage in response to the Comprehensive Everglades Restoration Plan and reallocation of cropland for sod production in the early 2000’s (VanWeelden et. al., 2023). Sugarcane cultivation on sandy soil is expanding as the expense of citrus cultivation has increased due to citrus greening disease (Sandhu et. al., 2024).
Sugarcane acreage across Louisiana has been expanding for the past decade, primarily because of the reduced volatility in sugar prices relative to other crops such as corn, rice, and soybeans. (Gautreaux, 2025). Louisiana sugarcane production has also expanded with the development and adoption of high-yielding sugarcane varieties and with the evolution of custom harvesting groups that induce nontraditional producers into sugarcane cultivation by alleviating concerns for those producers regarding increased capitalization costs of purchasing and maintaining specialized sugarcane harvest equipment.
[1] California is producing sugarbeets in 2025, but the processing facility will close following this crop season (https://www.smbsc.com/ourstory-2/SMBSCMediaReleaseReSpreckelsSugarCompany2025.04.22.pdf).
References
Gautreaux, K. (2025). “Sugarcane expansion moving northward and westward but also increasing in traditional areas.” Louisiana State University AgCenter. https://www.lsuagcenter.com/articles/page1738854832844 .
Kennedy, P. L., A. Schmitz, and K.L. DeLong. (2020). Biotechnology and demand concerns: the case of genetically modified US sugar beets. AgBioForum, 22(1), 49-60.
Sandhu, H., M. VanWeelden, A. Sharma, and W. Davidson. (2024). CP 03-1912: A Sugarcane Cultivar Expanding on Sand Soil in Florida, University of Florida, IFAS Extension. https://edis.ifas.ufl.edu/publication/SC111 .
United States Department of Agriculture (USDA), Economic Research Service (ERS). (2025a). Sugar and Sweeteners Yearbook Tables. Group 3 Tables. Retrieved from: https://www.ers.usda.gov/data-products/sugar-and-sweeteners-yearbook-tables
United States Department of Agriculture (USDA), Economic Research Service (ERS). (2025b). Sugar and Sweeteners-Background. Retrieved from: https://www.ers.usda.gov/topics/crops/sugar-and-sweeteners/background#:~:text=Sugarbeet%20production%20in%20the%20Far,is%20typically%20on%20irrigated%20land.
United States Department of Agriculture (USDA), National Agricultural Statistics Service (NASS). (2025). U.S. Census of Agriculture, Volume 1, Chapter 1: U.S. National Level Data. Retrieved from: https://www.nass.usda.gov/Publications/AgCensus/2022/index.php .
VanWeelden, M., C. Kammerer, W. Davidson, M. Baltazar, and R. Rice. (2023). Sugarcane Variety Census: Florida 2022, Sugar Journal 86 (2), July 2023.
Headline Photo By: Young Stock photos by Vecteezy
Delberto, Michael, Brian Hilbun, and Karen L. DeLong. “Sugarbeet and Sugarcane Production and Farm Trends.” Southern Ag Today 5(26.3). June 25, 2025. Permalink

