The April World Agricultural Supply and Demand Estimates (WASDE) report released Thursday, April 10, made a few updates to the 2024/25 balance sheets for major row crops that were generally minor adjustments to old crop estimates for the United States (U.S.). The Crop Production report was also released on April 10thwith no new data reported for row crops. Thus, the adjustments in the WASDE report were made on the use side of the balance sheet. The U.S. corn balance sheet was viewed as the most bullish with a sizable increase in the export forecast of 100 million bushels due to strong sales. The increase was partially offset by a 25-million-bushel reduction in feed and residual use due to slower disappearance, as indicated in the March 31 Grain Stocks report. The net effect was ending stocks adjusted down 75 million bushels from March to 1.5 billion bushels, while and the season-average corn price was left unchanged at $4.35 per bushel. The futures market responded on April 10 with a 9-cent increase in nearby futures to $4.82 per bushel.
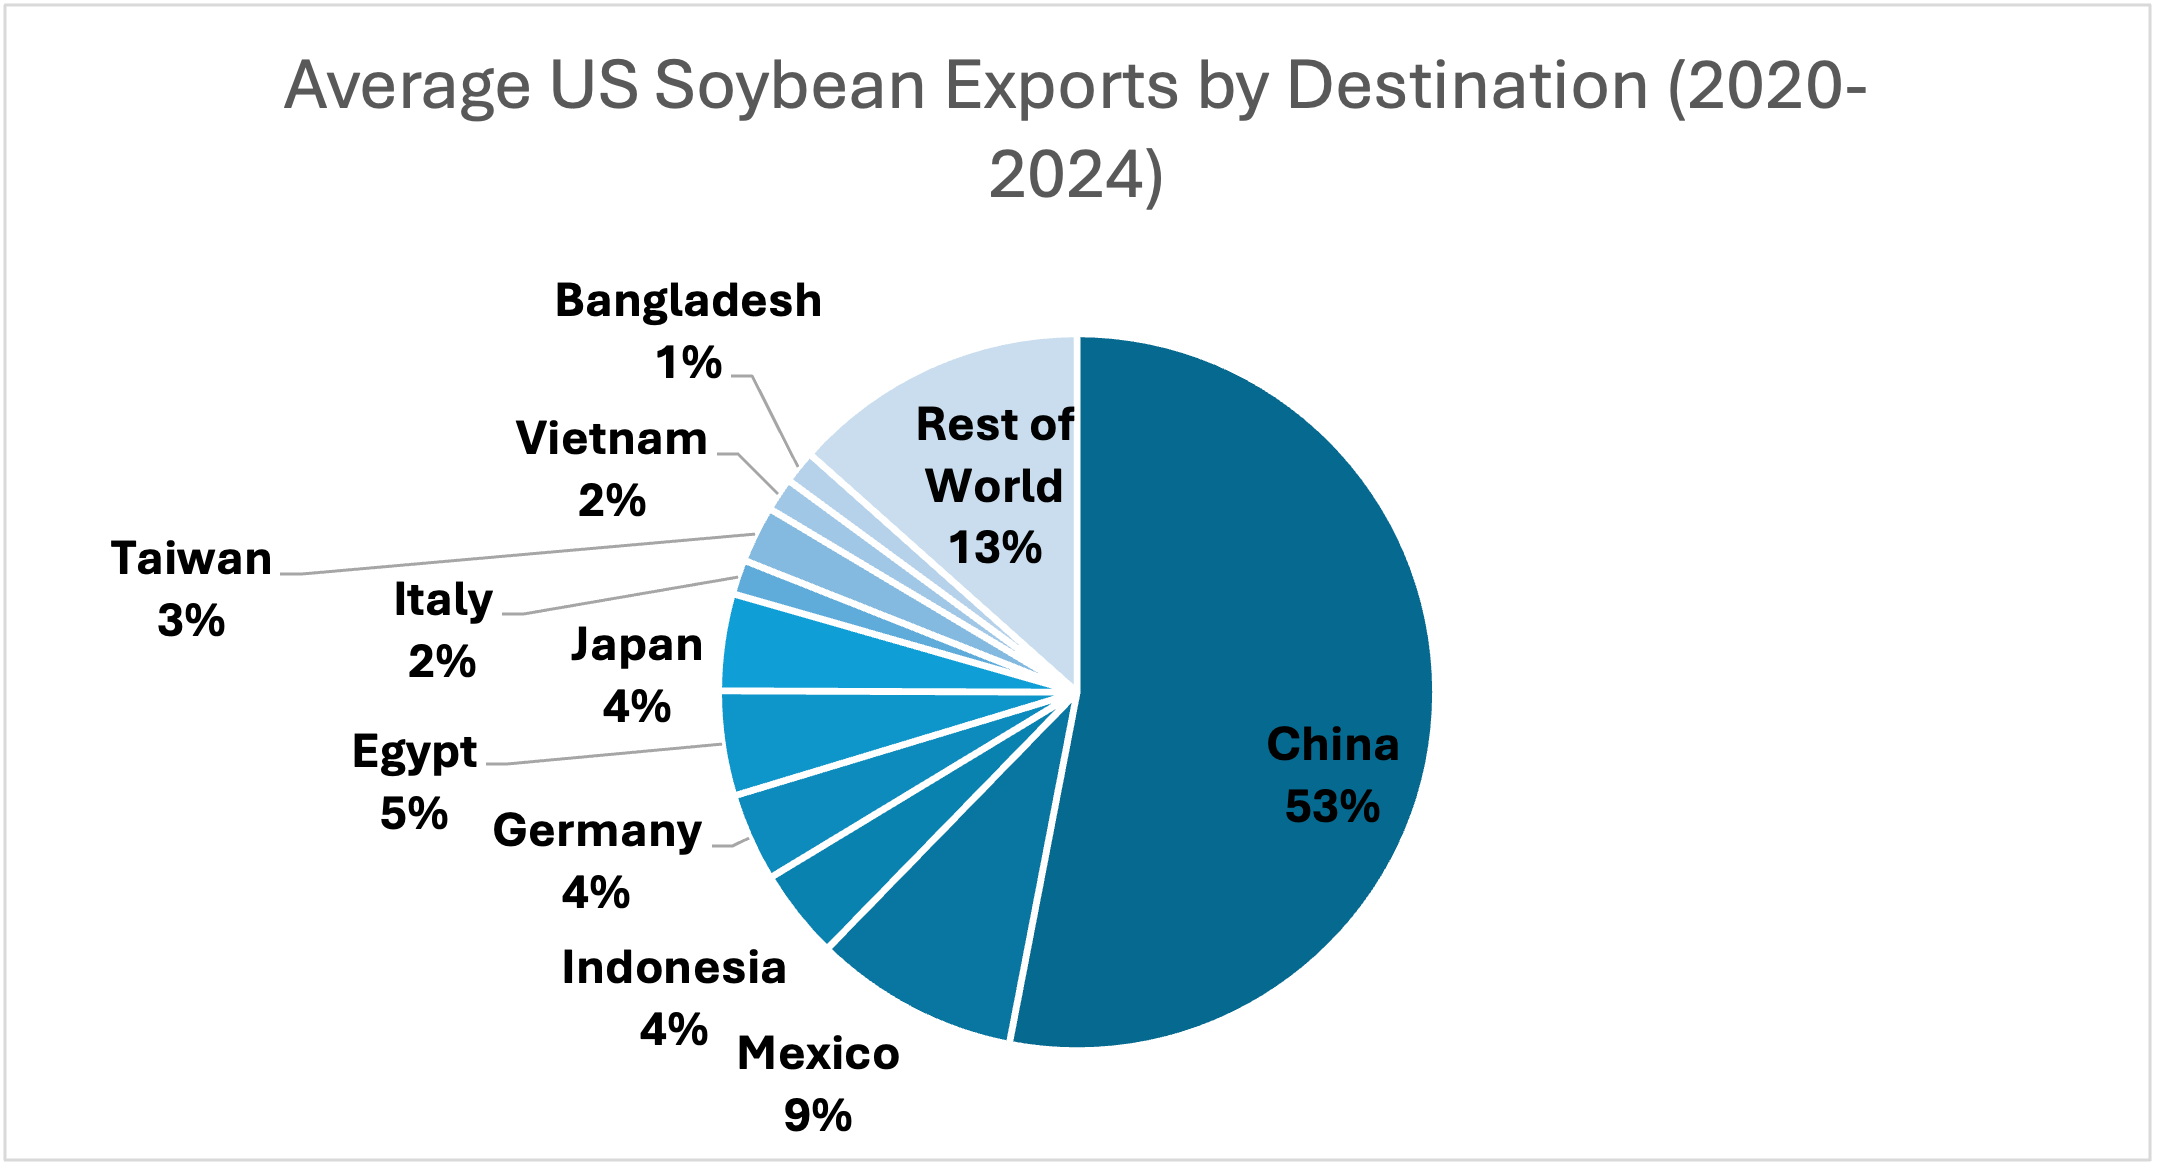
Soybeans saw U.S. ending stocks tighten up a little bit with an increase in crush of 10 million bushels due to higher meal domestic use and oil exports. Imports of soybean oil were adjusted up 5 million bushels resulting in a net increase in ending stocks of 5 million bushels. The season average price for soybeans remained unchanged at $9.95 per bushel. Nearby soybean futures increased $0.16 per bushel closing at $10.29 per bushel on April 10, continuing a rally after the initial shock of the April 4 tariff announcement.
The global rice market is experiencing increased production due to India’s consecutive record crops, surpassing China as the largest world rice producer. U.S. exports were adjusted down due mainly to medium grain export reduction, while the average season price stayed the same at $15.60 per cwt.
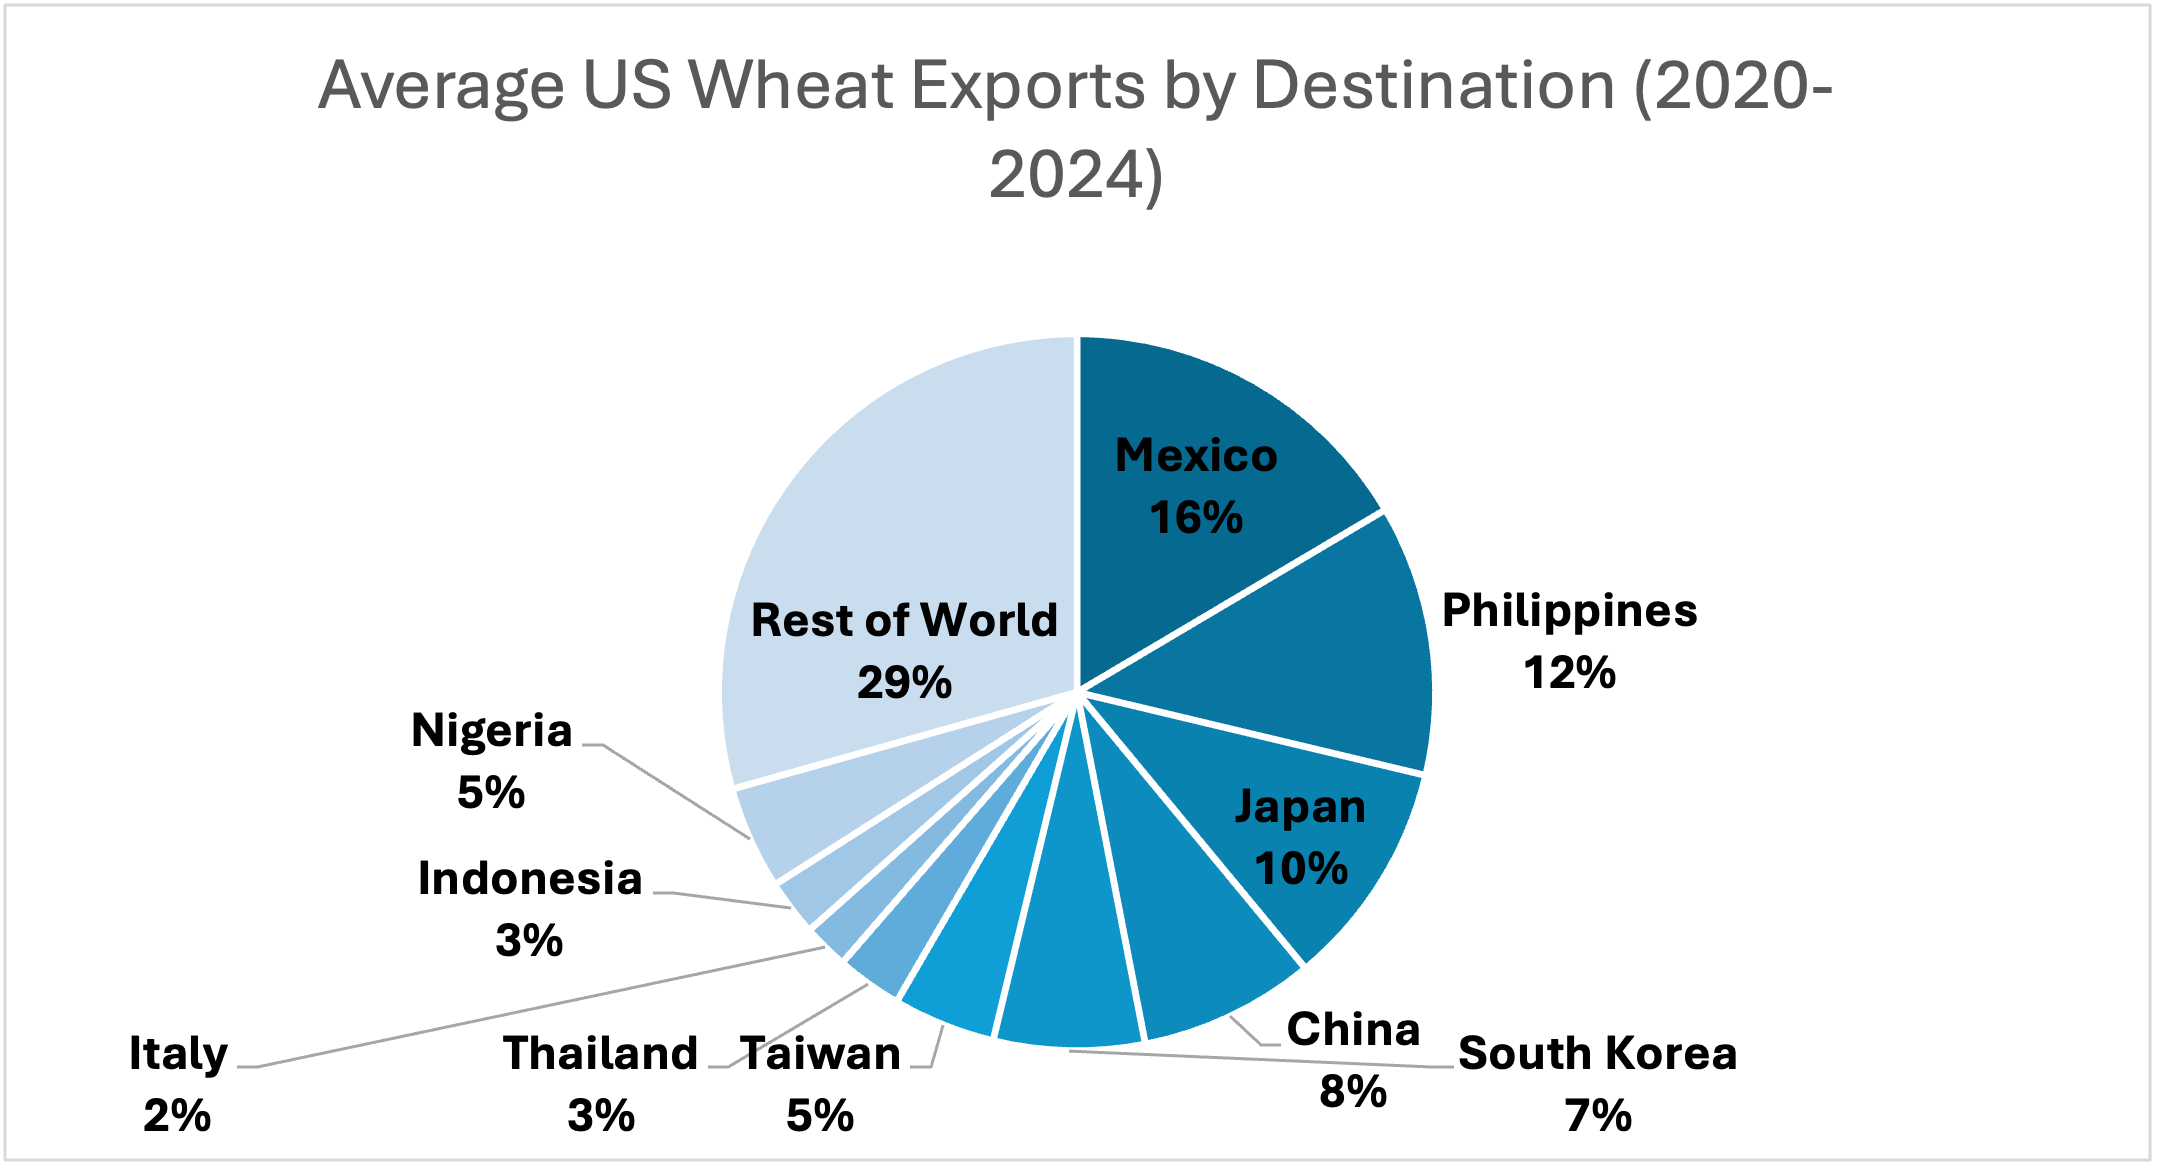
Cotton and wheat saw the most bearish adjustments to their balance sheets. Lower sales of hard red wheat led to a decrease in U.S. wheat exports by 15 million bushels, while imports increased by 10 million bushels. Wheat ending stocks were lowered by 27 million bushels, but the average price stayed the same at $5.50 per bushel. Nearby futures dropped 5 cents to $5.38 per bushel on April 10. The only change made to U.S. cotton was the export forecast being lowered by 100,000 bales. However, if realized, the reduced exports would result in the largest ending stocks since 2008 other than the 2019 crop when a large crop and a drop in domestic mill use led to 7.45 million bales in ending stocks. The season average price for cotton remained at $0.63 per pound. Nearby cotton futures rallied back to $0.66 per pound before the WASDE report and did not move much immediately after the WASDE report was released.
The market appears to be reacting to the uncertainty of tariffs and potential planted acres. The USDA will shift its focus from old crop to new crop in the May WASDE report with new 2025/26 supply and use forecasts.
Table 1: USDA Changes to U.S. Balance Sheets in April WASDE Report, April 10, 2025.
| CornMil. Bu. | CottonMil. Bales | RiceMil. Cwt | SoybeansMil. Bu. | WheatMil. Bu. | |
| Beginning Stocks | — | — | — | — | — |
| Imports | — | — | -1 | +5 | +10 |
| Domestic Use | -25 | — | +3 | +10 | -2 |
| Exports | +100 | -0.1 | -1.5 | — | -15 |
| Ending Stocks | -75 | +0.10 | -2.5 | -5 | +27 |
| Avg. Price | — | — | — | — | — |
Note: — indicates no change from the prior month.
Smith, Nathan. “April WASDE Updates Old Crop Estimates Before Shifting Focus to New Crop Forecast in May.” Southern Ag Today 5(16.3). April 16, 2025. Permalink