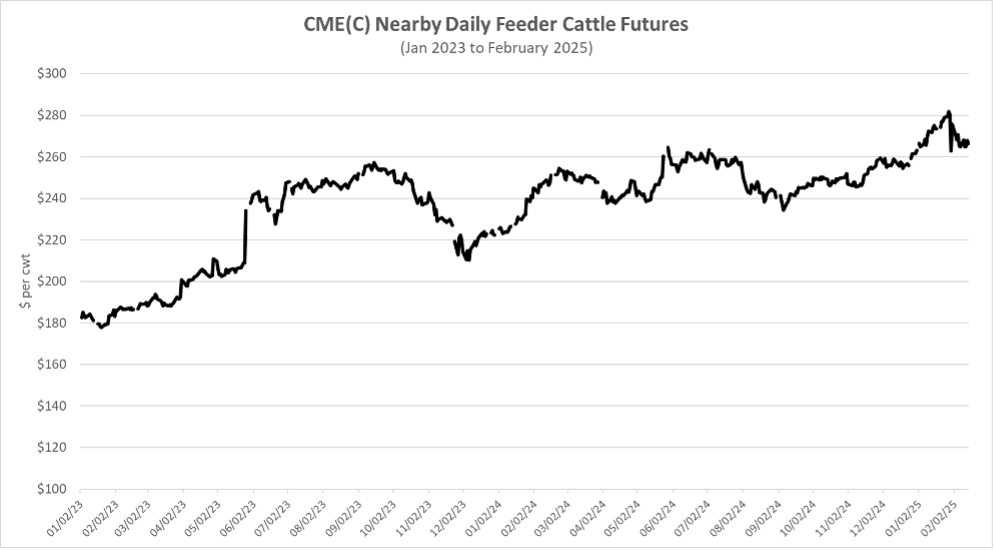
While it is hard to dispute the overall strength of the recent cattle market, it is also important to note that during the last 26 months there have been multiple times when markets saw significant downward swings. The most recent of these occurred since the end of January and was likely sparked by the resumption of live cattle imports from Mexico, continued talk of trade disruptions, Avian Influenza, and any number of other factors. The market also fell by more than $40 per cwt from September to December 2023 and more than $30 per cwt from late May to early September 2024. For producers who sold cattle during those pullbacks, the impact on returns was significant.
There are a lot of potential strategies to manage price risk, and the simplest one may be a forward contract. By forward contracting cattle, price risk is largely eliminated as the seller and buyer agree on a purchase price prior to delivery of the cattle. A similar strategy would be selling cattle through an internet auction and specifying delivery at a later time. In both cases, the seller entering the forward contract still has production risk as they must meet the specifications of the contract (weight, quality, etc.), but market swings are no longer a concern.
Finally, I have talked more about Livestock Risk Protection (LRP) insurance than any other risk management strategy recently. It works almost exactly like a put option but is much simpler and has the advantage of flexibility on scale. Unlike several other price risk management tools, LRP insurance can be purchased on any number of head, which is much easier for smaller operations to utilize. LRP has been made more attractive over the last several years through increased premium subsidies and allowing producers to pay premiums after the ending date of the policy.
The specific tool or strategy that cattle producers utilize to manage price risk is less important than their overall risk management plan. I encourage producers to know what risk management tools are available to them, understand how changes in sale price impact their profits, and plan to cover themselves from downside price risk. I still feel good about the fundamentals of the cattle market, but I think the first couple weeks of February have been a good reminder that price risk always exists, even in a bull market!
Several articles have been written for Southern Ag Today on how farms can manage their tax obligations. This time of year, farm management specialists begin to receive questions of all kinds regarding taxes, especially for farms that try to meet the March 1 filing deadline available for qualifying farmers. Tax management is only one part of managing a farm but can be crucial. We wanted to relay a handful of resources that producers and other agribusiness specialists may find useful this time of year.
The Internal Revenue Service (IRS) website, www.IRS.gov, is often the first and best place to begin looking for information. The site contains a vast amount of information and resources, which can also make it a bit daunting. You can find copies of individual tax forms, form instructions, news updates, and educational resources such as Publication 225 – Farmers Tax Guide. The Interactive Tax Assistant (ITA) is designed to answer many basic questions that a taxpayer may have. It includes basic tax return information like filing status, dependents, due dates, and so on, but it can also answer questions regarding tax deductions, credits, income, and payment-related questions. Typically, the assistant will ask questions related to your situation that will help determine which rules may impact you.
The other section of the IRS website that farm owners may find helpful is the Small Business Self-Employed Tax Center. This section provides information for self-employed individuals with Schedule C (small business) and/or Schedule F (farming) activities relevant for most farm owners. One of the best sections is the IRS Video Portal and Small Business Virtual Tax Workshop, which includes short video explanations on various tax rules. Other tools within the IRS website help taxpayers and preparers, including free filing options, year-to-date withholding amounts, payment options, and finding transcripts of a taxpayer’s account.
Outside of the IRS, there are several other sources of information. The USDA website, www.farmers.gov, has a section specifically on tax education. On this website, you will find webinars on timely topics, frequently asked questions regarding farm taxation, and other resources to help farmers (especially newer farmers) navigate some of these issues.
Another site, www.RuralTax.org, is maintained by land-grant university professionals throughout the country who work in farm management and tax education. There are dozens of articles available on newer, timely topics, as well as archived information and a small farms tax guide producers may find helpful. Other sources of local help include lenders, fellow producers, your local Extension office, and certainly a designated tax professional. If you need to find a tax preparer, there are guides available through the IRS and Rural Tax. This article is not intended as professional tax advice but general knowledge for agricultural businesses who may benefit by having a bit more information and resources at their disposal. We encourage you to work with a professional who knows you and your farm and can best advise you on your situation.
Burkett, Kevin. “Death and …” Southern Ag Today 5(10.1). March 3, 2025. Permalink
With cash wheat prices falling, farmers in many regions of the South are once again facing difficult decisions in their efforts to maximize returns on their crops. As prices dip below the breakeven threshold, alternative uses for wheat, such as grazing or baling, may offer improved profitability.
What follows is an example of a Wheat and Small Grains Decision Aid tool designed to help farmers analyze whether it is more beneficial to use wheat for grain, grazing, or hay. Evaluating the available alternatives is always prudent based on the relative prices of grazing, wheat hay, and grain, as well as the expected yields, production costs, and the availability and cost of harvesting or baling equipment. For this analysis, we assume that harvesting and baling equipment is custom-hired. However, from a cash cost perspective, owning your harvesting or baling equipment will influence the comparison of these two alternatives.
In contrast to last year, the hay alternative demonstrates higher profitability under similar production conditions in the Rolling Plains region of Texas. To estimate potential hay production, we assume grain yield corresponds to 40% of total biomass production. Thus, a wheat yield of 45 bushels per acre would produce a total biomass of approximately 3.1 tons per acre. Further, we assume that harvest and baling will yield 76% of this total biomass or about 2.3 tons per acre[1]. Estimating both grain and hay yield potential is essential when comparing these options.
The grazing option also appears more favorable, provided there is sufficient water, forage production, and livestock to maximize beef production.
Another way to approach this information is to determine at what price we must sell our hay (or grazing) to achieve a profit margin similar to that of wheat grain. The Decision Aid tool will use your data and costs to calculate hay and grazing breakeven prices (Graphs 1 and 2).
[1] (according to “Wheat Hay vs. Grain: A Comparison of Economic Opportunity” by Reagan Noland, Bill Thompson, and Clark Neely).
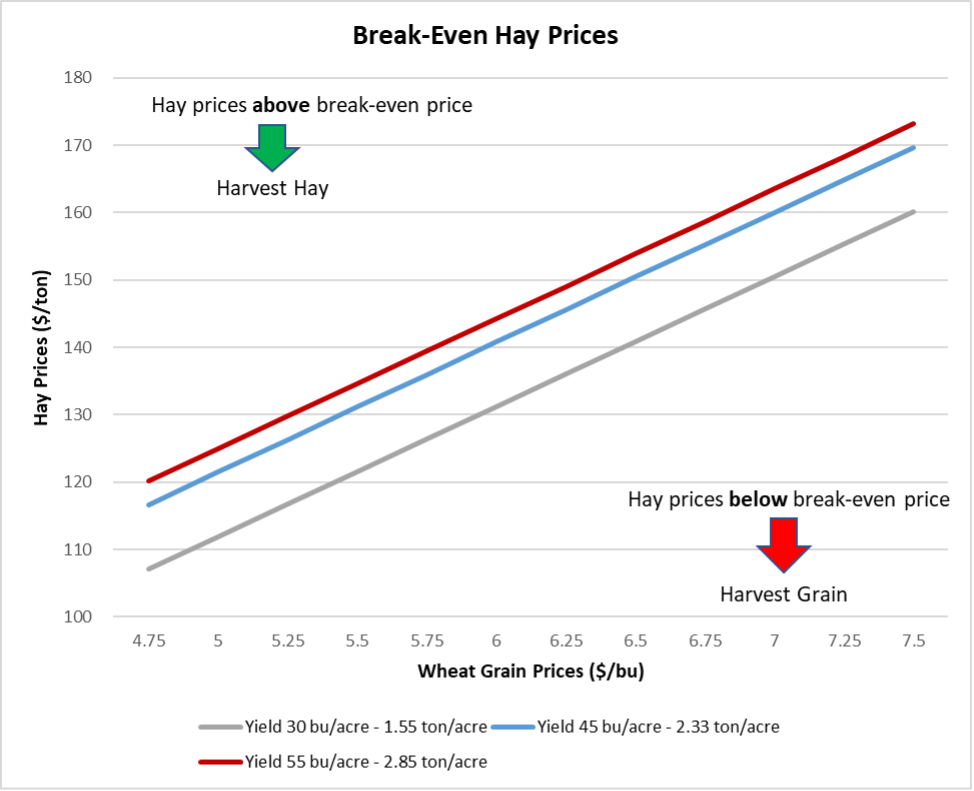
Graph 1. Break-Even Hay Prices
You might consider baling wheat if you can sell the hay above the breakeven price for hay given an expected grain price and yield. For example, with an estimated yield of 45 bushels per acre and a price of $5 per bushel, baling wheat would be more profitable if the net price per ton of hay exceeds $121 (assuming production of 76% of the total estimated biomass 2.3 tons per acre can be achieved).
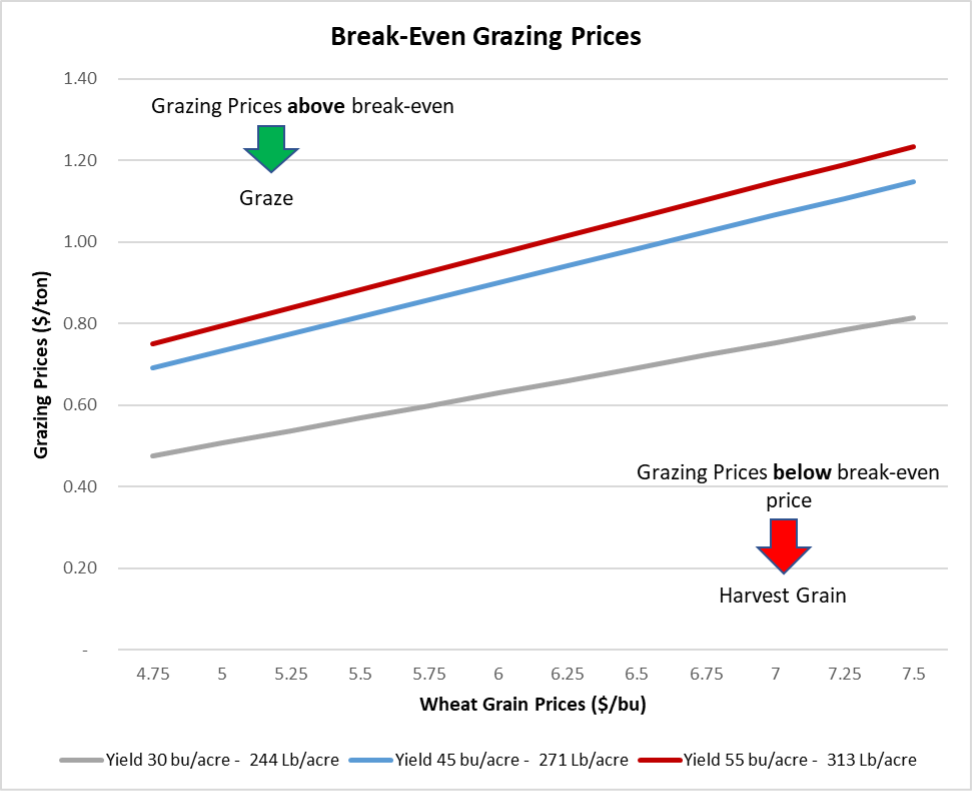
Graph 2. Break-Even Grazing Prices
Similarly, for an estimated yield of 45 bushels per acre and a price of $5 per bushel, you would consider grazing out wheat if the grazing price exceeds $0.73 per pound of gain.
With weak wheat prices, exploring alternatives like grazing or hay may lead to improved financial outcomes in many areas of the South. The Wheat and Small Grain Decision Aids (Link) serves as an economic and financial tool to assist every farmer in making informed decisions. Using your own data, yields, prices, and costs is essential for effectively analyzing these alternatives. These examples reflect the current wheat conditions and expectations in the Texas Rolling Plains. Please let us know if you need assistance in using this decision aid to help you make better choices for your farm.
Back in 2015, Extension specialists across the Southeast (many of our current SAT contributors) came together to address the decline in the farm economy, specifically declining commodity prices and increasing financial pressure. The resulting publication is a compilation of articles on topics including financial and risk management, marketing, farm management, trade, and stress management. The publication provides strategies for navigating financial difficulties, reducing risk, and identifying opportunities for growth even during downturns. While the publication is approaching ten years old, the core management strategies and concepts are still pertinent as we face a very similar farm economy today.
Key Farm Management Strategies include:
1. Financial Resilience: Carefully managing debt and maintaining cash flow are key to building resilience. Work closely with lenders to help monitor financial health and consider restructuring loans when necessary to preserve adequate working capital.
2. Cost Control and Efficiency: Reducing input costs, optimizing equipment use, and managing labor effectively can help improve profitability. Assessing operational expenses and cutting unnecessary expenditures are essential. Even the smallest changes can add up.
3. Risk Management Strategies: Utilizing crop insurance, following an effective marketing plan, diversifying income sources, and engaging in collaborative farming can help mitigate financial risk. Exploring all available government support programs and financial assistance options can provide relief during downturns.
4. Market Adaptation and Diversification: Considering alternative crops, livestock production adjustments, or producing for specialty markets can help maintain income. Understanding market trends and adapting production strategies accordingly is vital for long-term sustainability.
5. Mental Health and Well-being: Economic stress can take a toll on farmers’ mental health. Seeking support, engaging with extension services, and maintaining a strong social network can help manage stress, depression, and other challenges related to financial strain.For a deep dive on all economic topics, including the farm management strategies above, the full publication can be found here: “Surviving the Farm Economy Downturn”.
High input prices in recent years have significantly reduced profit margins for rice producers in the Mid-South. The negative impact of tightening profit margins is felt most acutely by rice producers renting cropland. A significant portion of rice ground in the region is rented using crop share arrangements, and the most common lease used is a net crop share lease. The terms of crop share leases differ by crop and region. Typically for rice in the Mid-South, the landlord supplies the land and pays all below-ground irrigation expenses (well, pump, gearhead fixed expenses) in exchange for a share of the crop. The tenant pays all above-ground irrigation expenses (irrigation power unit fixed expenses, irrigation energy), supplies all machinery, and pays virtually all variable costs. The rice drying cost is the only variable cost shared between the two parties. Other crop share leases exist where specific costs like fertilizer are shared, but these lease types are less common than the net crop share lease.
Net crop shares are very similar throughout the Mid-South. In Eastern Arkansas, the landlord’s share of the rice crop is typically 25%, but 20% crop shares are also common (ASFMRA, 2024). In Northeastern Louisiana, the landlord’s share of the rice crop is typically 20%. Crop share leases are used less frequently in Northwestern Mississippi relative to cash leases, but when a crop share lease is used, the landlord’s share of the rice crop is also typically 20%.
Crop share arrangements tend to change little over time, but increasing crop prices, rising input costs, or new technologies make it occasionally necessary to reevaluate the equitability of crop share arrangements for both parties (NCFMEC, 2011). This article demonstrates the contributions approach as a method to calculate equitable crop and cost shares for rice rental leases. The first step is to calculate the percentage contribution provided by each party in value of non-shared expenses. Remaining shared inputs and income are then shared in the same percentages as the collective non-shared contributions made by both parties.
Table 1 demonstrates how the contributions approach reflects the typical net crop share lease used in the Mid-South. In this example, the only cost item shared is drying costs. All other cost items are contributed solely by the landlord or the tenant. Total non-shared contributions equal $1,311, of which the landlord provides $250 (19.1%) and the tenant provides $1,061 (80.9%). The assumption then would be that drying costs and crop income would appropriately be shared at the same 19.1 / 80.9 percentages, which approaches the 20% landlord, 80% tenant split seen in many net crop share leases in the Mid-South.
Table 2 shows how the contributions approach may be applied to a crop share arrangement where several cost items are shared between the landlord and the tenant. In this table, the two parties share fertilizer, herbicide, and drying costs. The sharing of fertilizer and herbicide costs between the two parties is in accordance with the concept that yield-increasing inputs should be shared in the same percentage as the crop is shared (NCFMEC, 2011). An argument can be made that irrigation energy costs also fall into this yield-increasing input category. However, the cost of items to be shared or not shared in a crop share lease are based on negotiation between the tenant and the landlord.
Note in this example that the landlord’s share of the crop becomes larger when more cost items are shared between the two parties. This result occurs because the total proportion of contributions made by the landlord (particularly the land contribution but also irrigation wells) becomes larger when more costs are shared between the two parties. The equitable crop shares for each party, based on Table 2, are 24.5% of the gross returns for the landlord and 75.5% of the gross returns for the tenant.
a Annual cost items except Land and Management are rice production costs averaged across 2024 University of Arkansas rice crop enterprise budgets.
b The land charge is calculated as the average value for irrigated cropland in Eastern Arkansas reported in ASFMRA (2024) ($5,963/acre) multiplied by the rent-to-value ratio for irrigated cropland obtained from USDA NASS Arkansas (2024) ($152/acre cash rent divided by $4,200/acre for irrigated cropland).
c The management charge is calculated as rice gross return multiplied by the mid-range of charges for professional farm managers (5 to 10%) reported in NCFMEC (2011).