Category: Farm Management

  • The Long Term Economic Struggles of Southern Cotton Farmers

    The Long Term Economic Struggles of Southern Cotton Farmers

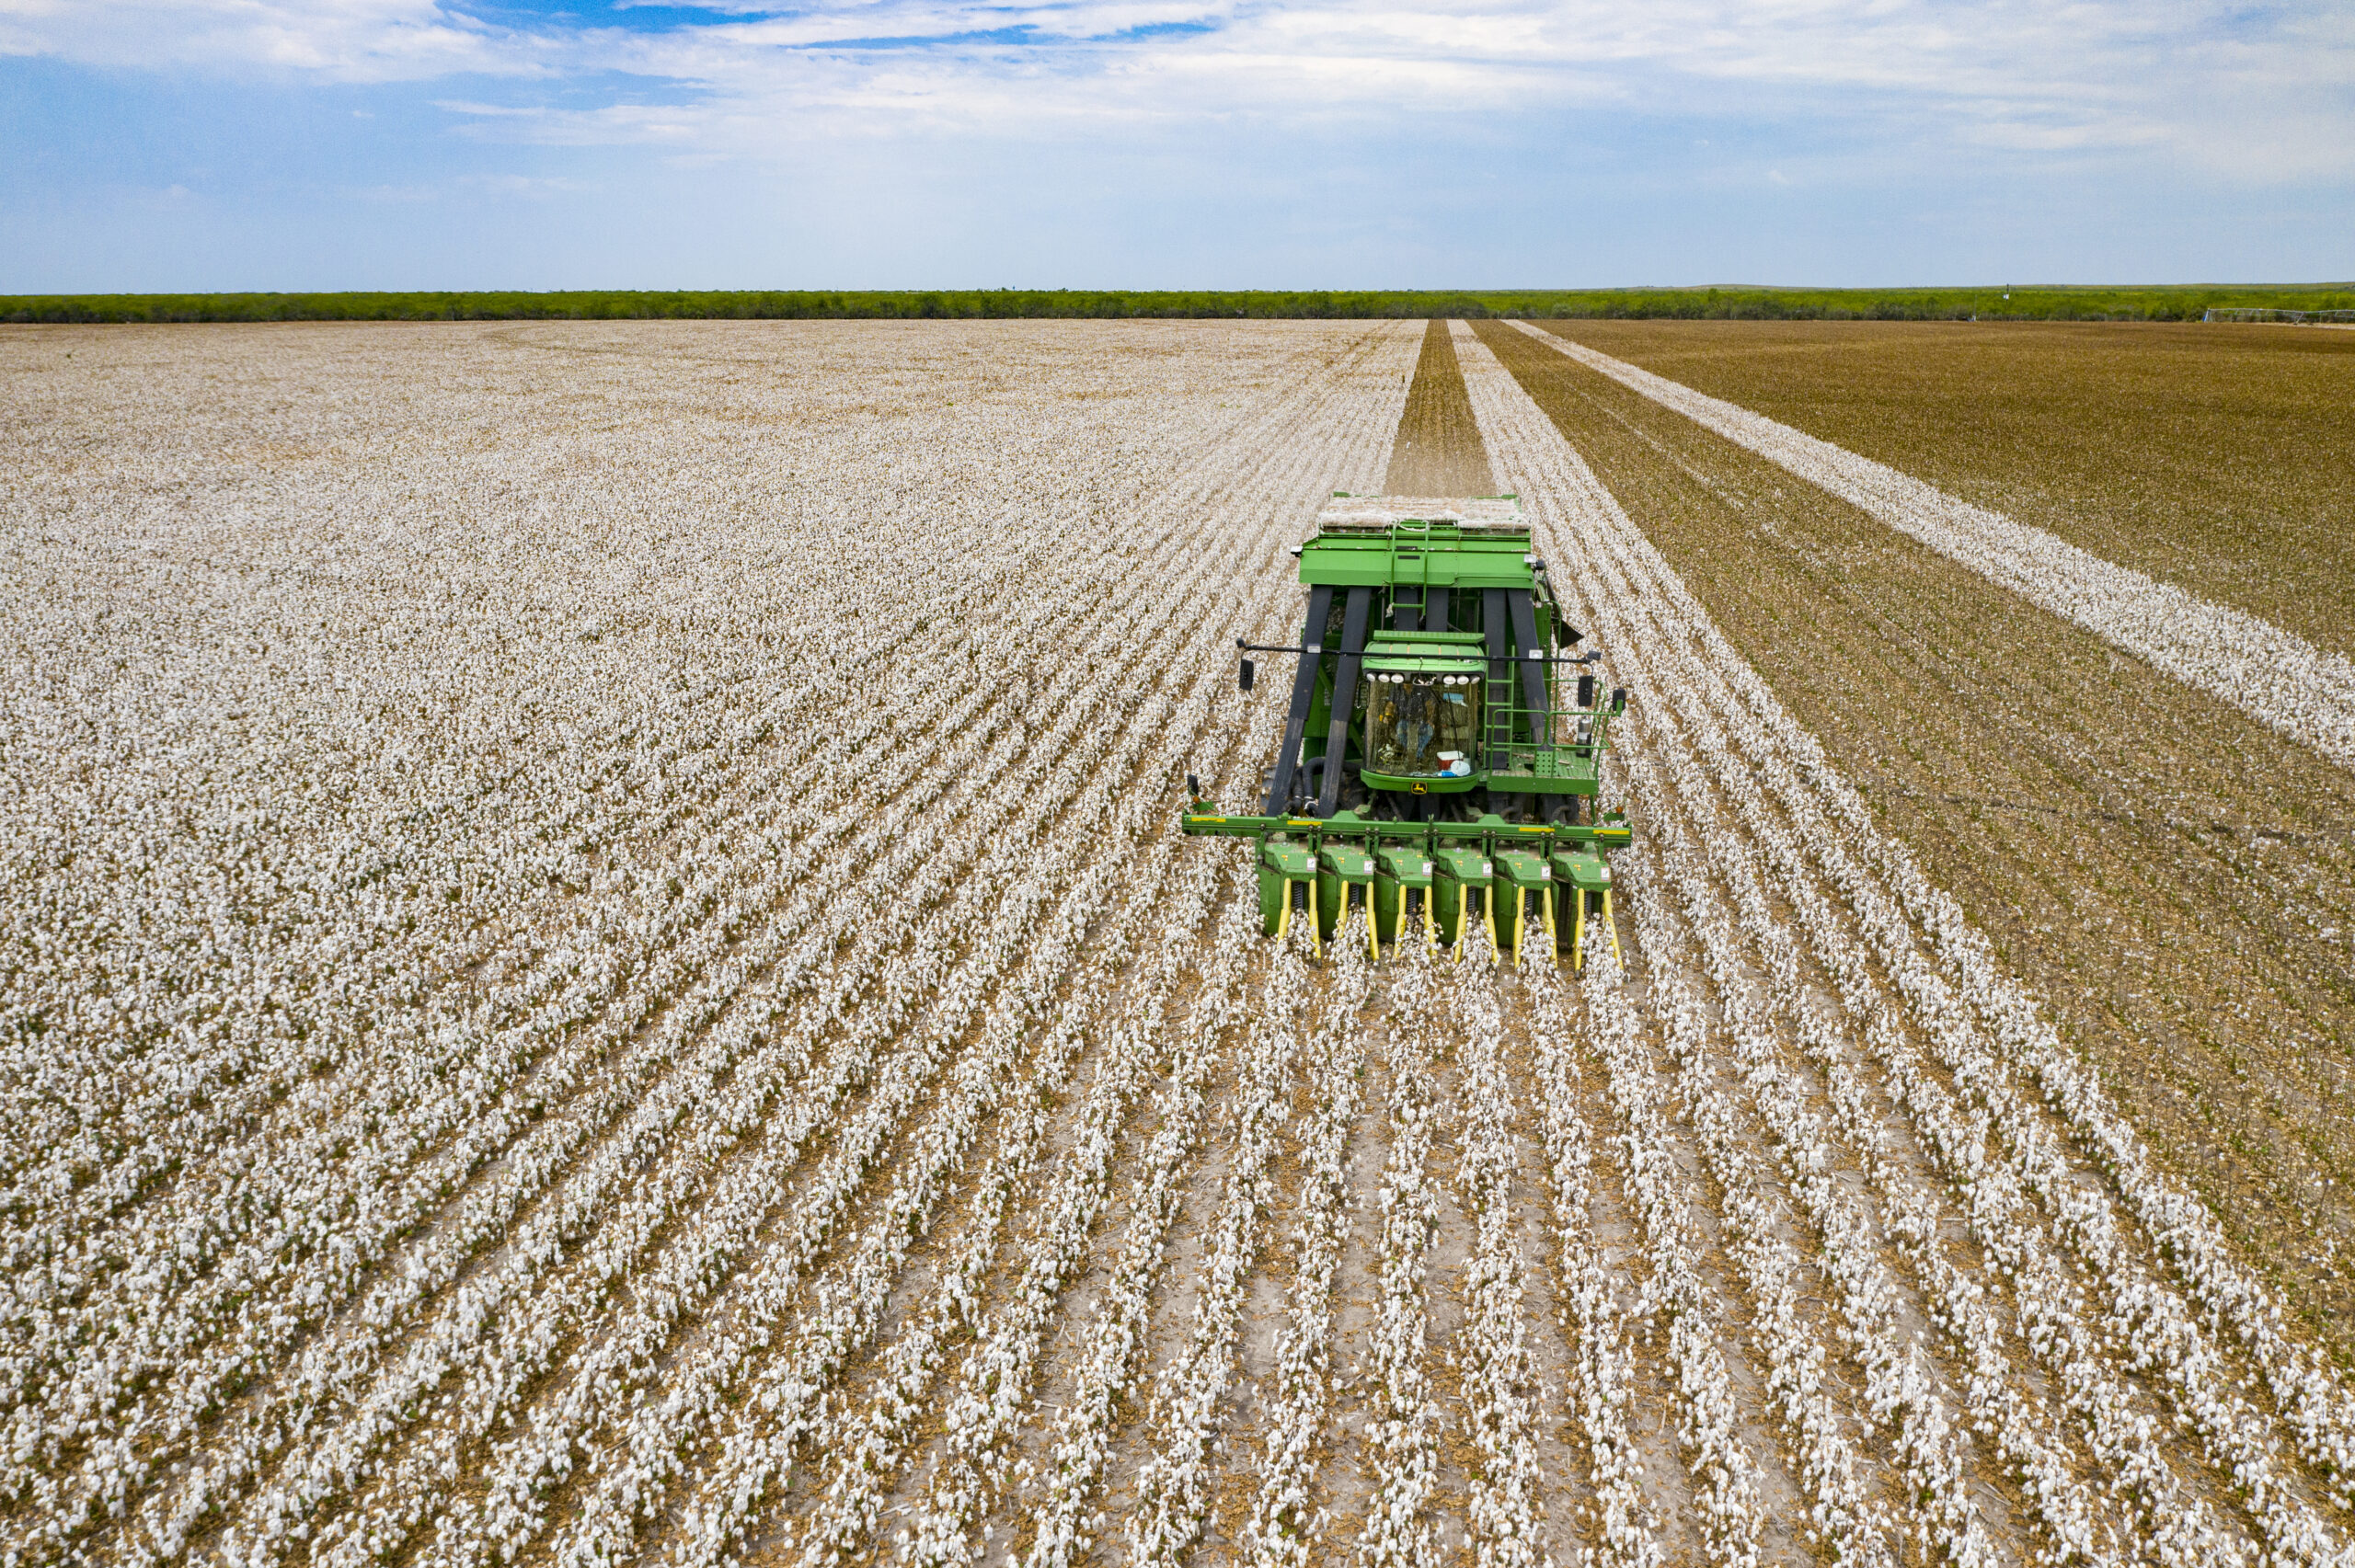
    Southern agriculture faces unique challenges, with limited crops that are both suitable and competitive in the region. Cotton, one of the major row crops in the Southern United States, has historically been favored for its drought resistance, making it well-suited to the region’s soil and weather conditions. Cotton is grown from Virginia to California across the southern U.S. In 2024, the U.S. is projected to produce 14.5 million bales of cotton.  While market prices are expected to be around $0.66 per pound (USDA WASDE), the value of cotton production is approximately $4.6 billion nationwide, underscoring its essential role in the Southern region.

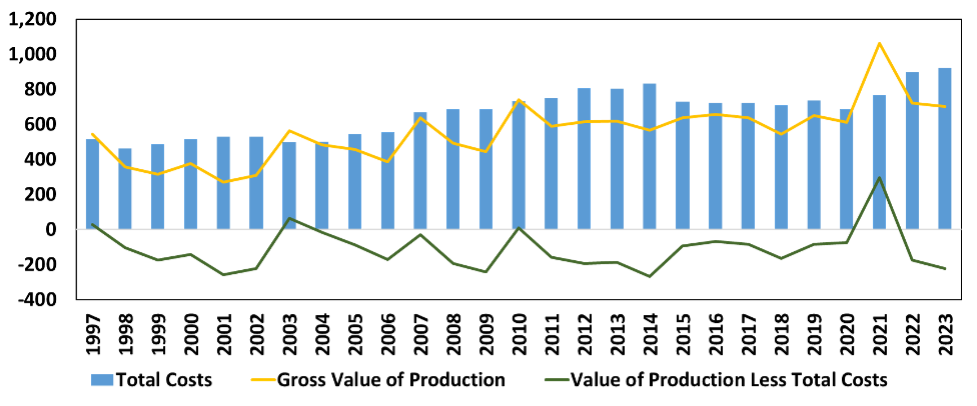
    Recent data from the USDA’s Economic Research Service highlights the complexities of cotton farming, showing that growers have faced financial challenges over the years. The data in Figure 1, covering the period from 1997 to 2023, highlight the ongoing profitability challenges Southern cotton farmers face. This data accounts for all costs incurred by participants in the production process, including farm operators, landlords, and contractors. The data reflects the actual production costs incurred by cotton farmers, including expenses for labor, equipment, and other inputs, as well as the revenue generated from cotton sales. However, these figures do not include government payments and crop insurance indemnities received by producers during this period. The government payments include traditional farm bill programs for farmers with base acres, as well as ad-hoc disaster relief programs. 

    In competitive commodity markets, where agricultural goods compete under perfect competition, economic theory suggests that profits attract more producers. This increase in supply drives prices down, eventually reducing profitability. Over time, long-term economic profitability tends to stabilize around zero, which becomes the level needed for economic sustainability for the industry. Producers are compelled to become more efficient in their operations to achieve profitability above this threshold. However, over the 27-year period, cotton only managed to exceed total production costs in four years. On average, cotton growers faced annual losses of $94 per acre, highlighting the crop’s ongoing struggle to cover production costs. 

    This consistent lack of profitability is unsustainable for cotton producers. Farmers’ inability to cover total costs, including fixed expenses like long-term asset depreciation for buildings and equipment, presents a serious risk to the agricultural future. Many farmers are increasingly relying on personal equity to keep their operations running, a practice that is financially unsustainable in the long term. As a result, many are turning to government support, including farm bill programs and disaster relief initiatives, which can provide a safety net during challenging times. 

    With long-term economic loss for cotton production, the economic health of Southern agriculture and the livelihoods of its farmers are at risk. If this issue is not addressed, it could result in a prolonged decline in agricultural production, eroding the economic foundation of farming communities across the Southern region.

    Figure 1. Cotton Production Total Costs, Revenue, and Returns for Producers in the United States (1997 – 2023).

    Data Source: U.S. Department of Agriculture (USDA) Economic Research Service (ERS), Commodity Costs and Returns for Cotton.

    References: 

    U.S. Department of Agriculture (USDA) Economic Research Service (ERS), Commodity Costs and Returns for Cotton, Updated on 10/1/2024.

    U.S. Department of Agriculture (USDA), World Agricultural Supply and Demand Estimates (WASDE), WASDE – 652, September 12, 2024. 


    Liu, Yangxuan. “The Long Term Economic Struggles of Southern Cotton Farmers.Southern Ag Today 4(44.1). October 28, 2024. Permalink

  • 2024 Agricultural Lending Condition Update

    2024 Agricultural Lending Condition Update

    According to the most recent estimates from the USDA ERS, the US agricultural sector is projected to experience a significant decline in profitability. Overall, current estimates indicate that net farm income in 2024 will be 6.8% lower than in 2023, a year that already saw a substantial drop compared to 2022. Expected cash receipts are anticipated to decline most sharply for corn, soybean, and cotton producers, with decreases ranging from 14% to 22% relative to last year. This suggests that some commodity producers will face increased financial pressure for the remainder of 2024 and possibly into early 2025.

    A recent survey of agricultural bankers supports this observation, indicating rising financial stress among agricultural producers. The Agricultural Credit Survey conducted by the Kansas City Fed reveals that more agricultural lenders are receiving requests for loan renewals and extensions, a sign that producers are struggling to meet loan interest and principal payments. However, beyond these requests, there is currently no clear evidence that financial pressures are translating into widespread farm financial distress. According to the Federal Reserve Economic Data (FRED), default rates on agricultural production loans and farmland loans have not shown significant increases in the latest survey.

    Source: FRED

    One contributing factor to the pressure felt by both agricultural producers and consumers is the rise in interest rates. Compared to the rates offered from 2020 to 2022, interest rates on farm production loans and farmland loans have increased sharply following a series of rate hikes by the Federal Reserve (the Fed) aimed at curbing rapidly rising inflation. As the Fed raised the federal funds rate—used as a benchmark for determining consumer loan interest rates—farm loan interest rates also rose, leading to greater pressure on repayment schedules. In the most recent survey of bankers in the Kansas City Federal district, the average farm production loan interest rate was 8.83%, and the farmland loan interest rate was 8.04%. In the same quarter of 2021, these rates were about 5.04% and 4.57% respectively. While 2020 or 2021 rates were very favorable rates in comparison to the long-term average, rapidly increasing interest rates in such a short period of time in 2022 could have put extra financial pressure on some producers who were not prepared for such rapid change.

    Source: Kansas City Fed, FRED

    However, as observed in September 2024, multiple reductions in interest rates are expected in the coming months and years. The Fed aims to lower the federal funds rate to 3.5% by the end of 2025 and to 3% by the end of 2026. Given that the pace of these rate reductions is expected to be slower than the hikes experienced in 2022 and 2023, the anticipated decreases in farm loan interest rates are also likely to be gradual.


    Kim, Kevin. “2024 Agricultural Lending Condition Update.Southern Ag Today 4(43.1). October 21, 2024. Permalink

  • When is an Hour of Operator Labor, Not Just an Hour of Operator Labor?

    When is an Hour of Operator Labor, Not Just an Hour of Operator Labor?

    As an Extension Economist, I regularly have the opportunity to talk about cow-calf profitability. I usually start with revenues, talking about calf prices and making assumptions about weaning weight and weaning rate. Then I walk through costs like winter feed (hay), pasture maintenance, breeding, vet/medicine, trucking, sale expenses, etc. While there is always room for discussion, most of these expenses can be estimated on a “per cow” basis by making some reasonable assumptions. At some point in the discussion, I bring up the topic of labor. Some cow-calf operations hire a significant amount of labor, but for a lot of these operations, the majority of labor is unpaid operator labor.

    The classic economist approach to valuing unpaid labor is to value it at its opportunity cost. By that, I mean if the farmer could be making $20 per hour doing something else, their labor on the farm should be valued at $20 per hour and be treated as an expense. On the surface, it’s hard to argue with this logic, but it is also not the way that most farmers think about the value of their time. For this reason, I tend not to treat labor as an expense but instead make the point that any return must be sufficient to adequately compensate the operator for the time they spend. This allows each individual in the room to evaluate whether that return is sufficient and place whatever value they feel is appropriate on their time.

    One danger of this approach is that it may encourage ignoring other expenses that often accompany operator labor. To illustrate this, consider two very different operator labor hours – an hour spent manually clearing fence rows and an hour spent on a tractor baling hay. A producer clearing fence rows may be using a set of loppers to cut small saplings, they may have a smaller set of clippers for briars and weeds, and they may even have a chainsaw they use on occasion when needed. An overly eager economist could talk about depreciation on that chainsaw and the other equipment, as well as the fuel being used when the chainsaw is operating, but clearly, these costs are pretty minimal. The point here is that the vast majority of the cost associated with an hour clearing fence rows is time.

    On the contrary, time is a much smaller portion of the total cost of an hour spent baling hay. Beyond the hour of labor, the producer baling hay is running both a tractor and hay baler. Fuel costs are much more significant, as is depreciation on both pieces of equipment. The same can be said of maintenance and repairs associated with the additional use of the equipment. Choosing not to place a value on an hour spent clearing fences is one thing, but not placing a value on time spent baling hay is very different. Obviously, I am describing two extremes here, but hopefully, it helps to illustrate the point I am making. Sometimes an hour of operator labor is not just an hour of operator labor, especially if there are a lot of other expenses being incurred during that hour.

    My experience has been that most farmers prefer time spent running machinery over time spent doing more manual labor. In fact, many producers would readily trade manual labor hours for more machinery hours. Cleaning out fence rows on a hot day is tough work, but the expense beyond the value of the time spent is minimal. Conversely, that same hour spent baling hay comes with a lot of additional expenses beyond the value of that time. The point is that choosing not to value operator labor is the choice of the farmer, but that farmer still needs to make sure they are valuing other costs incurred during those operator labor hours. Failing to do so has the potential to greatly underestimate the total costs for the operation.


    Burdine, Kenny. “When is an Hour of Operator Labor, Not Just an Hour of Operator Labor?Southern Ag Today 4(42.1). October 14, 2024. Permalink

  • Preparing For Your Preparer

    Preparing For Your Preparer

    This time of year is busy as summer comes to a close, children have returned to school, harvest is in full swing, and we anticipate busy days in the fall and winter months. Another item for your to-do list is meeting with your tax professional. This appointment is often scheduled for the early part of the year, but there can be advantages to carving out some time now. 

    One of the main advantages is that even though a large majority of the year has passed, there is opportunity for tax planning and management relative to where things currently stand. This allows you (or you and the preparer together) to determine what you would like to see happen by the end of the year. 

    If it is a lower-income year so far, consider making additional sales to generate revenue when your income tax rate is lower. This could include making sales of business assets you are considering disposing of as the depreciation recapture or possible capital gains treatment rates could be lower. For expenses, we often think about taking as much expense as possible, but if income is already low, it may be advantageous to save those expenses for another time period. This may mean using depreciation sparingly, not pre-paying farm expenses, or otherwise cutting back on discretionary farm expenditures.

    In times of high income, the opposite strategies would be appropriate. We may hold off on making additional sales during the year to slow down revenue recognition. This could include installment sales, deferred payment contracts, deferring any disaster payments, and holding off on selling any assets from the business. To lower our taxable income, we may look to recognize additional expenses through depreciation, pre-paid inputs, or otherwise try to find ways to re-invest in the business or take personal deductions. If high income still seems likely, Schedule J income averaging may be another tax planning opportunity for the farm.

    A tax preparer may also clean up your business’ accounting records. Generally, late fall would be a slower time for CPA and accounting firms, which may provide focused attention on your operation when things are not so hectic. Again, getting a clear picture of revenues and expenses at this stage can help with decision-making, tax or otherwise. For a preparer, clients who are easy to work with and make the business run smoother are going to receive better outcomes and better service. Likely, you have ideas or plans between now and the end of the year. Sharing those with your tax advisor can alert you to any possible negative tax outcomes. Too often, preparers get a call after the fact, making the accounting/tax work more difficult and more expensive for you. 

    Each year will be unique, with new challenges and new opportunities.  Spending a bit more time communicating with your preparer, especially before year-end, may pay dividends for all involved.  


    Burkett, Kevin. “Preparing For Your Preparer.” Southern Ag Today 4(41.1). October 7, 2024. Permalink

  • Increase in PRF Adoption in the Southern Region

    Increase in PRF Adoption in the Southern Region

    In recent years, drought has been a common occurrence in many Southern states, including Texas, Oklahoma, Louisiana, Arkansas, Mississippi, Alabama, Florida, Georgia, South Carolina, North Carolina, Virginia, Maryland, Tennessee, and Kentucky. The U.S. Drought Monitor reported that approximately 65% of this area was experiencing some level of drought as of September 24, 2024 (Fig 1).  Producers are increasingly adopting the USDA’s Pasture, Rangeland, and Forage Insurance (PRF), recognizing its crucial role in supporting ranchers during these challenging times.

    Figure 1. U.S. Drought Monitor, Southern Region 9-24-24

    The PRF program was established in 2007 to help livestock and forage producers mitigate the risks associated with forage loss due to lower precipitation. The program is available in 48 states and covers over 247 million acres. The severity of droughts and the effectiveness of PRF have led to an increasing adoption of this risk management tool each year. According to the latest data, the average indemnity payment since 2011 from the region was similar to total premiums paid. During the droughts of 2021, 2022, and 2023, the indemnities paid were 14%, 69%, and 17% higher than the total premium paid, totaling $2.372 billion in indemnities versus $1.776 billion in total premiums during those three years. (Fig 2)

    In the Southern Region, the adoption of this program has more than doubled since its inception, with enrolled acres increasing from 20.8 million in the first year to approximately 49.8 million in 2024. With its vast area of open rangeland, Texas dominates PRF acreage enrollment, followed by Oklahoma and Florida.  These three states have seen significant increases in the adoption of PRF insurance, with Texas enrolling 42.8 million acres in 2024 (a 191% increase from 2011), Oklahoma enrolling around 4 million acres (a 1,491% increase from 2011), and Florida insuring 2.4 million acres in 2024 (a 344% increase from 2011). The other Southern Region states have also seen substantial increases in insured acres, indicating the growing recognition of the program’s benefits (739% increase from 2011). (Fig 3). For more information on PRF, consult the USDA Fact Sheet. If you’re considering purchasing this insurance, you can find a list of approved agents and insurance companies on the USDA website.

    Figure 2. PRF Premiums Paid by Farmers vs Indemnities Received in the Southern States (*2024 Partial Results)

    Figure 3. PRF Enrolled Acres in the Southern Region


    Abello, Pancho. “Increase in PRF Adoption in the Southern Region.Southern Ag Today 4(40.1). September 30, 2024. Permalink