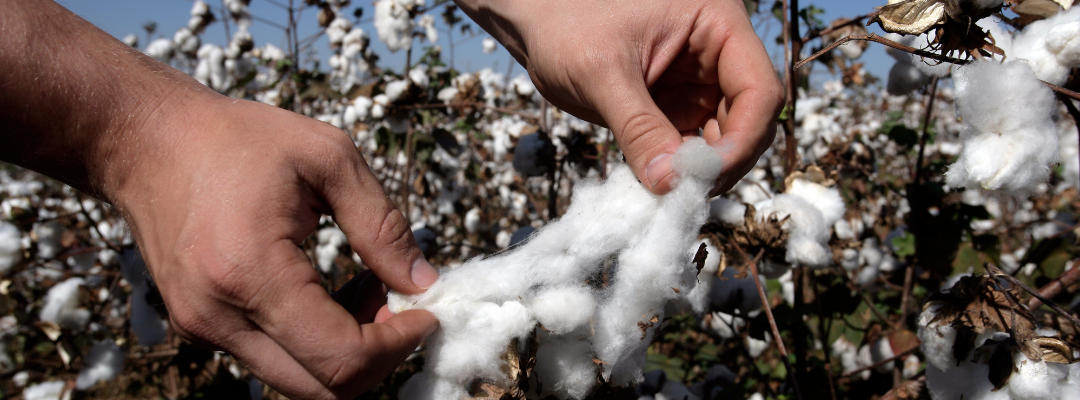
We have written previously about foreign investment in U.S. ag land (found here). That article stated that there is currently no federal law that prohibits the ownership of private agricultural land by foreign persons or entities. The federal government’s only involvement is monitoring land acquisitions and recording information on those purchases through the passage of the Agricultural Foreign Investment Disclosure Act of 1978 (AFIDA). Under AFIDA, qualifying foreign entities who buy or sell an interest in agricultural land are required to report the transaction within 90 days of acquiring the land or face a monetary penalty.
Foreign ownership or leasing of U.S. agricultural land increased by 2.4 million acres in 2020 (USDA- FSA 2021). However, that acreage represents a relatively small proportion of the overall base of U.S. farmland and timberland. The total amount of U.S. cropland, pasture, and forest with foreign ownership or leasing interest in 2020 was 37.6 million acres, which represents about 2.9% of all privately held U.S. agricultural land. It is worth noting that AFIDA requires reporting of ownership and partial ownership in U.S.agricultural land by a foreign investor, as well as leaseholds of 10 years or more. In other words, foreign investments in U.S. land covered by AFIDA include both foreign ownership and leasing. Current AFIDA regulations exempt foreign investors from the reporting requirement if their lease of agricultural land is less than 10 years. As of 2020, over half of the transactions by foreign buyers holding U.S. agricultural land are via long-term leases, covering more than 30% of acres held by foreign entities and reported under AFIDA. For the past decade (2011 to 2020), that trend has shifted and long-term leases are even more important, as they account for 60% of the growth in foreign controlled acres and more than 70% of all transactions reported under AFIDA.
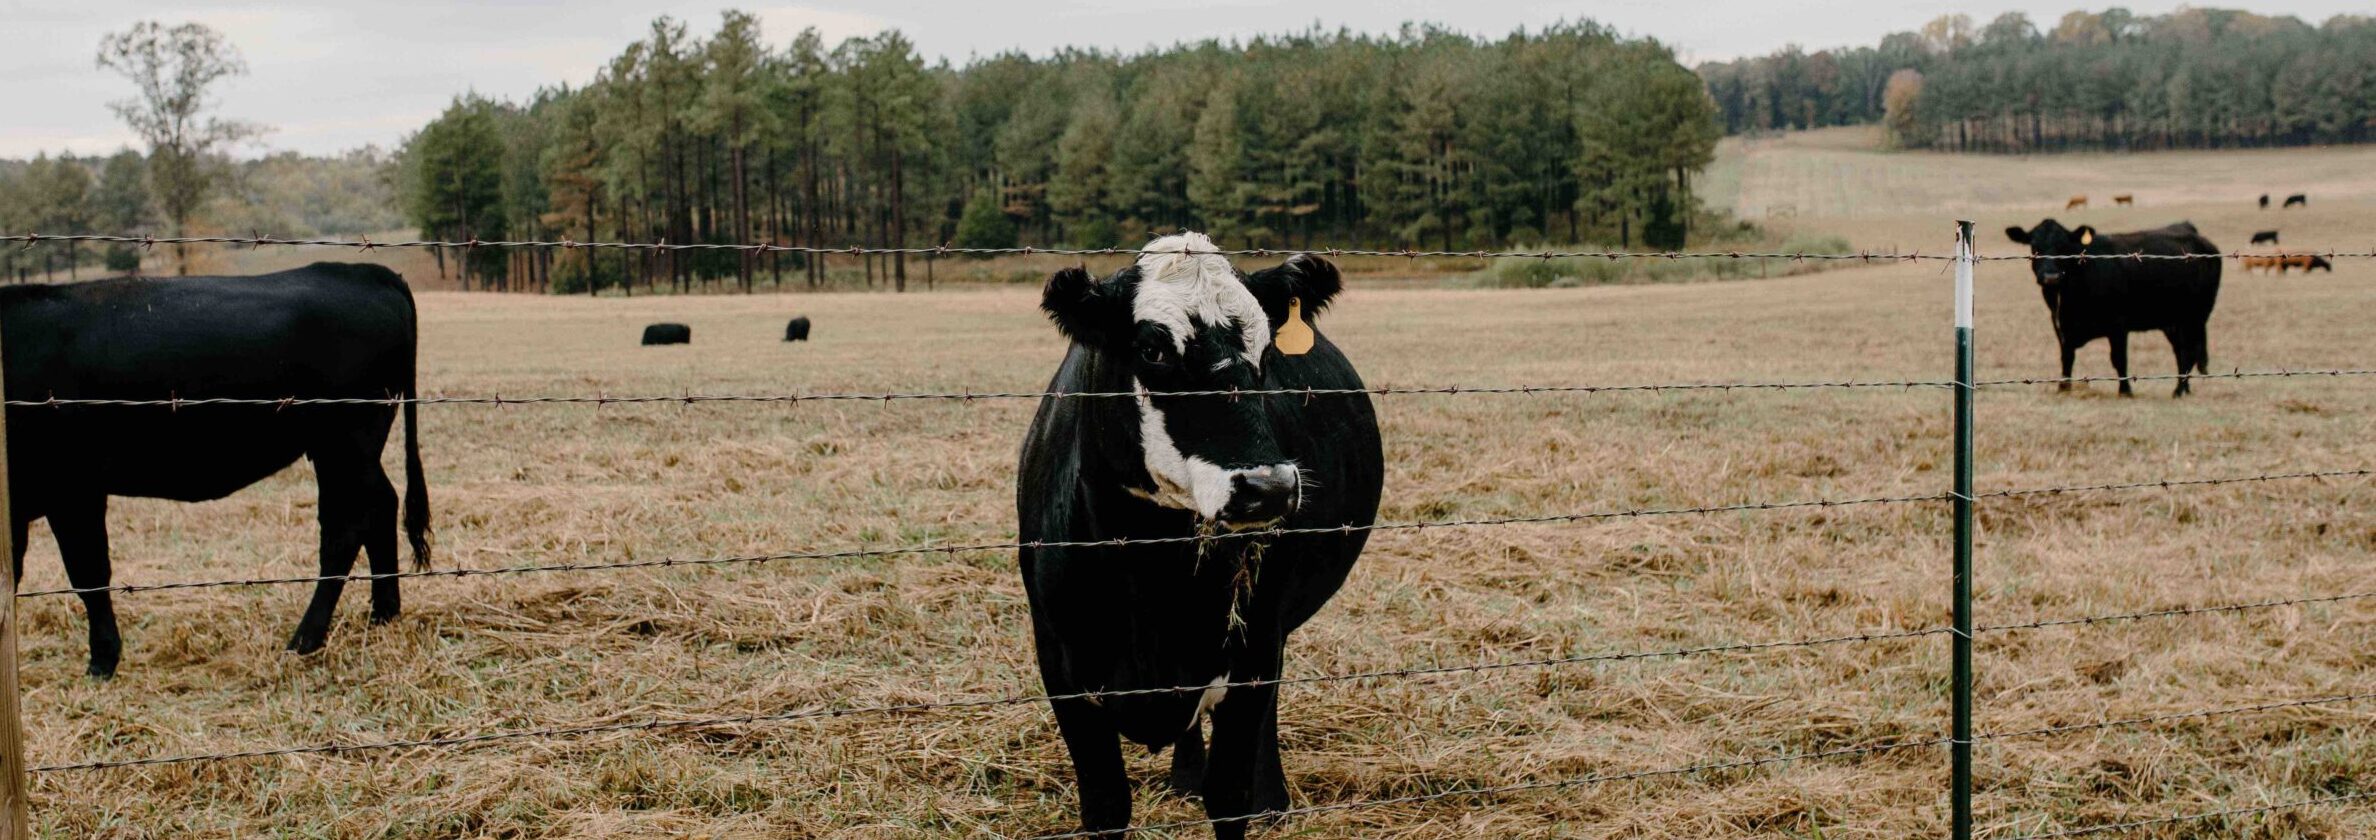
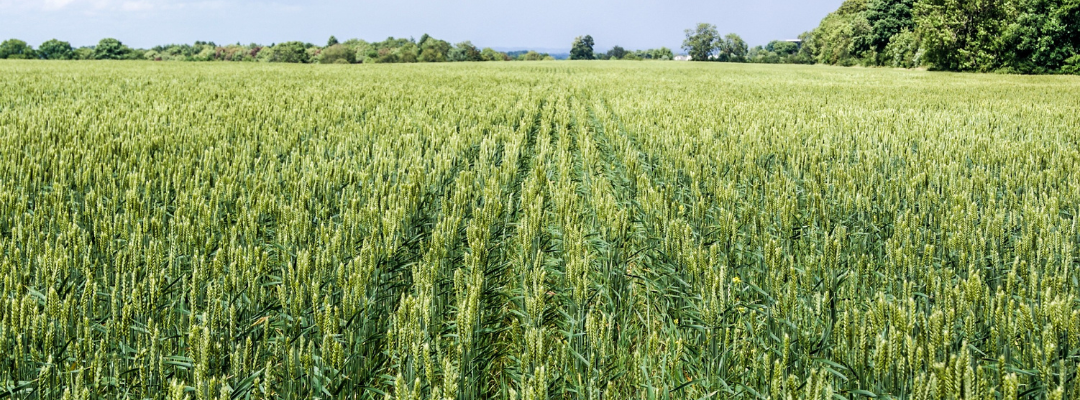
In 2020, 62% of foreign land investments in acres reported under AFIDA, which includes cropland, pasture, and forest, fell into the category of ownership, while 32% fell into the long-term lease category. The remaining 6% of land investments include the land categories of life estates, trust beneficiary, partially owned, and purchase contracts. This growth in leasing relative to ownership over the past 10 years manifests in the cropland category more than in the pasture, forest, or other agricultural land classifications. Figure 1a shows that foreign-owned agricultural land represents the majority of all foreign-held U.S. agricultural land. However, figure 1b, which measures only the cropland category of land, shows the percentage of cropland owned versus leased. The balance of owned versus leased prior to 2013 was majority owned, but after 2013 the majority of foreign interest in U.S. cropland was leased. By 2020, ownership accounted for 26% of foreign land holdings of U.S. cropland, while 71% fell under long-term (greater than 10 years) leases. In other words, most additional foreign acquisitions of U.S. cropland in recent years have been through long-term leases, which more than tripled from 2010 to 2020. Foreign-held forestland, on the other hand, does not follow this pattern—ownership accounts for 89% of foreign holdings, and long-term leases account for 4% of all forestland held by foreign entities, with the residual percentage falling in the other categories mentioned previously.
The overall trend in cropland acquisition by foreign entities using long-term leases rather than ownership suggests possible different motivations for cropland relative to pasture or forestland. Buyer or lessor intentions, however, are not included in the data collected by AFIDA.
Figure 1. Cumulative foreign interest in U.S. agricultural land and cropland, 2000–2020.


For more information on this topic please see:
Mykel R. Taylor, Wendong Zhang, and Festus Attah. 2023. “Foreign Interests in U.S. Agricultural Lands: The Missing Conversations about Leasing.” Forthcoming at Choices Magazine. Available at https://www.card.iastate.edu/products/publications/pdf/23pb40.pdf
Taylor, Mykel, Wending Zhang, and Festus Attah. “Foreign Investment in U.S. Agricultural Land: Leasing vs. Owning.” Southern Ag Today 4(5.3). January 31, 2024. Permalink