The Land Grant University System has a historic tradition of the combined missions of teaching, research, and extension. In fact, Southern Ag Today was born out of a collaboration of Extension Economists across the Southern region. The Old Rotation at Auburn, is a great example of Land Grant history and continued relevance. As cited from the National Register of Historic Places, January 14, 1988:
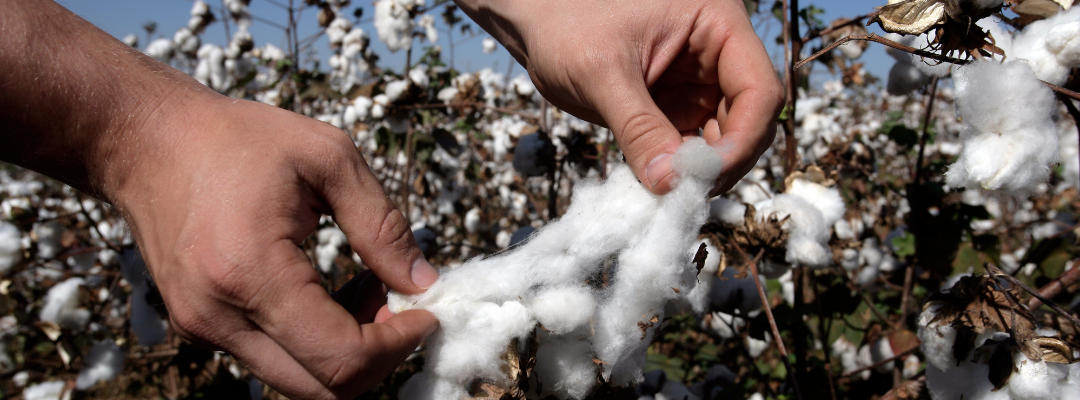
The Old Rotation.
Established in 1896 by Professor J.F. Duggar, the Old Rotation at Auburn University is:
The oldest, continuous cotton experiment in the U.S.
The 3rd oldest continuous field crop experiment in the U.S.
The 1st experiment to demonstrate the benefits of rotating cotton with other crops to improve yields and utilize nitrogen-restoring legumes in a cotton-production system. It continues to document the long-term effect of these rotations in the same soil.
The Old Rotation has had 128 years of cotton planted in the same soil and provides valuable insight into cover crops and crop rotation, and one of the original objectives of utilizing legume cover crops is significant today.
Table 1 shows yields from 1896 through 2023 from plot # 6 and plot # 8 (there are a total of 13 plots with different treatments). Plot # 6 has been planted to continuous cotton with no additional Nitrogen (N) fertilizer and no cover crop. Plot # 8 was also planted in continuous cotton with no added N, but included a winter legume cover crop consisting of crimson clover and hairy vetch. The plots have otherwise been treated the same over the research period. It is also important to note that these are non-irrigated plots; there are years with very low or no yields; and the yields have increased significantly due to improved management practices and genetics.
The yield difference over the last 100 years is clear and substantial. However, the yields between 1896 and 1921 were virtually the same, so it took some time for the net benefit of the practice to accumulate. Much has changed about cotton production in 128 years, but the history of The Old Rotation suggests the reasonable conclusion that good soil and fertility management (or the lack of) is a long term game.
With more emphasis on improving soil health and reducing fertilizer costs in the Southern region, looking at long term research helps to provide solutions.
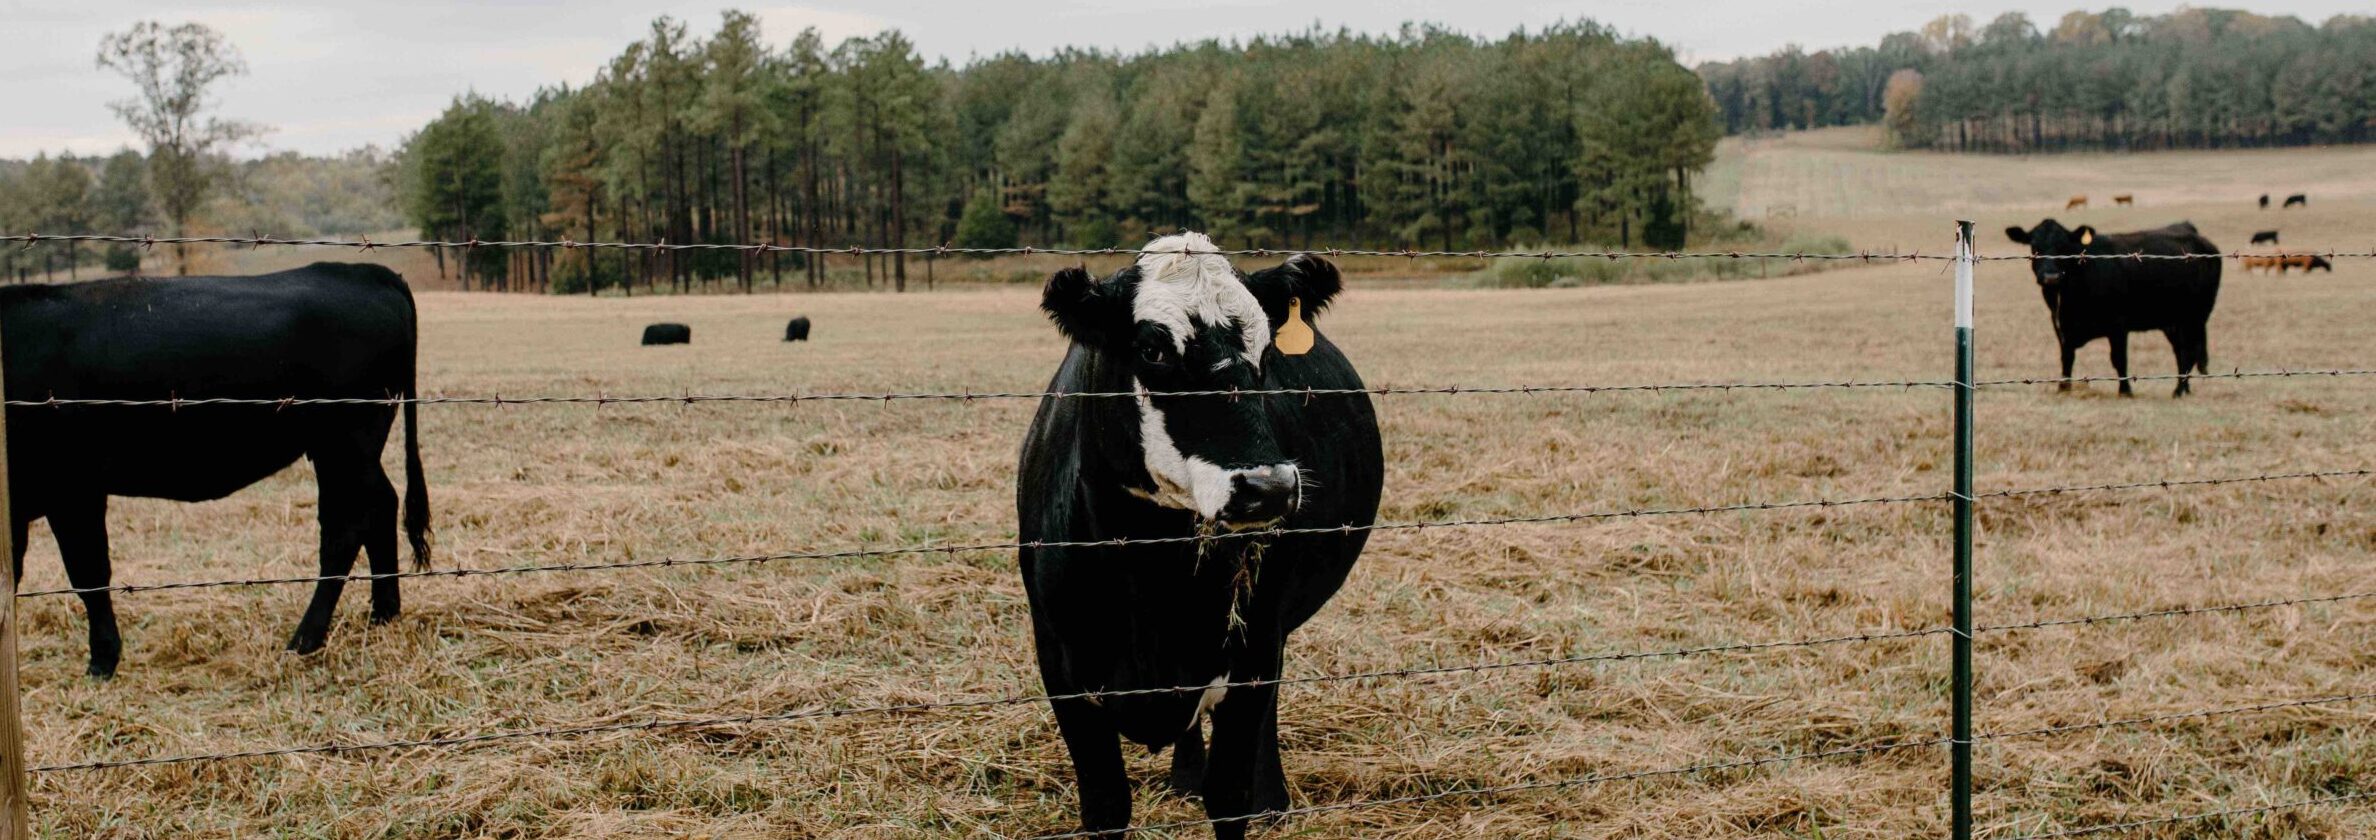
Artificial Insemination (AI) is a useful tool that cattle producers can use to help their operation. It offers many advantages to natural service that may benefit even small producers. One major advantage of this technology is that it allows access to superior genetics at a reduced cost compared to natural service. A producer can get access to top-of-the-line genetics without having to spend thousands of dollars on a top-of-the-line bull. AI also allows for more selective breeding where a producer can select for increased calving ease, milk production, heavier weaning weights, etc. This technology has been shown to improve conception rates and shorten the calving interval (Anderson & Deaton 2003; Rodgers et al., 2012). This means that AI can be used to increase a producer’s cow herd genetics through replacement heifers. They can also increase herd uniformity, which could lead to better group marketing opportunities and higher prices received.
Despite these benefits, adoption of AI has been relatively low, with only 11.6% of beef cattle operations using this technology. However, like with many technologies, larger producers were more likely to use this technology, with 29.4% of operations with 200 or more head using AI compared to 8.7% of operations with only 1-49 head (USDA APHIS 2017). The major barrier to adopting AI is the increased management and labor requirements. An AI program is going to take significantly more work than natural service. It also has added costs of drugs, semen, and requires additional handling facilities. Furthermore, there are some knowledge barriers that producers need to overcome to use AI effectively.
The question then is, does AI pay? In typical economist fashion, the answer is: it depends. The factors that impact the profitability of AI are:
Herd Size
Larger herds tend to see more profit benefit from AI.
Cow-to-bull ratio
A lower cow-to-bull ratio will produce higher returns to switching to AI.
How are the calves marketed?
The more premium for better genetics, performance, and uniformity you can capture, the better off you will be with AI.
How much is your time worth?
The more valuable your time, the more expensive the increased management and labor costs become, and AI becomes less profitable.
AI programs will vary in labor intensity.
As with any farm decision, the most economical choice is not going to be the same for everyone. It is important to evaluate your options to determine what is best for your farm. One way to do this is to construct a partial budget. A partial budget is a way of evaluating two different decisions to determine which will be more profitable. It does this by comparing the associated costs and revenues of a choice with the associated costs and revenues of another choice. It only looks at the difference between the two options. For example, it can be used to compare the returns and costs of AI to that of natural service, as seen in Table 1. In this example, a herd with 115 head would increase net returns by $9.87/exposed cow by switching to AI. This is dependent on several factors, including the price received for the cattle, the costs of the drugs, semen, technician, and labor, and the price of the cull bull maintenance and sale. For a more detailed explanation of the numbers and assumptions used in Table 1 please see: http://extension.msstate.edu/publications/economic-impact-artificial-insemination-vs-natural-mating-for-beef-cattle-herds. Also, it should be noted that improved herd genetics is going to have benefits over time. This means that the value of AI likely increases when considering more years. But it is important to do these comparisons yourself to determine if AI is right for you.
References
Anderson, L., & Deaton, P. (2003). Economics of estrus synchronization and artificial insemination. Proc., Beef Improvement Fed, 15-19.
Rodgers, J. C., Bird, S. L., Larson, J. E., Dilorenzo, N., Dahlen, C. R., DiCostanzo, A., & Lamb, G.C. (2012). An economic evaluation of estrous synchronization and timed artificial insemination in suckled beef cows, Journal of Animal Science, Volume 90, Issue 11, 4055–4062, https://doi.org/10.2527/jas.2011-4836
As we move further into fall, winter feeding will move into the forefront of cow-calf operators’ minds. Most cow-calf operations have already begun feeding hay or will do so very soon. Winter feed costs are likely the largest cost for a cow-calf operation and are impacted by the number of days an operation feeds hay, the cost of the hay (or other feeds) that is fed, and the efficiency of the feeding program.
The number of winter feeding days is largely a function of stocking rate and pasture conditions throughout the grazing season. At the national level, the percentage of pasture rated poor and very poor has been lower than last year, but higher than the average of the previous 5-year period. In the Southeast, pastures are generally in worse condition than last year and considerably worse than the 2017-2021 average. In my home state of Kentucky, a lot of cow-calf operations have been feeding hay for a while and will see a higher than normal number of feeding days this winter.
Hay values are not always easy to estimate because most operations produce their own hay. Much of the hay market consists of private transactions, so there is limited public data on market price. Hay is also unique in the sense that there can be wide ranges in quality, as well as, value across regions due to the high costs associated with moving hay from one area to another. For these reasons, producers really have to put a value on the hay they feed based on what it cost them to produce it or what they paid for it, if purchased.
Finally, feeding efficiency is sometimes the forgotten factor in winter feed costs because it can be hard to observe and quantify. There is always a loss associated with feeding as cattle don’t utilize 100% of the hay that is produced or purchased. This is typically a function of hay storage and feeding method and there is merit in looking for economical ways to limit losses at these two points.
I use the table below in Extension programs as a way to discuss the variation in winter feeding costs based on hay values and losses associated with storage and feeding. Costs are expressed on a daily basis with the assumption of a 1,300 lb cow consuming 2.25% of her body weight each day. The number of hay feeding days can be multiplied by the daily costs to estimate hay cost per cow through the winter.
Over the last couple of years, hay values in my area have seemed to shift from the left half of the table to the right half and that has had a significant impact on the cost of wintering cows. For illustration, a $20 per ton increase in hay value leads to an increase of $0.34 per day at the 15% loss level and increases at higher loss levels. Similarly reducing storage and feeding losses from 30% to 15% results in a savings of $0.37 per cow per day when hay is valued at $100 per ton and increases as hay becomes more valuable. Having a feel for winter feeding costs can be a crucial first step in understanding cow-calf profitability and is definitely something that cow-calf operators should seek to manage.
The South-wide average pine sawtimber stumpage price has held steady during the third quarter of 2023, showing no significant fluctuations when compared to the levels observed in the previous four quarters. Pine sawtimber prices in the region averaged $25.98/ton. ranging from approximately $20/ton in Virginia to $32/ton in Florida (TimberMart-South, 2023). The figure was roughly $2/ton lower than the recent high in early 2022 but remained $2/ton above the pre-pandemic level. South-wide average hardwood sawtimber price rebounded slightly to $32.39/ton after three consecutive quarters of decline.
The recent decline in pine sawtimber prices can be attributed primarily to the softened demand for lumber. Pine sawtimber prices had a rally from mid-2020 to early 2022, primarily driven by robust demand for lumber. However, factors such as rising interest and mortgage rates, deteriorated housing affordability, and worries of an economic slowdown have cooled the general housing market since then. Single-family housing starts —a major driver for lumber and structural panel products— in September were at a seasonally adjusted annual rate of 963,000 units, falling below the long-term average of 1.1 million units.
The South-wide average stumpage prices for both pine pulpwood and hardwood pulpwood fell sharply over the past four quarters. Pine pulpwood stumpage prices averaged $7.59/ton in the third quarter of 2023. This represented a significant 21% year-over-year decline and a substantial 31% drop from the recent high recorded in early 2022. The decrease in wood fiber prices can be attributed to several factors, including the product shift in the paper sector, a rise in the utilization of recycled fiber, and a surge in the supply of mill residues resulting from recent expansions in lumber mills. The decline was even more pronounced in certain timber regions (e.g., South Carolina and Western North Carolina) due to the recent closure of paper mills.
The average delivered prices for sawtimber and pulpwood products fared relatively better than their stumpages prices, with only slight year-over-year declines in the range of 2% to 5%. Notably, the gap between delivered and stumpage prices for all timber products has significantly widened since 2020. The widening gap can be attributed to multiple factors, including inflation in fuel and material prices. Furthermore, the persistent decline in the logging crew of the region has played a significant role in the margin increase. Employment in the logging industry dropped 34% from 38,200 in 2000 to 25,300 in 2022 (U.S. Census Bureau, 2023). While improvements in productivity have helped mitigate some of the losses, this ongoing downward trend has left a lasting impact on the industry and the delivered prices.
Looking forward, pine sawtimber prices in the South are expected to continue its slow recovery from the 2008-2009 recession, driven by the anticipated growth in single-family housing starts and the expanding lumber production in the region. The historical low in existing housing inventory, coupled with homeowners maintaining their properties with low-rate financing, highlights the pressing need for the expansion of the new housing market in the foreseeable future.
Softwood lumber production capacity in the South has increased 25% since 2017 and reached 26.9 billion board feet (bbf) in 2022 (Forisk, 2022a). Announced greenfield construction and existing mill expansion suggest that the capacity could reach 28.5 bbf by 2025 (TimberMart-South, 2023; Forisk, 2022b). However, the 10-year accumulation of underbuilding and the resulting oversupply of sawtimber will likely continue to put downward pressure on pine sawtimber prices. Pine pulpwood prices are likely to remain flat or trend lower as lumber production increases and the structure change in the paper sector continues.
It is important to note that timber markets are largely local. Timber prices for a specific timber stand are influenced by various factors, including the timber species, quality and size of the trees, site accessibility, local timber inventory, mill types and capacities, logging capabilities, transportation capacity, and many other local considerations.
References
Forisk. 2022a. Forisk North American forest industry capacity database.
Forisk. 2022b. Forisk Research Quarterly: Fourth Quarter 2022.
Using crop insurance to guarantee debt obligation coverage is one of many ways insurance can be used as a risk management tool. Additionally, adequate crop insurance will often be a lender requirement on operating loans. Operating loans are typically revolving lines of credit that assist in covering pre-harvest expenses (e.g., seed cost, fertilizer, fuel, etc.). Table 1 below contains example revenue and pre-harvest expenses that might be incurred by a soybean and cotton producer in the southern region. Assume an example soybean producer in Crittenden County, Arkansas and a cotton producer in Lubbock County, Texas, where the farm-level soybean and cotton Actual Production History (APH) yields are equal to the state average of 50 bushels per acre and 1,196 pounds per acre, respectively. Furthermore, we assume the Projected Price for the 2024 growing season to be $12.60 per bushel for soybeans and $0.87 per pound for cotton.
Table 1. Simplified Sample Budget for a Southern Soybean and Cotton Producer
Revenue
Soybean
Cotton
APH Yield
Per Acre
50
1,196
Projected Price (USDA-RMA)
$12.60/bu
$0.87/lb
Expected Revenue (446 Acres)
$280,980.00
$464,072.00
Pre-Harvest Expenses
Expected Pre-Harvest Expenses (446 Acres)
$144,058.00
$247,084.00
446-acre farm size was derived from Farms and Land in Farms, February 2023 Summary. Pre-harvest expenses are derived from budgets across the southern region.
Consider a producer who finances an operating loan to cover their pre-harvest expenses (e.g., $145,000 based on a 446-acre soybean operation). Additionally, they elect to use Revenue Protection (RP) crop insurance to guarantee a level of revenue. For example, at a coverage level of 50%, a soybean producer would be guaranteed $140,490 based on an expected revenue of $280,980 ($280,980 * 0.50 = $140,490). The question becomes, at what level will the RP guarantee cover the entire operating loan obligation in the case of a complete loss? Additionally, we consider a producer taking Catastrophic Risk Protection Endorsement (CAT) coverage that triggers in the event of a yield loss of 50% or more. CAT coverage provides producers with low-cost coverage on 50% of APH yield and 55% of the RMA projected price (Biram and Coble, 2023). We assume total yield loss (e.g., 0 bushels per acre). Tables 2 and 3 below highlight realized returns to a soybean and cotton producer net of their operating loan obligation. Returns are compared over an interest rate range of 5% to 10% (.5% increments), and RP elected coverage levels from 50% to 65% (5% increments).
*Note: CAT coverage levels based on data in Table 1 for yield and projected price are 25 bushels and $6.93, respectively. CAT coverage administrative fees are $655.00 for each crop per county. Per acre RP premiums for Crittenden County, Arkansas Soybeans are $7.20, $9.06, $10.51, and $13.87 for 50%, 55%, 60%, and 65% coverage levels, respectively.
If the dollar value within Tables 2 and 3 is positive, then operating loan debt is covered with additional funds to pay other obligations. If the amount is negative, a producer would be unable to re-pay their entire operating loan only using RP or CAT indemnities. It’s important to note that pre-harvest expenses are only an estimate. We assume an annual interest rate with the producer paying the operating loan in one lump-sum at the end of harvest; that is, if the annual interest rate is 5% and payment is made at the end of harvest (assuming 9 months) with an operating loan of $145,000, the final payment will be $150,529 (principal plus $5,529 accrued interest).
Crop type plays an important role in this decision since positive cash flow is heavily dependent on coverage levels and operating loan interest rates for a specific crop. Also, under no circumstance does CAT coverage ensure either producer can cover their operating loan debt at the representative loan, farm size, and crop type. Tables 2 and 3 show that operating debt coverage based on a 50% RP coverage level will be negative regardless of crop type. Increasing coverage to 60% would mean a soybean producer could guarantee covering their operating loan, while a cotton producer needs at least 65% coverage to guarantee operating debt repayment in the event of a catastrophic loss.
References
Biram, H.D. & Coble, K. H. (2023). A Brief History of Crop Insurance. University of Arkansas System Division of Agriculture, Cooperative Extension Service Fact Sheet No. FSA70. (Link)