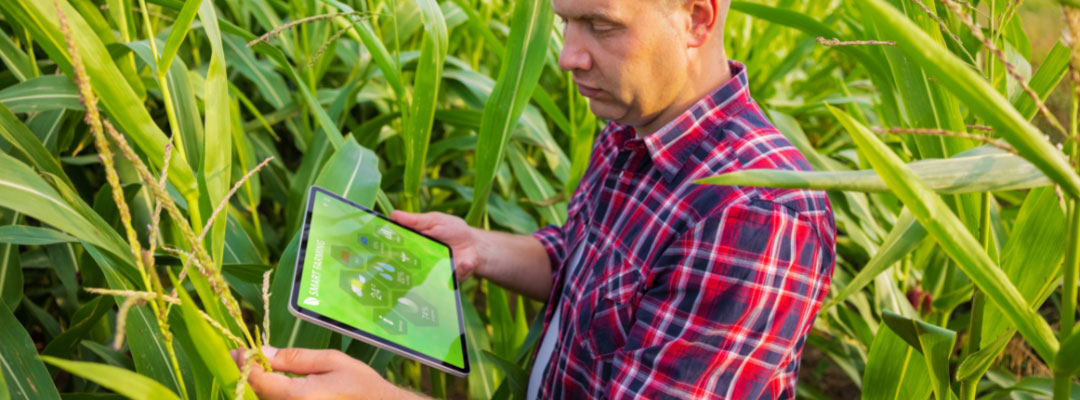
Have you ever found yourself wishing there was an app for something while using your smartphone? You’re not the only one. The development of mobile apps for various needs is happening at a rapid pace. Why? According to comScore, 89% of all mobile minutes are spent on mobile apps. The top two categories for mobile app users are social media and news/information. In agriculture, there are mobile apps available that deal with an array of topics. CropLife puts out a list of the best agriculture apps every year. The majority of those mobile apps, and the most popular, are often agronomic or weather related. In the economic space, most of the available apps provide pricing information for marketing. However, there are a host of available apps that can assist with farm management.
I often get asked, “What is the best farm management app out there?” My colleague had the best answer to that question, “the best farm management app for farmers is the one that you will actually use!” Each app serves a different purpose and provides a different user experience. We’ve recently created an extension publication that outlines all of the mobile apps we could find that help farm management and their availability on Apple or Google smartphones (publication found here). If you want a more detailed description of each app, you can find it here. I encourage you to download several apps and try them to see which works best for your specific situation or need.
Agriculture is considered a stressful profession, not just because of the complexity of decisions that must be made to successfully run a farm or ranch operation but primarily because there is uncertainty. Whenever uncertainty is involved in the farm business, risks must be taken.
There are five main areas of risk in agriculture: production, marketing, financial, legal, and human. The ability to identify risks in agriculture is the first step in managing those risks.
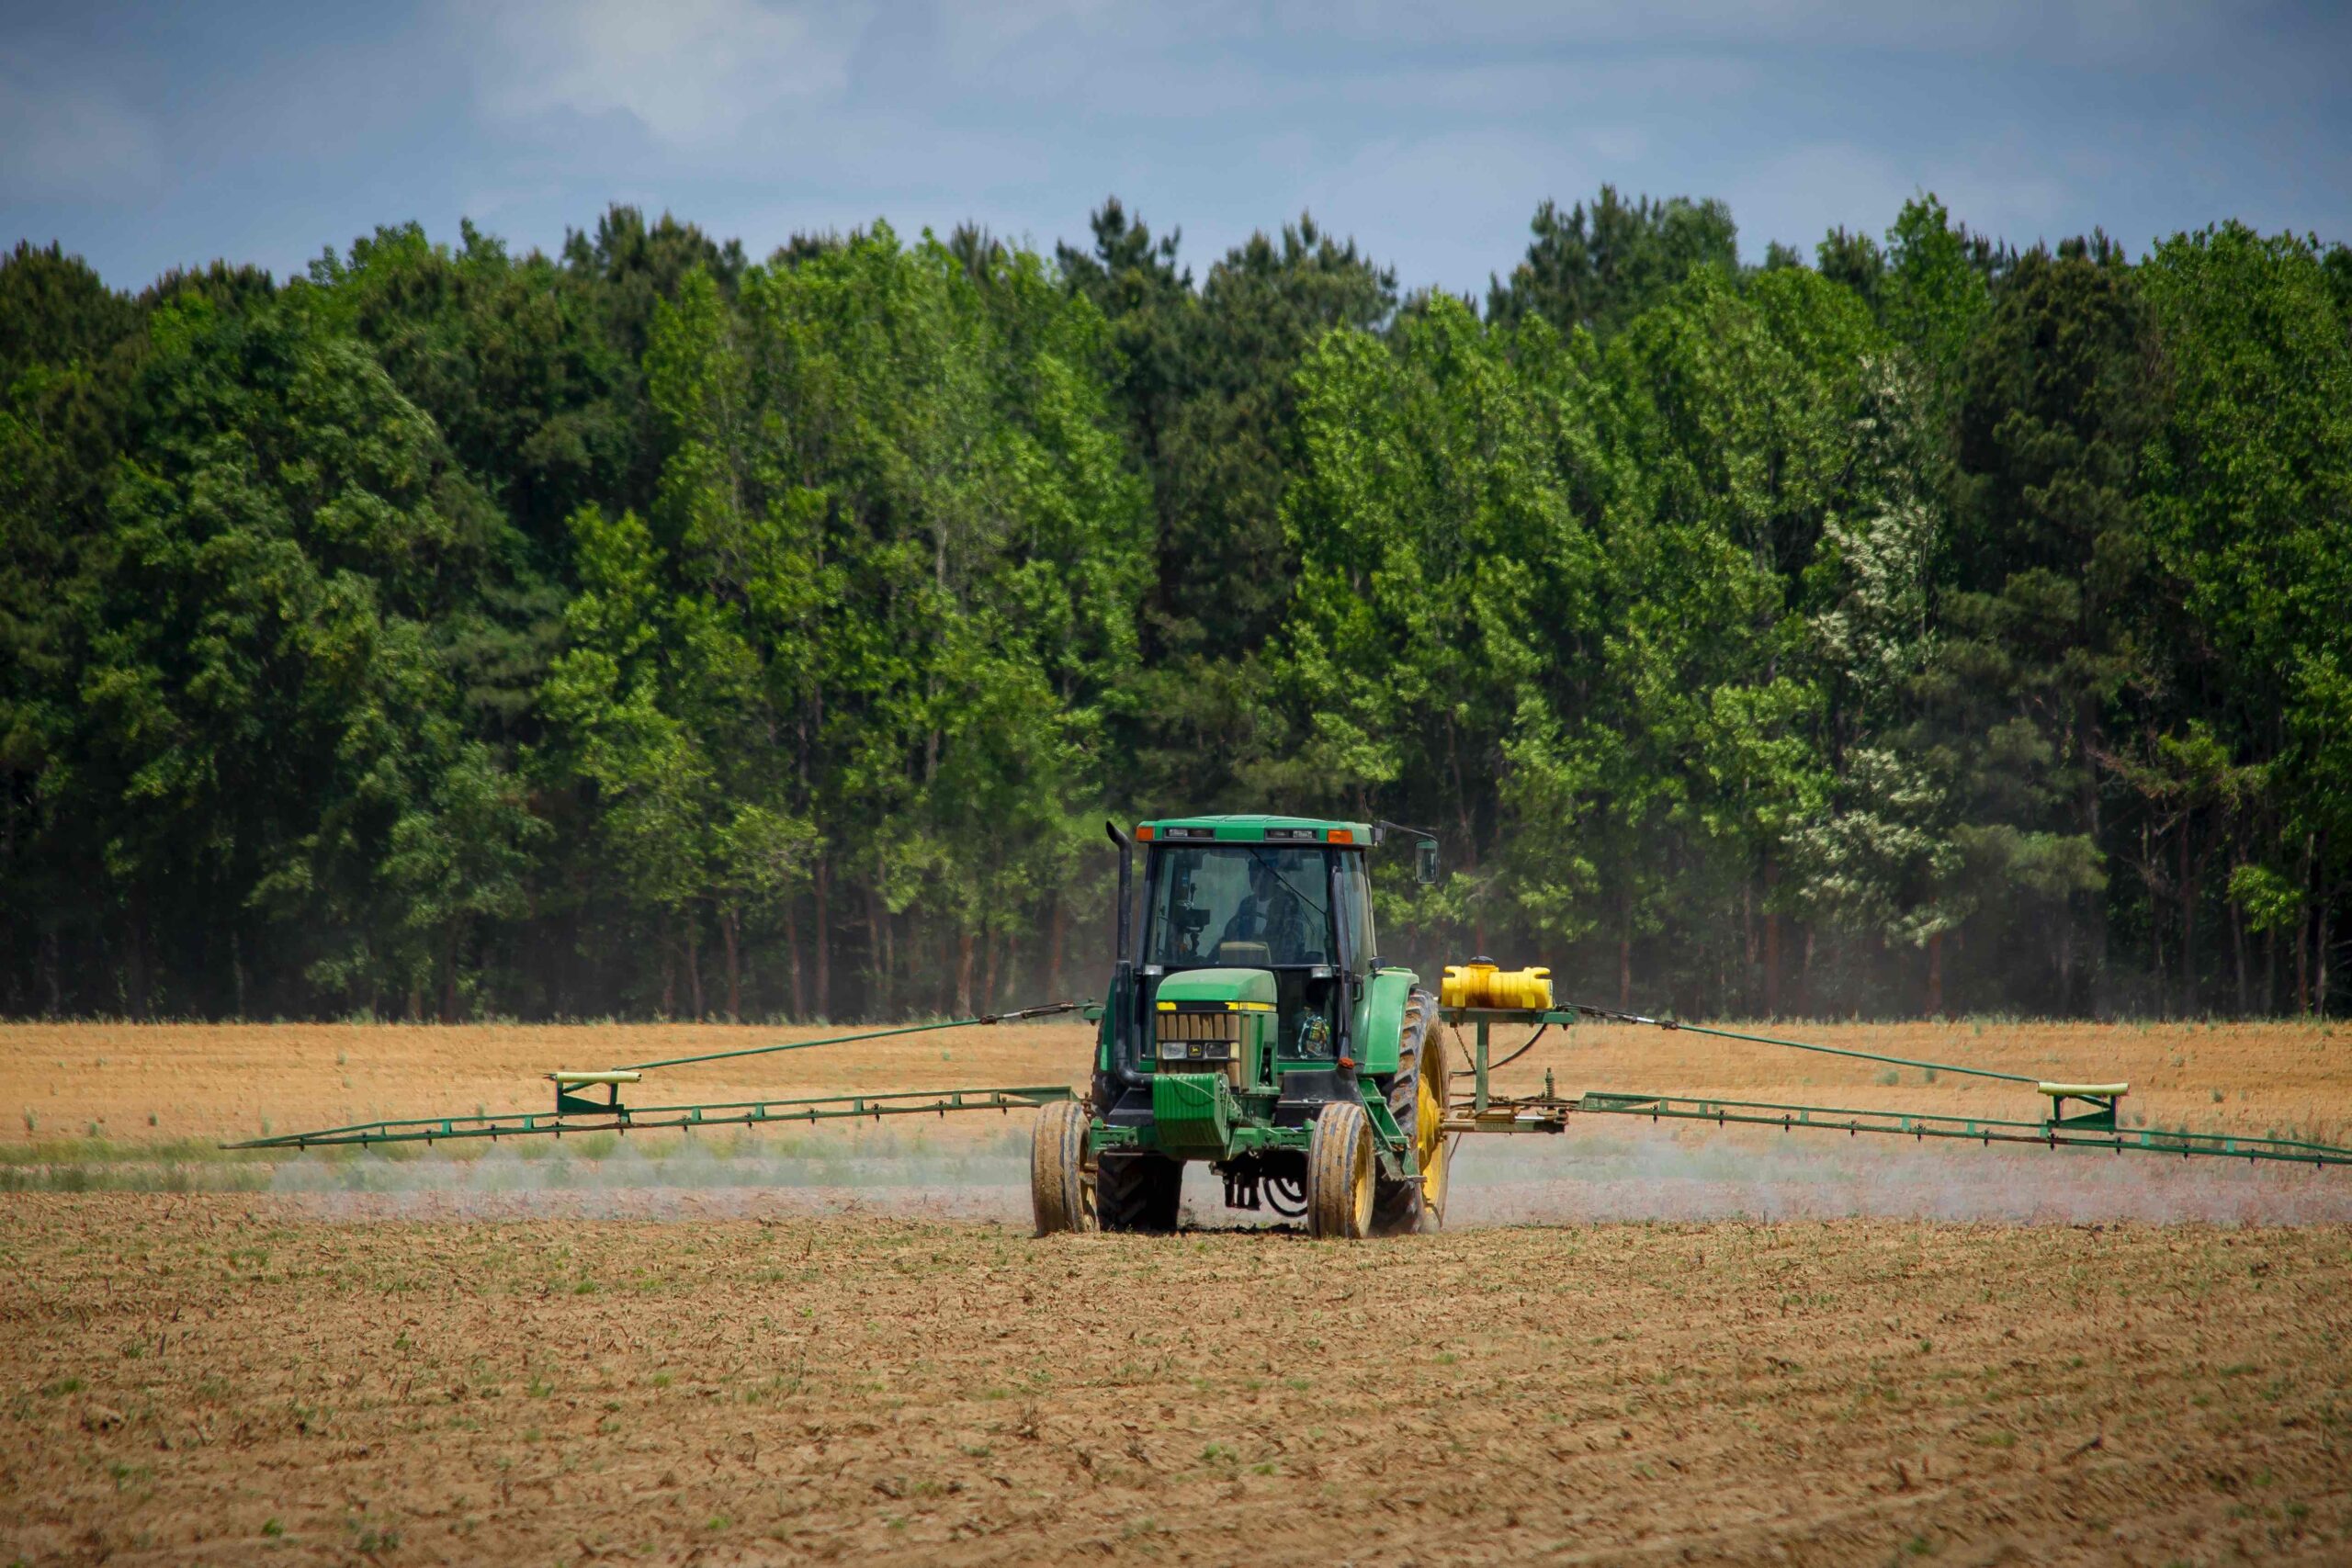
Production risk is first because it involves the primary livelihood of the agricultural operation. Production risk impacts the ability to produce a crop, raise livestock and poultry, or provide a service. Production risk occurs because of the uncertainty of weather events, pest (weed, disease, or insect) problems, and the availability of inputs – from fertilizers to seed to production technologies.
The second type of risk is marketing. Marketing risk brings the price component into play. Thinking back to when we took basic economics, we learned farmers were price takers who produce similar products. For example, a bale of cotton on your farm is not much different than a bale of cotton in the next county or neighboring state. Furthermore, the prices of agricultural products and inputs are impacted by things happening nearby and globally. Two recent examples include 1) the Covid pandemic, which caused prices to drop for many inputs and commodities, and 2) the war in Ukraine drove prices for some commodities like wheat up, as well as increased in the cost of fertilizer and fuel. These events were out of the producers’ control and difficult to predict.
The third type of risk is financial. Financial risk involves the ability of the operation to cash flow and gain access to capital to maintain and expand the operation. In today’s environment, financial risk is impacted by inflation and interest rates. Inflation makes inputs “more expensive” to buy, and consumers are unable to purchase as much with their dollar. In addition, the Federal Reserve has increased interest rates to try to get inflation in check. Higher interest rates result in a higher cost to borrow funds. Farmers are seeing higher interest expenses, even without expanding their operations.
The next area of risk is legal. Legal risk includes the knowledge of, and compliance with, regulations and laws related to the production and marketing of agricultural products and services. A recent example has been with the ability to apply dicamba herbicides which are regulated by the United States Environmental Protection Agency. Although laws vary by state, any certified applicator who plans to apply dicamba herbicides must be trained specifically on their application to ensure label compliance and stewardship. This training must be completed annually and prior to the use of any dicamba herbicides. Legal risk also encompasses the other two areas of risk: financial (requirements to follow the terms of debt) and human (labor rules and regulations). Those who do not comply with laws and regulations will be subject to liability. Liability occurs when a person or entity is held legally responsible for any potential damage or losses that result from the non-compliance.
The final area of risk is human. Although listed as the final area of risk, the figure shows it as the topmost circle in the stack of risk circles – meaning it is one of the most important areas of risk. Human risk involves the people of the agricultural operation, from management to employees to future heirs. Human risk includes the health and well-being of the people who maintain the day-to-day operations. It should also include plans to transition the operation if a change in management were to occur.
For more information on risk in agriculture and how to manage it, refer to the handbook linked in the resources, titled: “Introduction to Risk Management. Understanding Agricultural Risks: Production, Marketing, Financial, Legal, and Human.”
Five Types of Risk in Agriculture
Figure Source: Author compiled.
Resource: Crane, L., G. Gantz, S. Isaacs, D. Jose, and R. Sharp. “Introduction to Risk Management. Understanding Agricultural Risks: Production, Marketing, Financial, Legal, and Human.” Extension Risk Management Education Programs and USDA, Risk Management Agency. Handbook Second Edition, 2013. http://extensionrme.org/Pubs/Introduction-to-Risk-Management-ENGLISH.pdf
Agricultural producers constantly seek opportunities to improve their businesses by implementing new technologies and practices. In this quest for growth and improvement, benchmarking is a crucial tool that progressive and business-minded farmers and ranchers use to measure their performance against similar businesses in the industry.
Benchmarking allows producers to identify their strengths, weaknesses, and areas where they have room to grow and improve. It should cover all management aspects, production costs, production systems, marketing, finance, and human resources. By benchmarking against other producers within the same group or the industry, one can see the production or economic results that can be achieved and understand the limitations that may prevent them from attaining them. Further, producers should also be able to analyze trends and see the results of their decisions.
Producers should use a similar way to calculate results to ensure effective benchmarking. As a renowned agricultural economist, Danny Klinefelter, stated, “One of the most significant issues is to make sure the data is comparable and that you’re comparing apples to apples.”
One effective benchmarking system for beef cattle producers is the Beef-Cattle Standard Performance Analysis (SPA) used in Texas and some southern states since 1992. SPA developers used the Farm Financial Standards Guidelines created by a national task force to prepare farm or ranch financial statements as a framework for analyzing and benchmarking cow-calf enterprises. Similar systems could effectively be implemented to compare all types of ag production.
Ag Peer Advisory Groups have a long history of benchmarking, given their group culture of discussing and learning from each other. One such example is a group of ranchers from North Texas and Oklahoma that meet monthly to critique each other’s operations, share ideas, and benchmark production and economic performance. The group is facilitated by leadership from Texas A&M AgriLife Extension and supported with funding from the Southern Risk Management Education Center.
While informal peer advising is common, the advantage of formal groups or associations is the development of production and financial management standards to ensure they compare the same information. Developing and implementing effective benchmarking systems across all types of ag production will enable producers to continually improve their performance. Check with your state’s Extension Economists to learn more about performance benchmarking opportunities.
Abello, Francisco Pancho. “Benchmarking.” Southern Ag Today 3(16.3). April 19, 2023. Permalink
David Anderson wrote yesterday about markets reaching record-high cattle prices as cattle supplies tighten and some of the questions out there about the market later in the year. Cow-calf producers certainly welcome higher prices anytime, but what about the producers who don’t have anything to sell right now? Nearly 75 percent of the calves born in the U.S. are born during the first half of the year, which means many producers are calving or have already finished calving for the year. These calves are still nursing and most likely won’t be sold until later in the summer or fall. While it may be months before the spring calves are sold, producers do have opportunities to utilize price risk management tools now.
Not only are cattle prices surging to high levels now, but there is also optimism that cattle prices could continue to gain steam as we move through 2023. The chart above plots the contract price for each Feeder Cattle Futures contract month traded on the CME Group. The spring contracts are trading near $200-$205 per cwt, but the summer and fall contracts are trading above $220. Some of this increase is seasonal, but much of it is also driven by the expectation of continually tighter cattle supplies. Importantly, these expectations of high cattle prices mean there are price risk management opportunities not seen since 2014-2015.
There are a few price risk management tools that cow-calf producers selling later this year could consider. Selling a futures contract or purchasing a put option are potential strategies. One thing to consider about these choices is the contract size is 50,000 pounds which might be a little large for many cow-calf producers. Forward contracting is worth considering – this simply means a producer would lock in a sales price with a buyer in advance. USDA’s subsidized Livestock Risk Protection (LRP) tool is also worth considering and can be used on as few as one head which makes it worth a look for producers of all sizes. Your local crop insurance agent may be well equipped to help you in any LRP decisions. Each of these tools has their own design and tradeoffs to understand before jumping in, and there are certainly other risk management strategies out there. However, all tools are currently offering risk management opportunities at price levels not seen in the past eight years. Even if a producer doesn’t have any calves to sell now, they can still take advantage of the optimism in the market by managing their price risk.
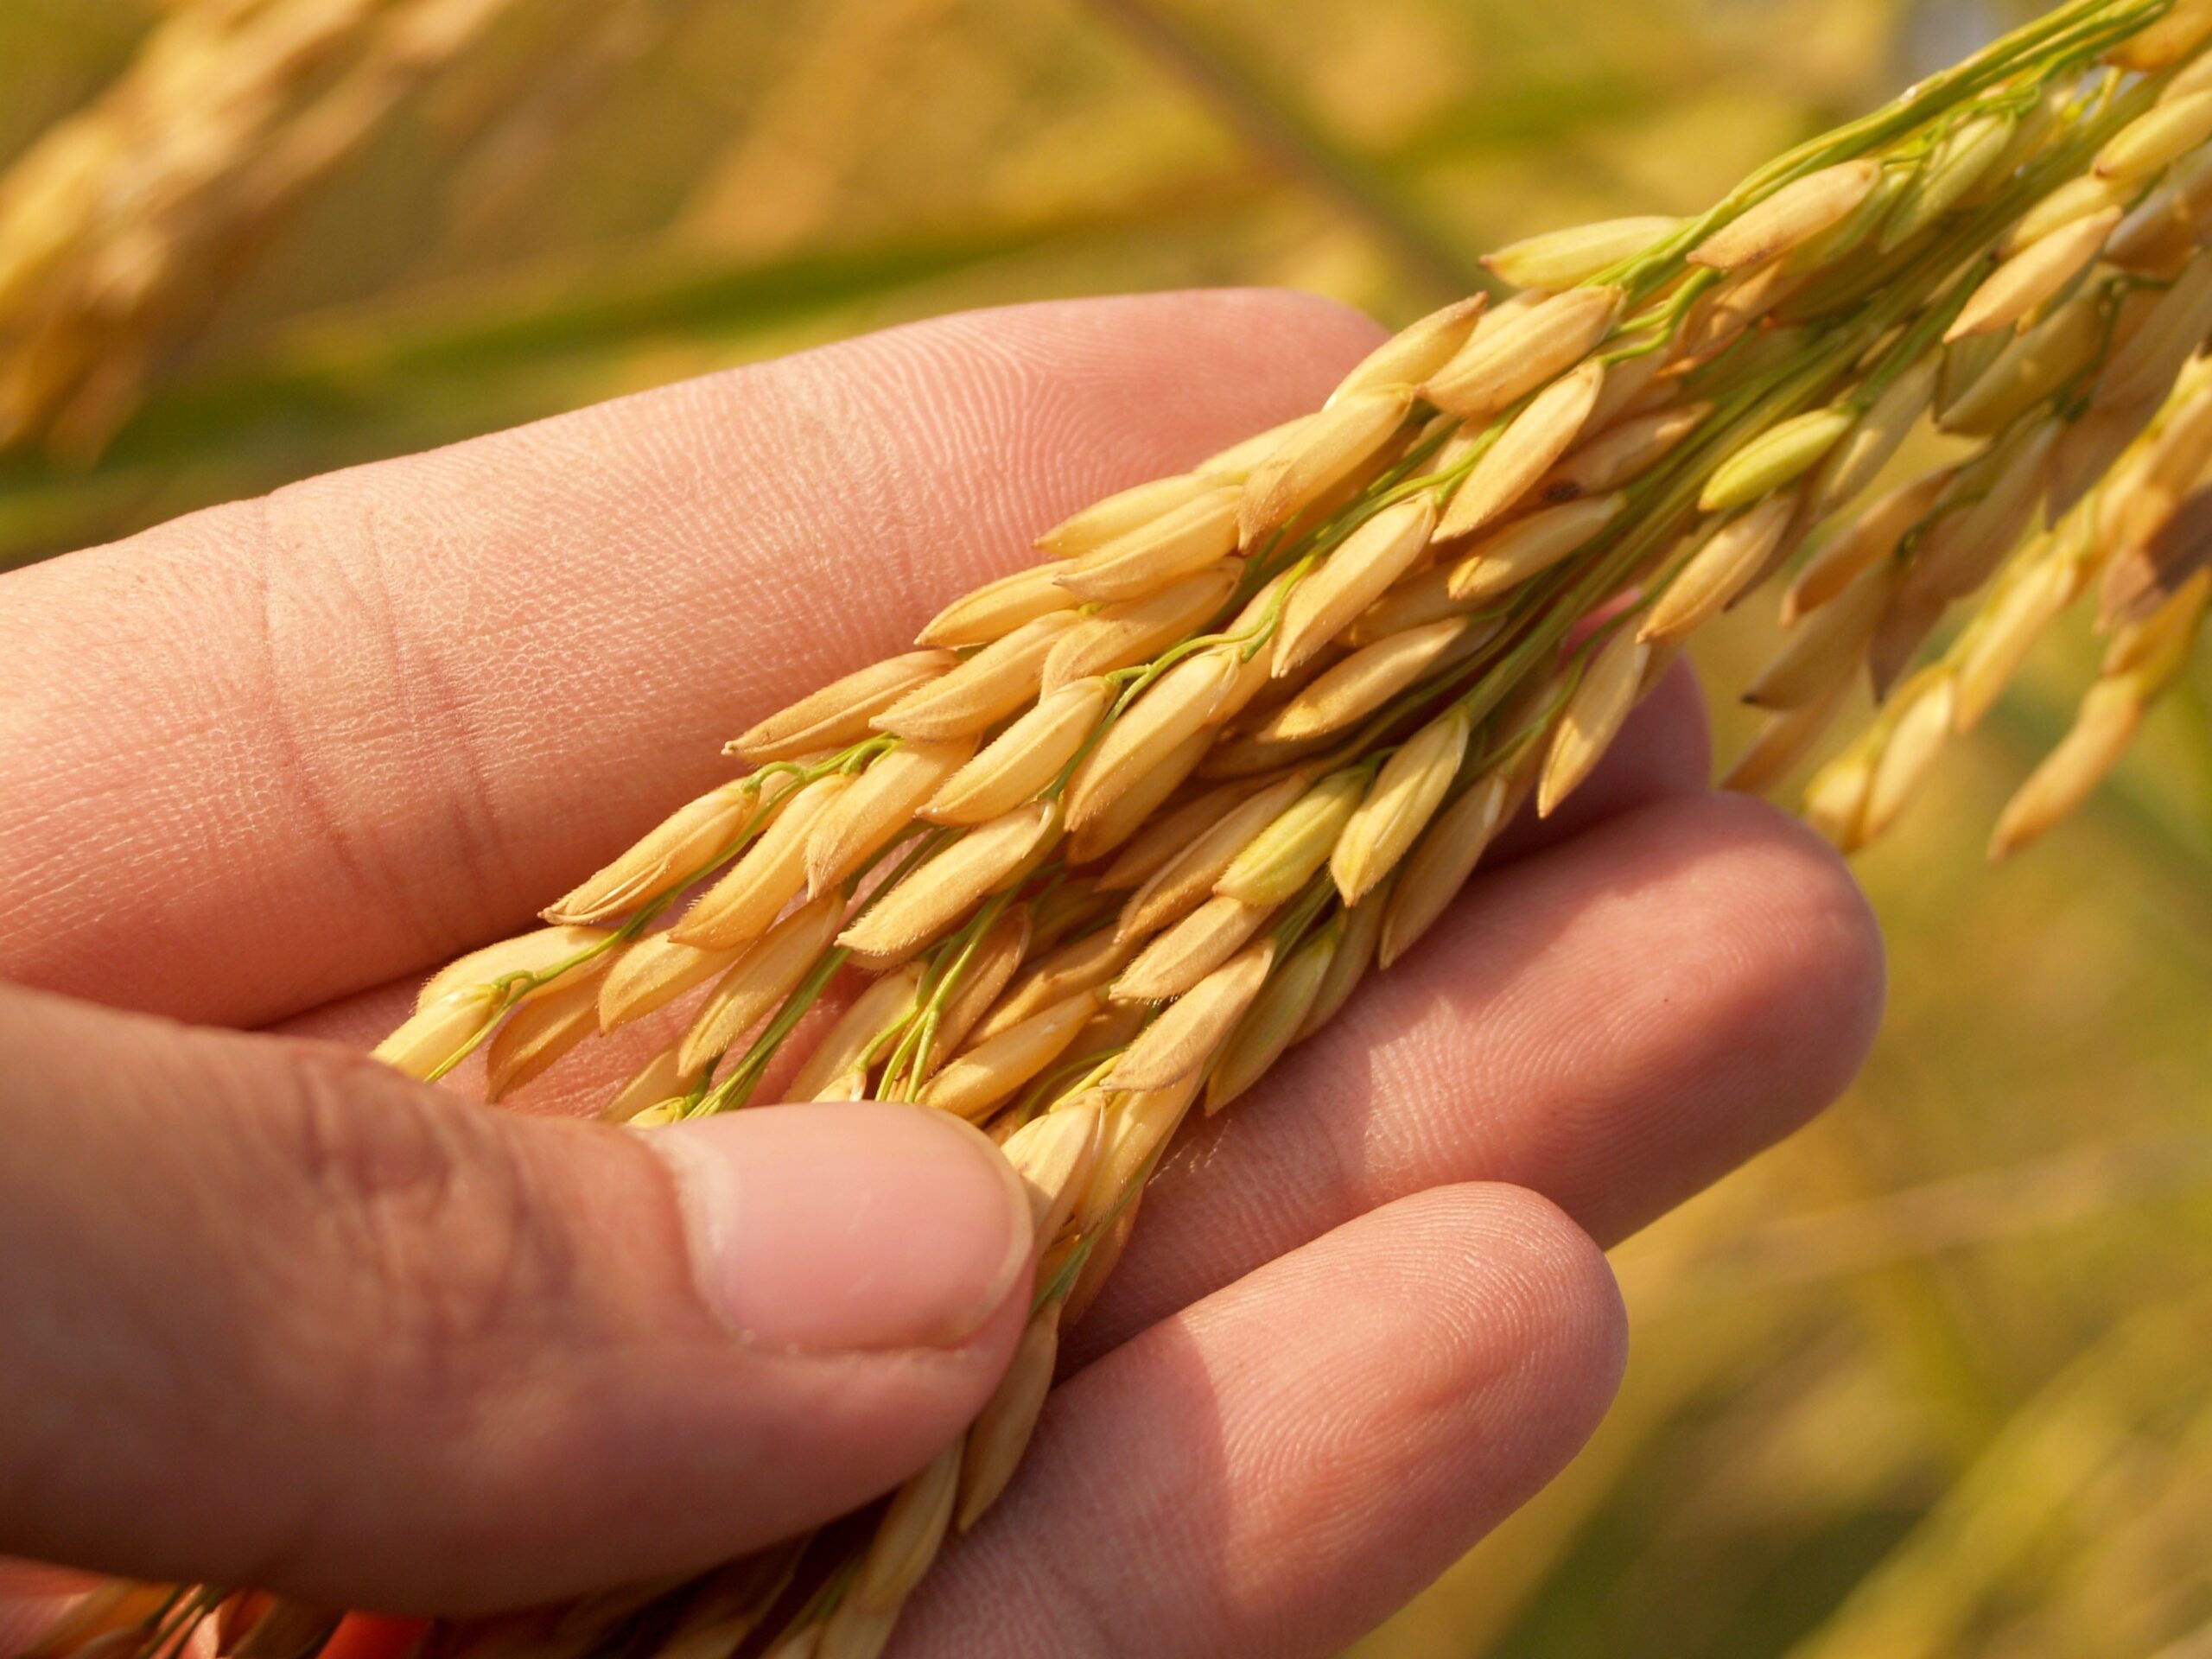
Rice planting can be very stressful during the spring in Arkansas and across the rice belt, as weather greatly affects the timing of planting. Extreme weather events like excessive spring rainfall and cooler-than-average temperatures can reduce the number of days available for planting rice early. Excessive rainfall and flooding events have delayed the timing of rice planting in Arkansas in three of the last four years (2022, 2020, 2019). The years 2019 and 2020 also had the largest and second-largest numbers of rice prevented planting acres on record. Optimum planting dates in Arkansas range from March 28th to May 20th in eastern Arkansas based on the Arkansas Rice Production Handbook. Planting rice outside of these dates can significantly reduce rice yields. A late planting season can also lead to delayed harvest in the fall, where rain and dew could lead to reduced rice kernel quality and additional drying costs associated with the late harvest.
Given these reasons, an analysis of historical weekly Crop Progress and Condition Report data from 1981 to 2022 was undertaken to better understand the number of suitable fieldwork days that have been available for planting the Arkansas rice crop by (USDA-NASS, 2023). We calculated a frequency distribution from these data to determine historical probabilities for the number of suitable fieldwork days per week available during the recommended rice planting window in Arkansas. The results are reported in the attached figure. There is a wide range in the number of days available per week, mainly reflecting extreme weather conditions during the recommended planting window. However, four days per week have the highest percentage of chance occurrence (29% likelihood), followed by five or six days per week (21% likelihood each). The likelihood of having three or fewer days per week to plant rice is 23% (approximately 1 out of four years), while the likelihood of having a whole week to plant the rice crop is 7%.
The average number of fieldwork days per week during the recommended planting window is 4.5 days. Rice producers can use this information to estimate the number of days available to complete a rice planting in years when planting has been delayed. For example, if most of a producer’s rice acres have not been planted by the end of April due to weather conditions, the rice producer has roughly three weeks left to complete rice planting within the optimal planting window. Assuming the average of 4.5 suitable fieldwork days over the next three weeks, the rice producer would expect to have approximately 13.5 days available to plant the remaining rice acres. The producer then can decide whether to plant rice or soybeans on the remaining acres based on the economic feasibility.