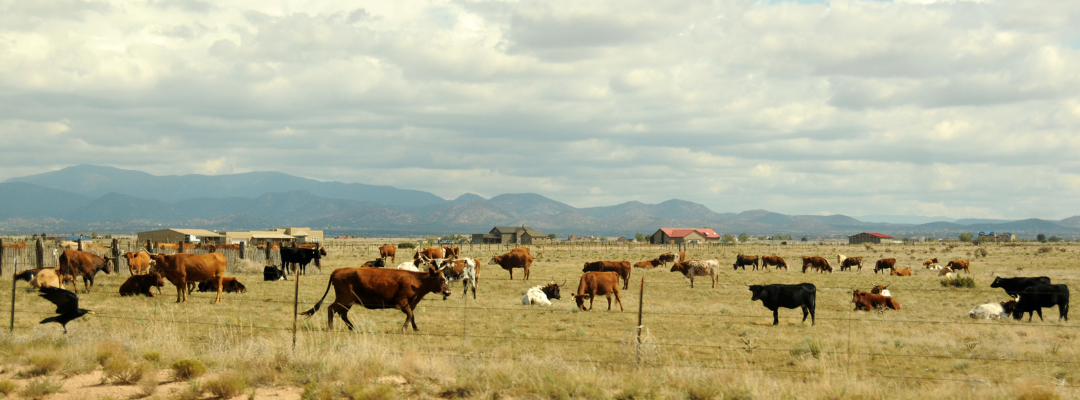
Incorporating a price risk management plan into our operation has been difficult for many ranch businesses, even considering larger sized operations. Ranchers face many risks associated with cattle pricing, as we have seen these last years after disruptions in supply chains. Past events emphasize the importance of incorporating a price risk management plan as one of our management strategies to minimize economic losses, lock margins, or reduce the risk of business failure.
The USDA Livestock Risk Protection Feeder Cattle (LRP) program is an important tool to reduce price risk in our operations by setting a floor price for our cattle. An analysis made with the last ten years of data for stocker prices shows that this tool provides floor prices and, in many cases, above the October market value (Premium purchased in May, 30 weeks endorsement, at a 98% price level coverage). Producers can choose between different price coverage levels and buy the insurance up to 52 weeks before selling their cattle.
During the summer of 2019 and winter of 2021, the USDA made a few changes to the program. These modifications reduced the premium paid by producers, delayed the premium payment to the end of the endorsement period, and made it available in all states and counties. Payments due at the end of the period are a cash-flow advantage compared to buying a Put Option in the futures market.
The LRP program is available for most ranchers since it does not require a minimum number of cattle to be insured. Small ranchers with even one cow could make use of it. Most importantly, both cow-calf and stockers operations can benefit from this program.
Producers from the southern region have significantly increased the use of LRP as a price risk management tool compared to 2020, as shown in Table 1. In 2022, producers will have insured 1.4 million head through the LRP program. For more information on LRP, please check the USDA Fact Sheet (Livestock Risk Protection Fed Cattle | RMA (usda.gov)). If you are interested in buying the insurance, the USDA website lists approved livestock agents and insurance companies.
Table 1. LRP – Quantity of Cattle Insured in the Southern States (Heads). Source: USDA – RMA
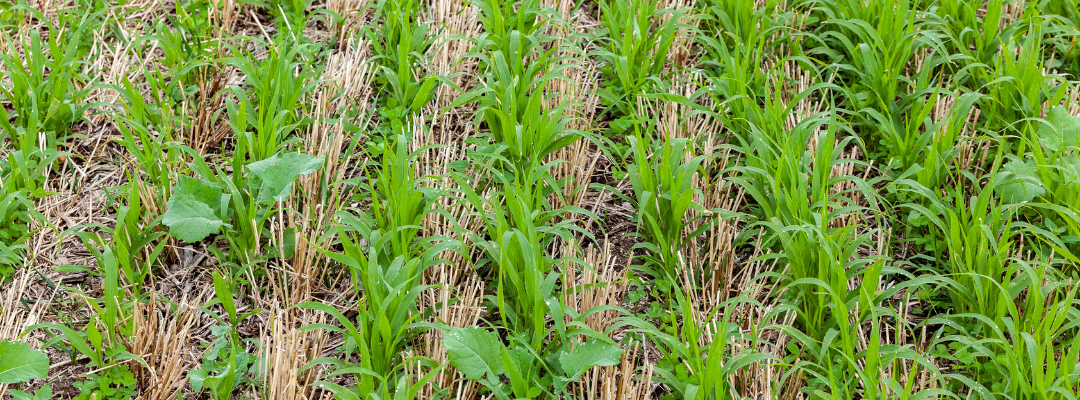
Large-scale ecosystem benefits tend to drive policy interest in cover crops. However, incorporating cover crops in a farm management plan will also require them to generate on-farm returns. To date, findings of their ability to generate profits have been mixed with inconsistent results across several studies. However, returns in a broad sense of cover crops include potential impacts on risks in addition to their effect on profits. A year of substantial loss savings can offset or justify years of minimal to slightly decreased net profit outcomes. Especially true in areas where crop prices are countercyclical to yields. Therefore, if or how cover crops help manage risk is an important consideration for their inclusion in a farm management plan.
Cover crops and their ability to reduce soil erosion and provide increased root infiltration into the soil have been studied in the context of managing specific risks, extreme wet and extreme dry (drought) conditions. Roughly 83% of total crop insurance losses in the Mid-South were related to one of these two events with 70% being excess moisture related and the majority of those from prevented planting. Regarding extreme moisture risks, most studies indicate that cover crops reduce crop damage under specific conditions. Where nutrient leeching is an issue, which may be a feature on some irrigated fields, cover crops, particularly grass cover crops, have been found to reduce corn yield losses during extreme moisture events because of higher available carbon during the growing season. A study in Northeast Mississippi showed reduced effects of excess moisture in corn-soybean rotation fields. However, some studies also show that cover crops can create early season planting challenges getting the cash crop planted in wet fields. The additional time required to terminate the cover crop may not allow sufficient time to get the cash crop planted and established. This is especially true in conventional tilling systems and where planting green (planting the cash crop in a living cover crop) is not possible.
In NRCS Zone 4 cover crop regions, the effects of cover crops in drought conditions seemed to be more consistent. The findings suggest that cover crops reduced soil compaction, increased root infiltration, and in general, led to increased water availability for the cash crop, reducing drought damage. More studies are needed in the mid-south, but a few studies observing farmers in the Midwest during the 2012 drought saw farms with cover crops experiencing an eleven (11) percentage point increase in yields relative to farms without cover crops.
Overall, cover crops show potential for risk management, particularly for managing drought risk. However, outcomes appear to be highly related to the suite of management practices on the farm, such as the cover crop variety used, whether combined with no-till, the ability to plant green, and the planting dates of the cash crop in question. In the mid-south, a cover crop before planting cotton or soybeans may be more feasible than a cover crop before planting corn when considering planting dates and early season weather risks. Nevertheless, where risk management rather than yield is the goal, a conversation with a local agronomist may help determine whether cover crops may be a good consideration as a long-term risk management tool on your farm.
Mid–South Causes of Indemnities Crop Insurance: 2015 – 2020
Source: RMA Summary of Business
References:
Bergtold, J., Ramsey, S., Maddy, L., & Williams, J. (2019). A review of economic considerations for cover crops as a conservation practice. Renewable Agriculture and Food Systems, 34(1), 62-76. doi:10.1017/S1742170517000278
Bharat Sharma Acharya, Syam Dodla, Lewis. A. Gaston, Murali Darapuneni, Jim J. Wang, Seema Sepat, Hari Bohara, Winter cover crops effect on soil moisture and soybean growth and yield under different tillage systems, Soil and Tillage Research, Volume 195, 2019, 104430, ISSN 0167-1987, https://doi.org/10.1016/j.still.2019.104430
Blanco-Canqui, H., Shaver, T.M., Lindquist, J.L., Shapiro, C.A., Elmore, R.W., Francis, C.A. and Hergert, G.W. (2015), Cover Crops and Ecosystem Services: Insights from Studies in Temperate Soils. Agronomy Journal, 107: 2449-2474. https://doi.org/10.2134/agronj15.0086
Chalise, K.S., Singh, S., Wegner, B.R., Kumar, S., Pérez-Gutiérrez, J.D., Osborne, S.L., Nleya, T., Guzman, J. and Rohila, J.S. (2019), Cover Crops and Returning Residue Impact on Soil Organic Carbon, Bulk Density, Penetration Resistance, Water Retention, Infiltration, and Soybean Yield. Agronomy Journal, 111: 99-108. https://doi.org/10.2134/agronj2018.03.0213
G.S. Marcillo and F.E. Miguez, Corn yield response to winter cover crops: An updated meta-analysis, Journal of Soil and Water Conservation May 2017, 72 (3) 226-239; DOI: https://doi.org/10.2489/jswc.72.3.226
The rise of income levels, increased availability of nutritional information, and the pursuit of a healthier lifestyle have generated a shift in the preferences of American consumers over the past few decades. This has led to a steady supply of specialty crops throughout the year to meet a growing and more sophisticated consumer demand. However, due to seasonal patterns and specialization in the production of fresh fruits and vegetables, it is necessary to rely on imports from different regions of the world to provide U.S. customers with a more stable supply and less volatile prices of these products.
A selected group of fruits and vegetables (i.e., tomatoes, peppers, onions, apples, avocados, grapes, berries, and citrus) was considered to analyze their annual patterns of domestic supply, as well as their corresponding prices and imports from both the Northern and Southern Hemispheres of the continent. On average, between 2015-2019, the annual domestic production of these crops targeting the fresh market represented a total economic value of $11.37 billion, and an additional $11.74 billion were imported each year (USDA-NASS, USDA-FAS). The data used consisted of monthly imports from 2015 to 2019 obtained from USDA-FAS and monthly movements of local produce from all domestic districts (excluding imports and exports) obtained from USDA-AMS. For prices we used the corresponding USDA-AMS monthly average prices at Terminal Markets (wholesale prices). Weighted averages were used to combine subcategories within a crop to reflect a common unit of measure.
The overall supply and observed price throughout the year of the selected crops are presented in Figure 1. Note that for some crops there is strong seasonality in their domestic supply, with peaks in different months depending on the crop analyzed. Avocados and berries have a peak of domestic production during summer, while grapes, apples and citrus show a steady increase of production from fall. For most of the analyzed crops, the imports from different regions are required to maintain a stable and sufficient supply through the year. Imports from North America (i.e., Mexico and Canada) are the main source of fresh vegetables and fruits when local production is insufficient to meet the domestic demand. North America’s imports are particularly important for tomatoes, avocados, and peppers. For some other crops such as grapes and citrus, the imports from South America play an important role in maintaining produce availability and price stability during the year. The prices for each crop show an expected pattern according to the total supply of those products and to some demand considerations. Particularly, relatively higher prices are observed during the off-season of local produce.
The market information summarized in this article could be used by local specialty crop producers and retailers to identify fundamental patterns in the availability of fresh fruits and vegetables and determine the existence of price effects derived from variations in the overall supply. This information could also help local growers design better production and marketing strategies aimed to reduce marketing risk by aligning production decisions with more favorable market conditions.
Figure 1. Supply and Price Seasonality of Selected Specialty Crops, Average 2015-2019
Research into cover cropping has shown some benefits to soil health and conservation. However, adoption of cover cropping has been relatively low due in part to uncertainty about its profitability. When considering whether to adopt this practice it is important to understand the associated costs.
Seed and planting cost make up the bulk of additional costs of cover cropping. Table 1 shows examples of the cost of planting various cover crops from prices obtained in Mississippi. Seed costs range from $18.00/ac for oats to $43.80/ac for Austrian winter peas. Planting costs are estimated at $11.68/ac including direct expenses as well as indirect equipment costs (estimates derived from the Mississippi State Enterprise Budgets assuming a 20’ grain drill). Total costs of cover cropping range from $29.68/ac to $55.48/ac. Your costs will vary depending on local conditions, seeding rates, and equipment. In some cases, an additional herbicide application is also needed to terminate the cover crop.
Table 1. Costs of Cover Cropping
Crop
Seed Cost $/lb
Seeding Rate lb/acre
Seeding Cost $/ac
Planting Cost $/ac
Cover Crop Costs $/ac
Austrian winter pea
0.73
60
43.80
11.68
55.48
Crimson Clover
1.80
20
36.00
11.68
47.68
Cereal Rye
0.39
60
23.40
11.68
35.08
Tillage radish
2.40
8
19.20
11.68
30.88
Oats
0.36
50
18.00
11.68
29.68
Rye+Clover (89/11 Mix)
0.45
50
22.36
11.68
34.04
For cover cropping to be profitable there needs to be a positive yield benefit to offset the added costs. However, research has shown that cover cropping may have no effect on yield or in some cases decrease yield. The impact on yield is highly dependent on which crop is being grown. Spencer et al. (2021) found that Austrian winter pea and cereal rye decreased corn yield by 37 and 45%, respectively, in the first year of implementing cover crops. In subsequent years there was no significant differences in yield found. But, net returns were significantly reduced in 2 out of the 4 years examined. Bryant et al. (2020) found that, relative to reduced tillage-subsoiling, a cereal rye cover crop had no impact on soybean yield but a radish cover crop reduced soybean yield by 12%. However, these results are atypical for what is usually observed in soybeans under cover cropping. Regardless, the lack of a positive yield response led to lower net returns under both the cereal rye and radish cover crops in that study. Lastly, Denton et al. (2021) found no yield response from cover cropping in cotton. This led to lower net returns of $20.34/ac to $124.64/ac under cover cropping. These studies show why cover cropping may not be profitable in the Mid-South.
One way to help alleviate the lack of profitability would be to secure Environmental Quality Incentives Program (EQIP) payments. As shown in Table 2, payments vary from state-to-state and by cover crop. Producers are only eligible for payments on land that is not currently under cover cropping. There are also limitations on payment amounts and duration. More information on your specific state’s EQIP payments can be found at: https://www.nrcs.usda.gov/wps/portal/nrcs/detailfull/national/programs/financial/?cid=nrcseprd1328426
Table 2. Environmental Quality Incentives Program Payments for Cover Cropping 2021
Alabama
Arkansas
Louisiana
Mississippi
Oklahoma
Tennessee
Texas
Practice
EQIP Payments $/ac
EQIP Payments $/ac
EQIP Payments $/ac
EQIP Payments $/ac
EQIP Payments $/ac
EQIP Payments $/ac
EQIP Payments $/ac
Cover Crop-Basic (Organic and Non-organic)
$52.36
$50.22
$50.05
$51.73
$48.60
$52.14
$33.74
Cover Crop-Multiple Species (Organic and Non-organic)
$64.02
$61.75
$61.71
$63.26
$60.25
$63.79
$41.51
The results discussed here may differ from what is found on your farm. When deciding whether to adopt cover cropping it is important to test if the practice is profitable on a small area first. Once it is determined if it is profitable for you then larger scale adoption can be implemented. Your local NRCS office can also help with additional information about obtaining EQIP payments.
References
Bryant, C.J., Krutz, L.J., Reynolds, D., Locke, M., Golden, B.R., Irby, T., Steinriede, R., Spencer, G.D., Mills, B.E., & Wood, W. (2020) Conservation Soybean Production Systems in the Mid-Southern USA: II. Replacing Subsoiling with Cover Crops. Crop, Forage & Turfgrass Management. http://dx.doi.org/10.1002/cft2.20058
Denton, S.D., Dodds, D.M., Krutz, L.J., Varco, J.J., Gore, J., Mills, B.E., & Raper, T.B. (2021). Impact of Cover Crop Species on Soil Physical Properties, Cotton Yield, and Profitability. Journal of Cotton Science. 25:68-78.
Spencer, G.D., Krutz, L.J., Locke, M., Gholson, D., Bryant, C., Mills, B.E., Henry, W., & Golden, B. (2021)Corn productivity and profitability in raised, stale seedbed systems with and without cover crops. Crop, Forage & Turfgrass Management. http://dx.doi.org/10.1002/cft2.20142
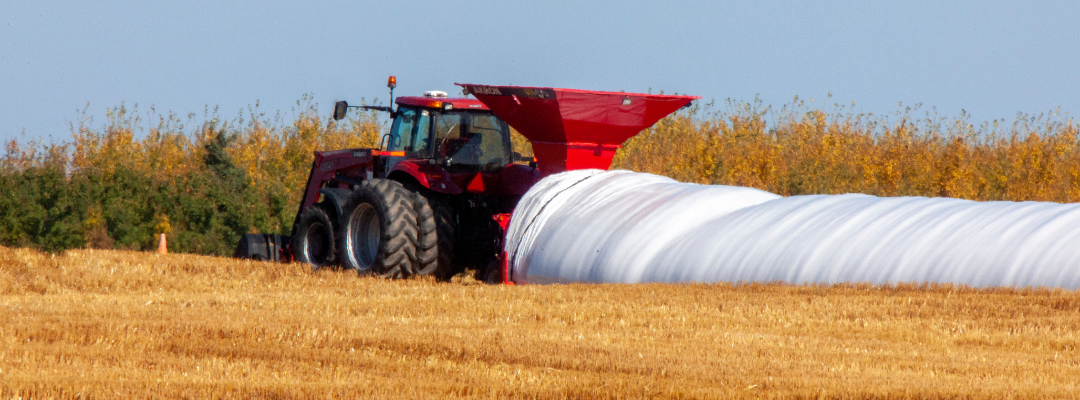
Storage can be a valuable risk management and marketing tool for Southern corn producers. Storage allows producers to reduce harvest delays, avoid seasonal price lows, expand the marketing window, and harvest grain at higher moisture – if drying or aeration is available. There are two main options to store grain: grain bins or grain bags. This article provides an overview of the benefits, ownership costs, and operating costs for a grain bagging system.
Benefits
Labor continues to be a major challenge for agricultural producers. One of the primary benefits to using a bag system is the ability to reduce harvest labor requirements, particularly trucking. Storing corn at the edge of the field reduces the number of trucks required to keep combines running, avoids long lines at elevators and barge points, and distributes hauling to terminal markets during times of the year when labor is more readily available. Additionally, the ability to harvest a crop quickly reduces the risk of losses due to adverse weather. Extending the marketing interval allows producers to benefit from post-harvest price rallies. For example, in Memphis Tennessee, the ten-year average corn price was 70 cents higher in March/April compared to the harvest low. Mid-south producers that have cotton in their crop rotation can use bagging systems to modify annual storage availability, thus avoiding capital investment in permanent grain storage infrastructure when planted acreage varies year-to-year.
Ownership Costs
A bagging system requires capital investment in a loader, unloader, and tractor. This equipment is in addition to grain carts/trucks to transport grain from the combine to bagger. Purchase prices vary however many loaders can be obtained for less than $50,000. Bag unloaders will also cost around $50,000. Most operations will have access to a tractor that can be utilized in a bagging system, however this cost should also be included. Cost of ownership will vary for each operation; however, cost estimates should include capital recovery (depreciation + interest), taxes, insurance, and housing (TIH). For example, assuming an interest rate of 6.5% and TIH of 2.0% of the equipment value, estimated ownership costs for 100,000 bushels of storage is approximately 14 cents/bushel. Storing more bushels will distribute fixed costs lowering the ownership cost per bushel.
Operating Costs
Operating costs vary by system; however, producers should consider site preparation, purchase price of storage bags, labor (loading, unloading, and monitoring), insecticides, sensors, bag disposal, and machinery expenses (fuel, repair and maintenance). Additionally, producers should account for potential storage loss/risk. Wildlife damage, insect and rodent infestation, weather, and damage from humans present a risk for storage losses. Estimated operating costs based on the assumptions below in Table 1 are 17-22 cents per bushel. Costs are highly variable so producers are encouraged to estimate costs based on operation specific variables and assumptions.
Bagging systems may be a cost-effective method to store grain for Mid-south producers. Producers are encouraged to weigh the advantages and disadvantages of permanent storage (bin) and temporary storage (bag) systems to determine which system is best for their operation. Additionally, comparing ownership and operating costs with seasonal corn prices in your area will assist in determining if investment in storage is financially beneficial for your operation.