As harvest progresses and crop prices stay at historical lows, it is difficult to consider risk management for 2026. The federal crop insurance program offers a tool that can currently provide a form of county-level revenue protection. Margin Protection (MP) crop insurance was made available for a variety of crops across the southeast region in 2024. MP is an area-level (i.e., county-level) crop insurance product designed to provide risk protection against the risk of thin margins using a combination of county yields, futures prices, and region-specific input usage. Coverage levels range from 70% to 95% and may be purchased with any individual insurance, such as Yield Protection (YP) or Revenue Protection (RP). It may not be purchased with Supplemental Coverage Option (SCO) or Enhanced Coverage Option (ECO) (see Biram and Connor, 2023). Additionally, there is a new product offering similar to ECO and MP called Margin Coverage Option (MCO), which I will provide more details on below.
For certain crops/regions the sales closing date (SCD) for MP coverage is similar to other traditional products, However, in some cases there is an early SCD and price discovery window. This early window offers the opportunity to lock in prices sooner if you think that might be an advantage to the normal spring price discovery. Check here for MP SCD’s and price discovery windows. The earlier price discovery window offered by MP (August 15, 2025, to September 14, 2025), provides corn and soybean producers with the option to buy MP and lock in futures prices, if they think that might be an advantage over the normal price discovery window (January 15, 2026, through February 14, 2026). For example, the current USDA, Risk Management Agency (RMA) projected price for MP purchased for corn is $4.55/bushel, which implies a price guarantee of $4.32/bushel assuming county yields and costs remain constant. The risk of cost of production portion of MP provides protection from price volatility for Urea, Diammonium Phosphate (DAP), Diesel, and the Interest Rate on a farmer’s production loan. These prices also face projected price discovery periods similar to crop futures prices but have different windows of harvest price discovery (see Chattha and Biram, 2024).
Another decision variable in the MP coverage decision is the Protection Factor (PF). The PF ranges from 80% to 120% and offers higher (lower) protection at a higher (lower) premium cost and largely functions as a farm-level production adjustment. That is, if a farmer perceives their yield to be higher than the county average, they may select a PF higher than 100% at an additional premium cost. Alternatively, if a farmer perceives their yield to be lower than the county average, they may select a PF less than 100% and pay a lower premium.
The University of Arkansas, Cooperative Extension Service offers a fully web-based Margin Protection decision aid. The decision aid allows the user to input information such as state, county, crop, and irrigation practice to determine Margin Losses (i.e., indemnities) net of producer paid premiums across all coverage levels. Additionally, the tool offers a feature that calculates a breakeven price, which is a harvest time crop futures price that results in a Zero Net Indemnity, or a Margin Loss equal to the producer paid premium. Breakeven prices vary by coverage level and harvest county yields input by the user.
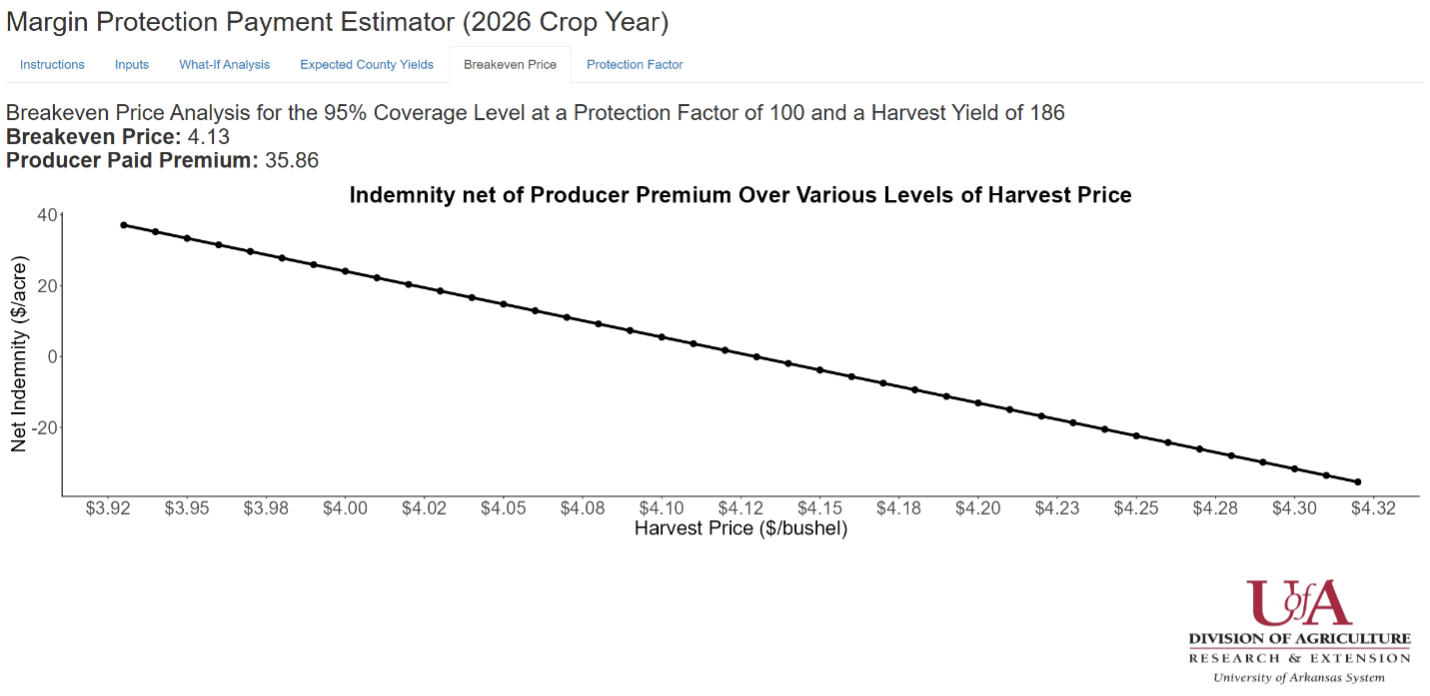
An example output showing net indemnities across different harvest crop futures prices, including a breakeven price of $4.13/bushel at the 95% coverage level, is provided in Figure 1 below. This figure suggests that Margin Losses at or above the producer paid premium are experienced if the 2026 December corn futures price has a 30-day average below $4.13/bushel at harvest (i.e., from August 15, 2026, through September 14, 2026). You may access the Margin Protection Payment Estimator (2026 Crop Year) at this link. Fact sheets which provide all of the details of MP, including counties eligible for enrollment, may be found at the following links: Margin Protection Crop Insurance and Determining Expected Cost and Premium Rates.
Figure 1. Example Breakeven Price Figure from Margin Protection Payment Estimator Tool
This is an example of net indemnities across various harvest time crop futures prices for corn in Arkansas County, Arkansas assuming county yield remains unchanged. Intuitively, as the harvest price increases the net indemnity decreases.
Margin Coverage Option (MCO)
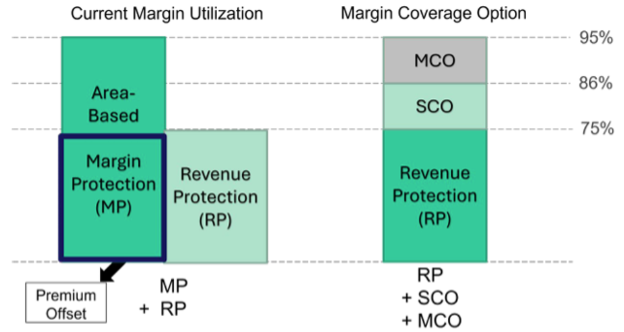
Like MP, MCO provides area-based coverage against an unexpected fall in operating margin. This could be driven by a fall in the county-level yield average, a fall in the harvest-time futures price, or an increase in the futures prices of select inputs or any combination of these perils. MCO faces the same projected and harvest price discovery periods for crop futures and input future prices as MP. MCO uses the same expected and final county-level yields as SCO and ECO and covers a band from 86% to either 90% or 95% of expected county-level revenue. Figure 2 provides a visual comparison of MP and MCO and their eligibility to be enrolled with other federal crop insurance products. Currently, the subsidy rate for MCO is the same as the updated subsidy rates for SCO and ECO, which is 80% of the actuarially fair premium, meaning farmers will pay 20% of the total premium expense. For a full list of crops and MCO pilot areas, visit www.margincoverageoption.com. The Sales Closing Date (SCD) for the 2026 crop year for MCO on cotton and sorghum is September 30, 2025, while the SCD for MCO on Rice in Arkansas is February 28, 2026, like MP and other major crop insurance plans (e.g., YP, RP, SCO, and ECO).
Figure 2. Comparing Coverage Bands of MP and MCO and Eligible with Other Federal Crop Insurance Products
MCO Resources
USDA, Risk Management Agency Frequently Asked Questions on ECO
USDA, Risk Management Agency Fact Sheet on MCO
Watts and Associates Website for MP
Watts and Associates Website for MCO
References
Biram, H.D. and Connor, L. (2023). Types of Federal Crop Insurance Products: Individual and Area Plans. University of Arkansas System Division of Agriculture, Cooperative Extension Service Fact Sheet No. FSA75.
Biram, H.D. and Stiles, S. (2022). Margin Protection Crop Insurance: A Way to Manage the Risk of High Input Costs. University of Arkansas System Division of Agriculture, Cooperative Extension Service Fact Sheet No. FSA66.Chattha, K.A. and Biram, H.D. (2024). Determining Expected Cost and Premium Rates in Margin Protection Crop Insurance. University of Arkansas System Division of Agriculture, Cooperative Extension Service Fact Sheet No. FSA87.
Biram, Hunter D. “Margin Crop Insurance Available Across the Southern Region.” Southern Ag Today 5(42.1). October 13, 2025. Permalink