Category: Farm Management

  • Revenue Protection Dominates Crop Insurance Coverage

    Revenue Protection Dominates Crop Insurance Coverage

    From 1995-2020, available products and program changes have dramatically shifted the profile of crop insurance products used by Southern ag producers.  In that time, producers in 13 Southern states have typically covered around 40 to 45 million combined acres across 7 major commodities.

    In 1995, over 45 million acres across the South were covered by a limited offering of yield only type products.  Two products covered almost 91% of insured acres.  Catastrophic coverage (50% yield and 55% price) carried nearly 30 million acres with another 12.35 million under 65% APH.  As revenue products [Revenue Assurance, Crop Revenue Coverage, and Revenue Protection (RP)] were developed and incentive structures evolved, producers (and in no small part, their lenders) have come to rely heavily on revenue protection at higher buy-up levels.  By 2007, 50% of the acres were covered by a revenue type product, and by 2020 that share had grown to over 80%.  Two coverage levels, 70% RP and 75% RP, dominate all other product types/levels, accounting for over half of the acres (24.7 of 44.9 million acres) covered in 2020.

    Southern Crop Acres Insured by Product Type/Level

    revenue protection dominates crop insurance coverage graphic
    Source:  USDA, Risk Management Agency Summary of Business.   
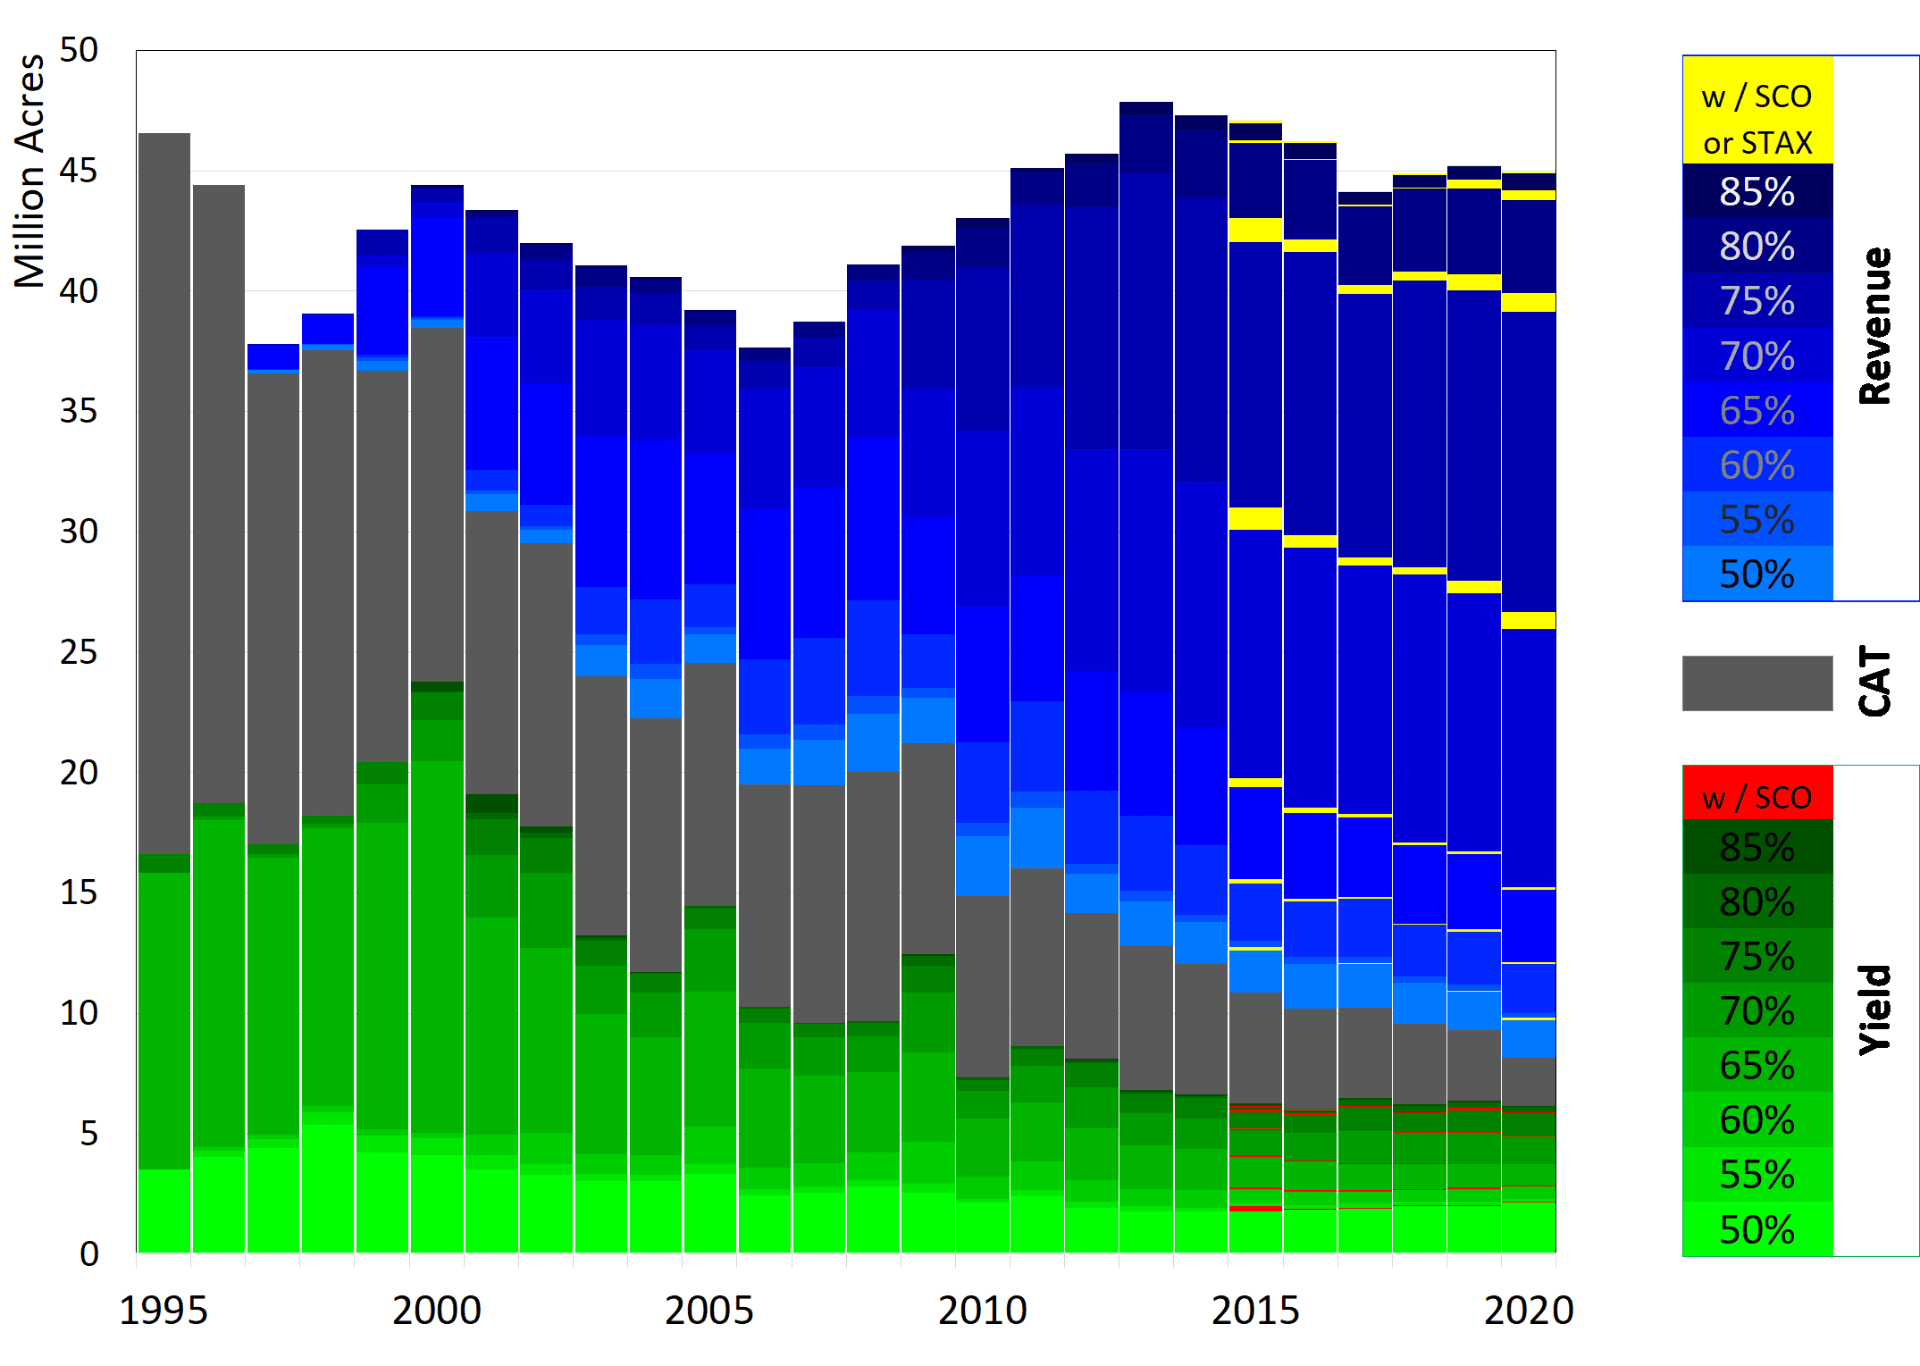
    Total annual acres covered across 13 Southern states (AL, AR, FL, GA, KY, LA, MS, NC, OK, SC, TN, TX, and VA) for 7 crops (Corn, Cotton, Grain Sorghum, Peanuts, Rice, Soybeans, and Wheat).   
    Yield Coverage includes: APH, YP, and PNT.   Revenue Coverage includes: CRC, RA, RP, and RPHPE

    Klose, Steven. “Revenue Protection Dominates Crop Insurance Coverage.” Southern Ag Today 1(43.3). October 20, 2021. Permalink

  • Adopting Farm Management Practices for Carbon Credit Payments?

    Adopting Farm Management Practices for Carbon Credit Payments?

    The emergence of developing carbon markets and programs aimed at the agriculture sector have provided farmers with the opportunity to receive payments for adopting management practices that reduce greenhouse gas emissions.  The United States Environmental Protection Agency (EPA) estimates that over half of the greenhouse gases emitted in the agriculture sector come from soil management (Figure 1).  Therefore, most carbon programs in the agricultural sector provide payments to farmers who generate carbon credits by adopting no-till or conservation tillage practices or cover crops.  The majority of current carbon programs require the concept of additionality; meaning they will only pay for new (added) carbon-sequestering practices.  Therefore, if you were an early adopter of conservation practices like no-till or cover crops and are standard practices on your farm, today you are not eligible to enroll those acres in most carbon programs.  Current contracts offer farmers a range from $15-$20 per ton of carbon sequestered, but capacity to sequester (tons/acre) and the conservation practices adopted will vary by individual farm.  It is essential to understand the costs and risks of implementing new practices and critically compare those to the potential benefits before enrolling in any carbon market program.  Furthermore, due to the complexity and nuances of current carbon market programs, it is recommended you seek legal advice before entering into any contract.

    Figure 1. Percent of U.S. greenhouse gas emissions from agriculture activities (source: U.S. EPA Inventory of Greenhouse Gas Emissions)

    Shockley, Jordan. “Adopting Farm Management Practices for Carbon Credit Payments?”. Southern Ag Today 1(42.3). October 13, 2021. Permalink