Farmland is one of the most important assets for agricultural producers, serving as both a source of income and a foundation for their livelihood. With continued strong demand for agricultural land, farmland values in the Southern U.S. have steadily increased over time. According to the USDA Economic Research Service, the compound annual growth rate of farmland values between 2018 and 2024 was around 5 percent.
However, in recent years, there has been growing discussion that demand for farmland isn’t coming solely from producers. From media reports and even casual conversations with neighbors, we often hear about billionaires purchasing large tracts of farmland or significant parcels being sold to developers. Yet despite these stories and the concerns they raise, there is little concrete information about how frequently non-producer buyers are participating in the farmland market. This leads us to an important question: How active are non-agricultural buyers in today’s agricultural land market?
Using transaction-level data from lending institutions in Mississippi covering the period from 2019 through the first half of 2023, we can begin to understand the different types of buyers in the agricultural land market. Buyers are categorized into four groups: (1) individuals and general partnerships (GPs), likely involved in agricultural production; (2) financial and real estate businesses; (3) non-individual/non-GP agricultural businesses; and (4) other industries. Other than the first group (individuals and GPs), the rest are limited partnerships, limited liability companies, and corporations, and they are grouped based on the North American Industry Classification System (NAICS) codes.
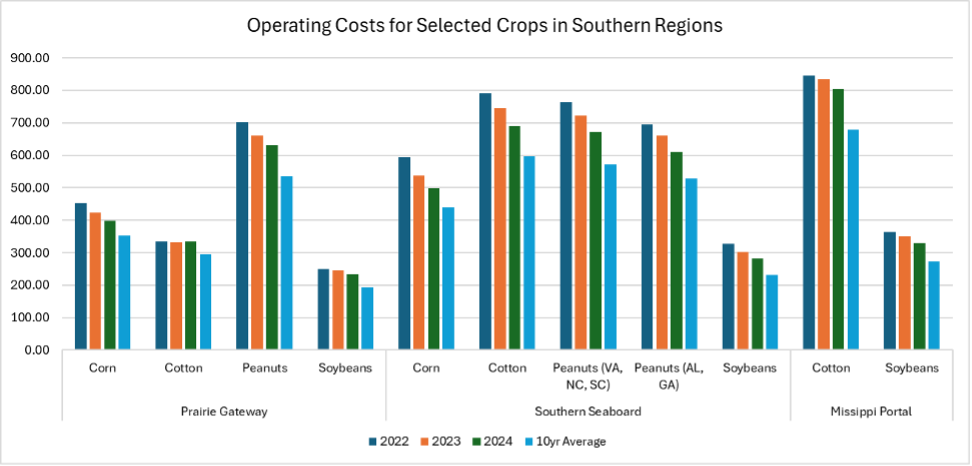
Figure 1: Number of Agricultural Land Transactions by Buyer Type
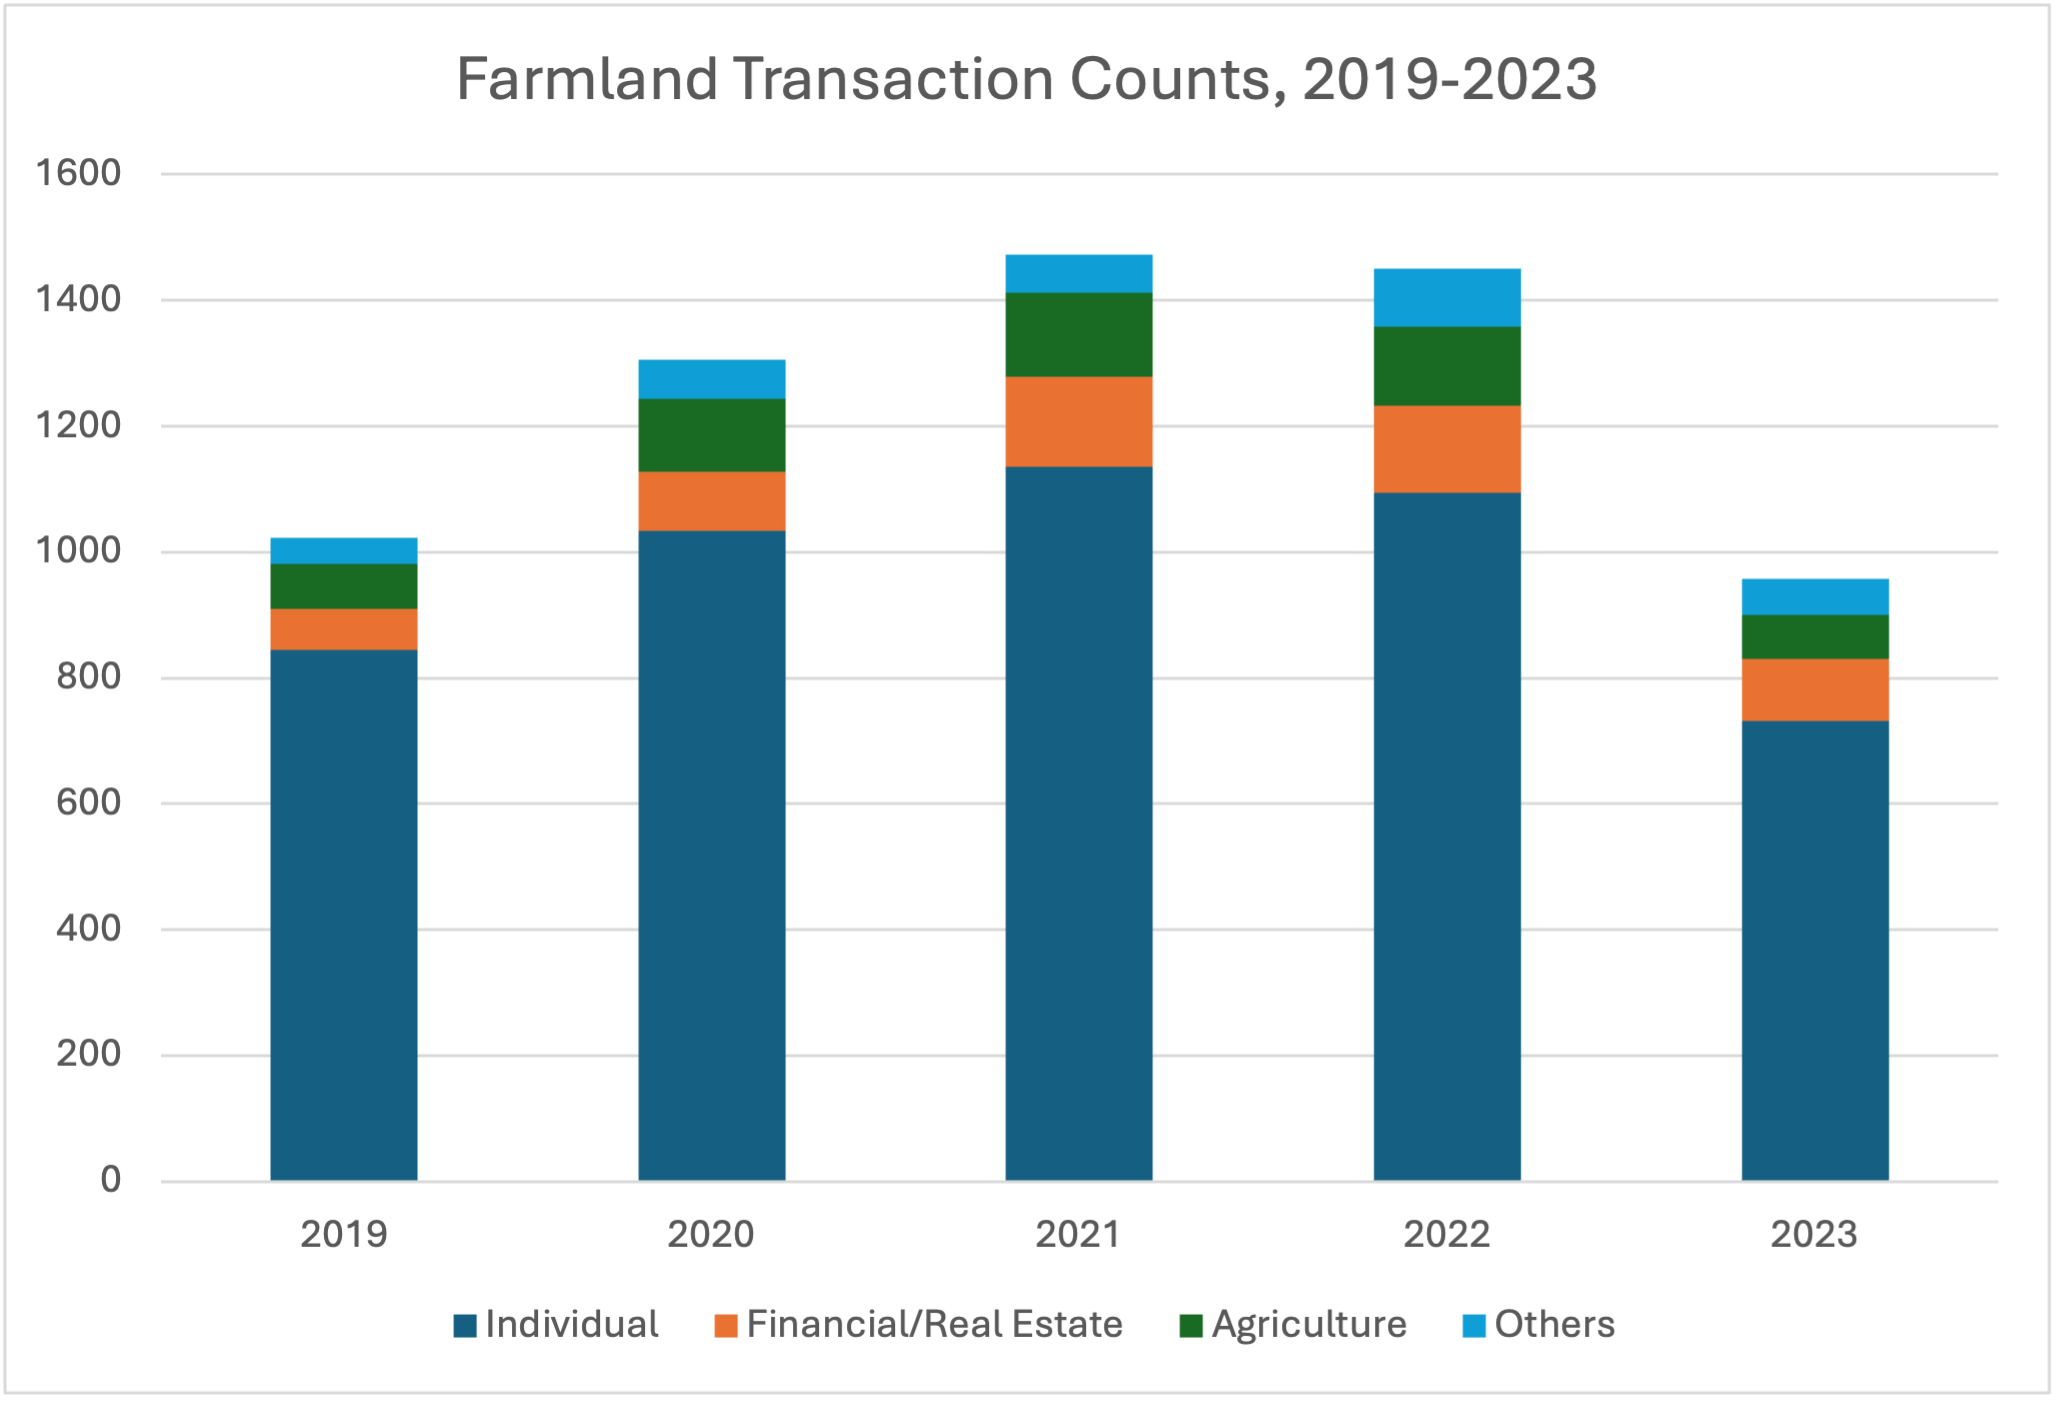
Figure 1 shows the number of farmland transactions completed by four groups between 2019 and the first half of 2023: (1) individuals and general partnerships (GPs), (2) financial and real estate businesses, (3) non-individual/non-GP agricultural businesses, and (4) all other business entities.
What we find is that the majority of farmland transactions in Mississippi are predominantly carried out by individuals and GPs. Between 75% and 83% of all transactions during this period involved buyers from this group. The presence of financial and real estate businesses in the market has grown over time, even though their overall share still remains somewhat small. Their share of total farmland transactions ranges between 6.36% in 2019 and 10.42% in the first half of 2023—surpassing the share of non-individual/non-GP agricultural businesses, which ranged from 7% to 9% during the same period. The final group—comprised of other businesses such as those in construction, warehousing, and unrelated industries—accounted for approximately 4% to 6% of total transactions.
In summary, individuals and general partnerships (GPs) remain the most active participants in the farmland market in terms of transaction frequency. However, there is an increase in the number of non-individual/non-GP buyers, particularly financial and real estate developers. While this external demand may help support farmland values, it can also contribute to upward pressure on land prices—bringing both potential benefits and challenges for agricultural producers. Moreover, this shift in ownership patterns coincides with a long-term decline in U.S. farmland acreage, but identifying the actual relationship will require more rigorous examination. As the farmland market continues to evolve, understanding who is buying agricultural land—and why—becomes increasingly important. Continued monitoring of buyer trends can help inform policy discussions, land use planning, and long-term strategies.
Kim, Kevin, Hudu Abukari, Ayoung Kim, and Brian E. Mills. “Who’s Buying Farmland? A Look at Mississippi’s Agricultural Land Market.” Southern Ag Today 5(31.1). July 28, 2025. Permalink