Planting rice in a suitable timeframe is critical for profitable rice production. Planting rice too early or too late can result in significant losses in grain yield and milling quality. The timing of rice planting is strongly impacted by weather, particularly excessive precipitation. Too much precipitation can delay rice planting and can also trigger rice replanting and levee repairs in rice fields. In extreme instances, excessive and persistent precipitation can lead to prevented planted rice acres. For example, prevented planted rice acres in Arkansas reached a record high of 512 thousand acres in 2019 due to flooding and excessive precipitation occurring throughout the growing season (Watkins and Gautam, 2021). The initiation and completion of rice planting in a growing season also varies by geographic location.
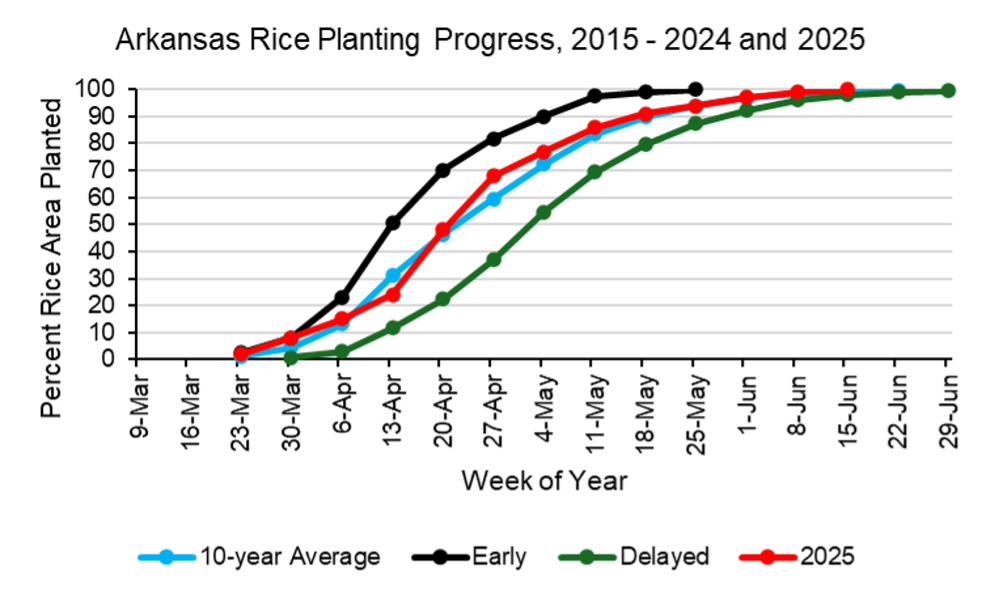
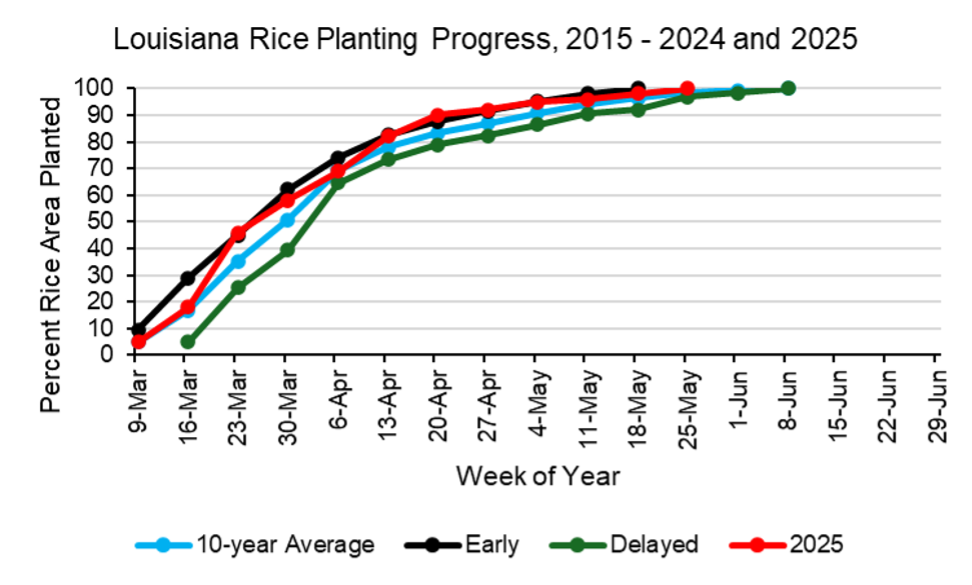
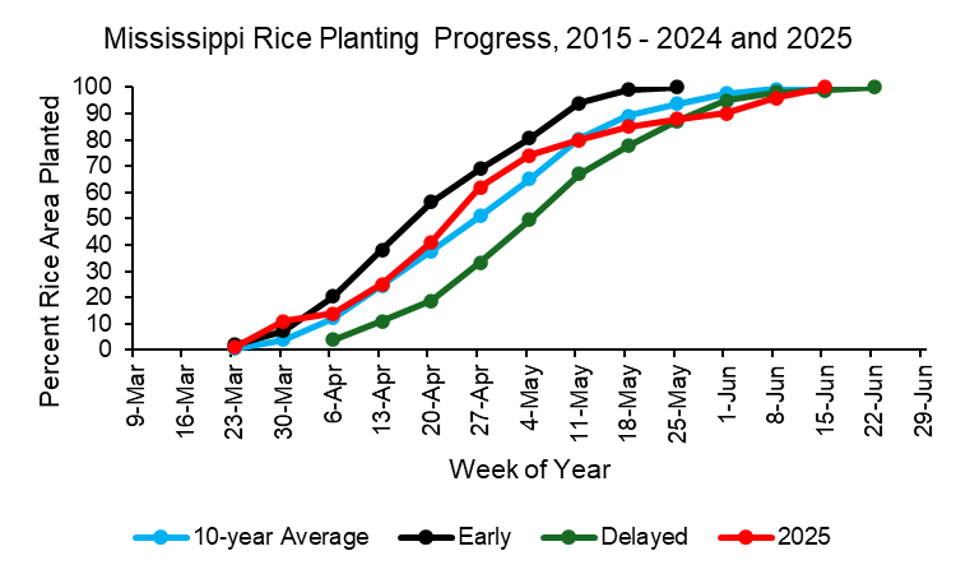
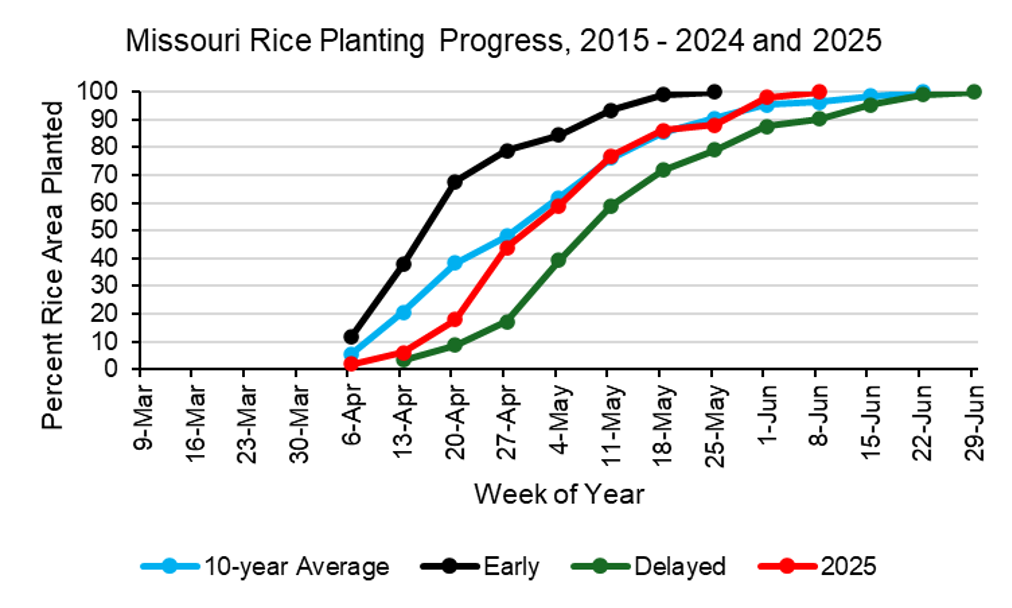
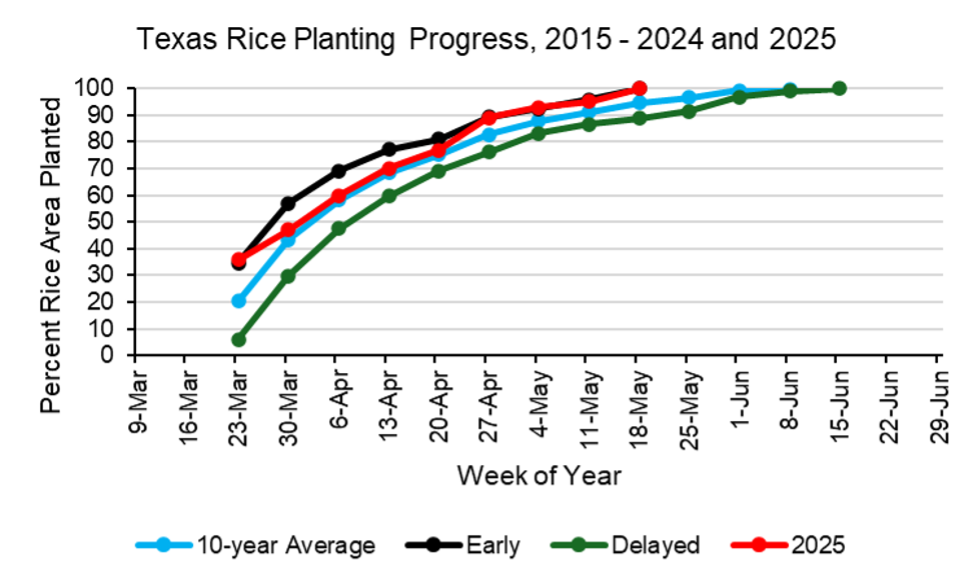
This article evaluates historic and current rice planting progress for the southern United States (Arkansas, Louisiana, Mississippi, Missouri, and Texas) using weekly crop progress data from the USDA National Agricultural Statistics Service (USDA, NASS 2025). Historical and current weekly rice planting progress curves are presented for each southern rice-producing state in the accompanying figures. Historic rice planting progress is defined as the 10-year average percent of rice area planted by week for the period 2015 – 2024, while current rice planting progress is defined as the percent rice area planted by week for the 2025 growing season. The early and late planting timelines are based on how much land is usually planted each week, adjusted to show either earlier-than-normal or later-than-normal planting by using a typical range of variation. Dates in the figures represent the ending dates for each week evaluated. For example, 20-Apr represents the week of 14-Apr through 20-Apr.
A few things stand out when looking at the charts of the five states. First, rice plantings begin and end earlier for the more southerly states (Louisiana, Texas) relative to the more northerly states (Arkansas, Mississippi, Missouri), as would be expected. Second, rice planting progress becomes more variable moving south to north. The gaps between early and delayed rice planting curves are wider for Arkansas, Mississippi, and Missouri than for Louisiana and Texas, implying weather variability has a stronger impact on rice plantings in the more northerly states. Third, the timing of variability in rice planting progress is different when moving south to north. The gaps between early and delayed planting curves for Louisiana and Texas are widest during the beginning of rice planting and become narrower thereafter, implying weather variability is more of a factor for both states when rice planting begins. In contrast, gaps between early and late planting curves in Arkansas, Mississippi, and Missouri expand after rice planting starts and are widest during the second week of April through the second to third week of May. Thus, mid-spring weather can greatly accelerate or greatly delay rice plantings in the northern states.Rice plantings in 2025 have concluded or are very close to completion for all five southern rice states as of this writing. How did rice plantings in 2025 compare with historic 10-year averages? The answer of course varies by state. Arkansas and Mississippi experienced intermittent precipitation throughout the 2025 planting season, leading to rice plantings tracking early and behind the 10-year average for both states at different times in the season. Heavy rain events occurred in both states, resulting in planting delays, flooded fields, washed-out levees, and the need for replanting. In Missouri, rain events slowed rice planting during the first three weeks of April, but planting eventually accelerated thereafter to track closely with the 10-year average. Louisiana and Texas rice plantings were at or ahead of the 10-year average during much of the 2025 planting season.
References and Resources
USDA-NASS (2025). United States Department of Agriculture, National Agricultural Statistics Service. Crop Progress. https://usda.library.cornell.edu/concern/publications/8336h188j
Watkins, K.B., and T.K. Gautam (2021). An Overview of Rice Prevented Planting Acres in Arkansas, 2011 to 2020. In: J. Hardke, X. Sha, and N. Bateman (eds.) B.R. Wells Arkansas Rice Research Studies 2020. Arkansas Agricultural Experiment Station Research Series 676:317-321. Fayetteville. https://scholarworks.uark.edu/aaesser/200/
Watkins, Brad. “Historic and Current Rice Planting Progress in the Southern United States.” Southern Ag Today 5(26.1). June 23, 2025. Permalink