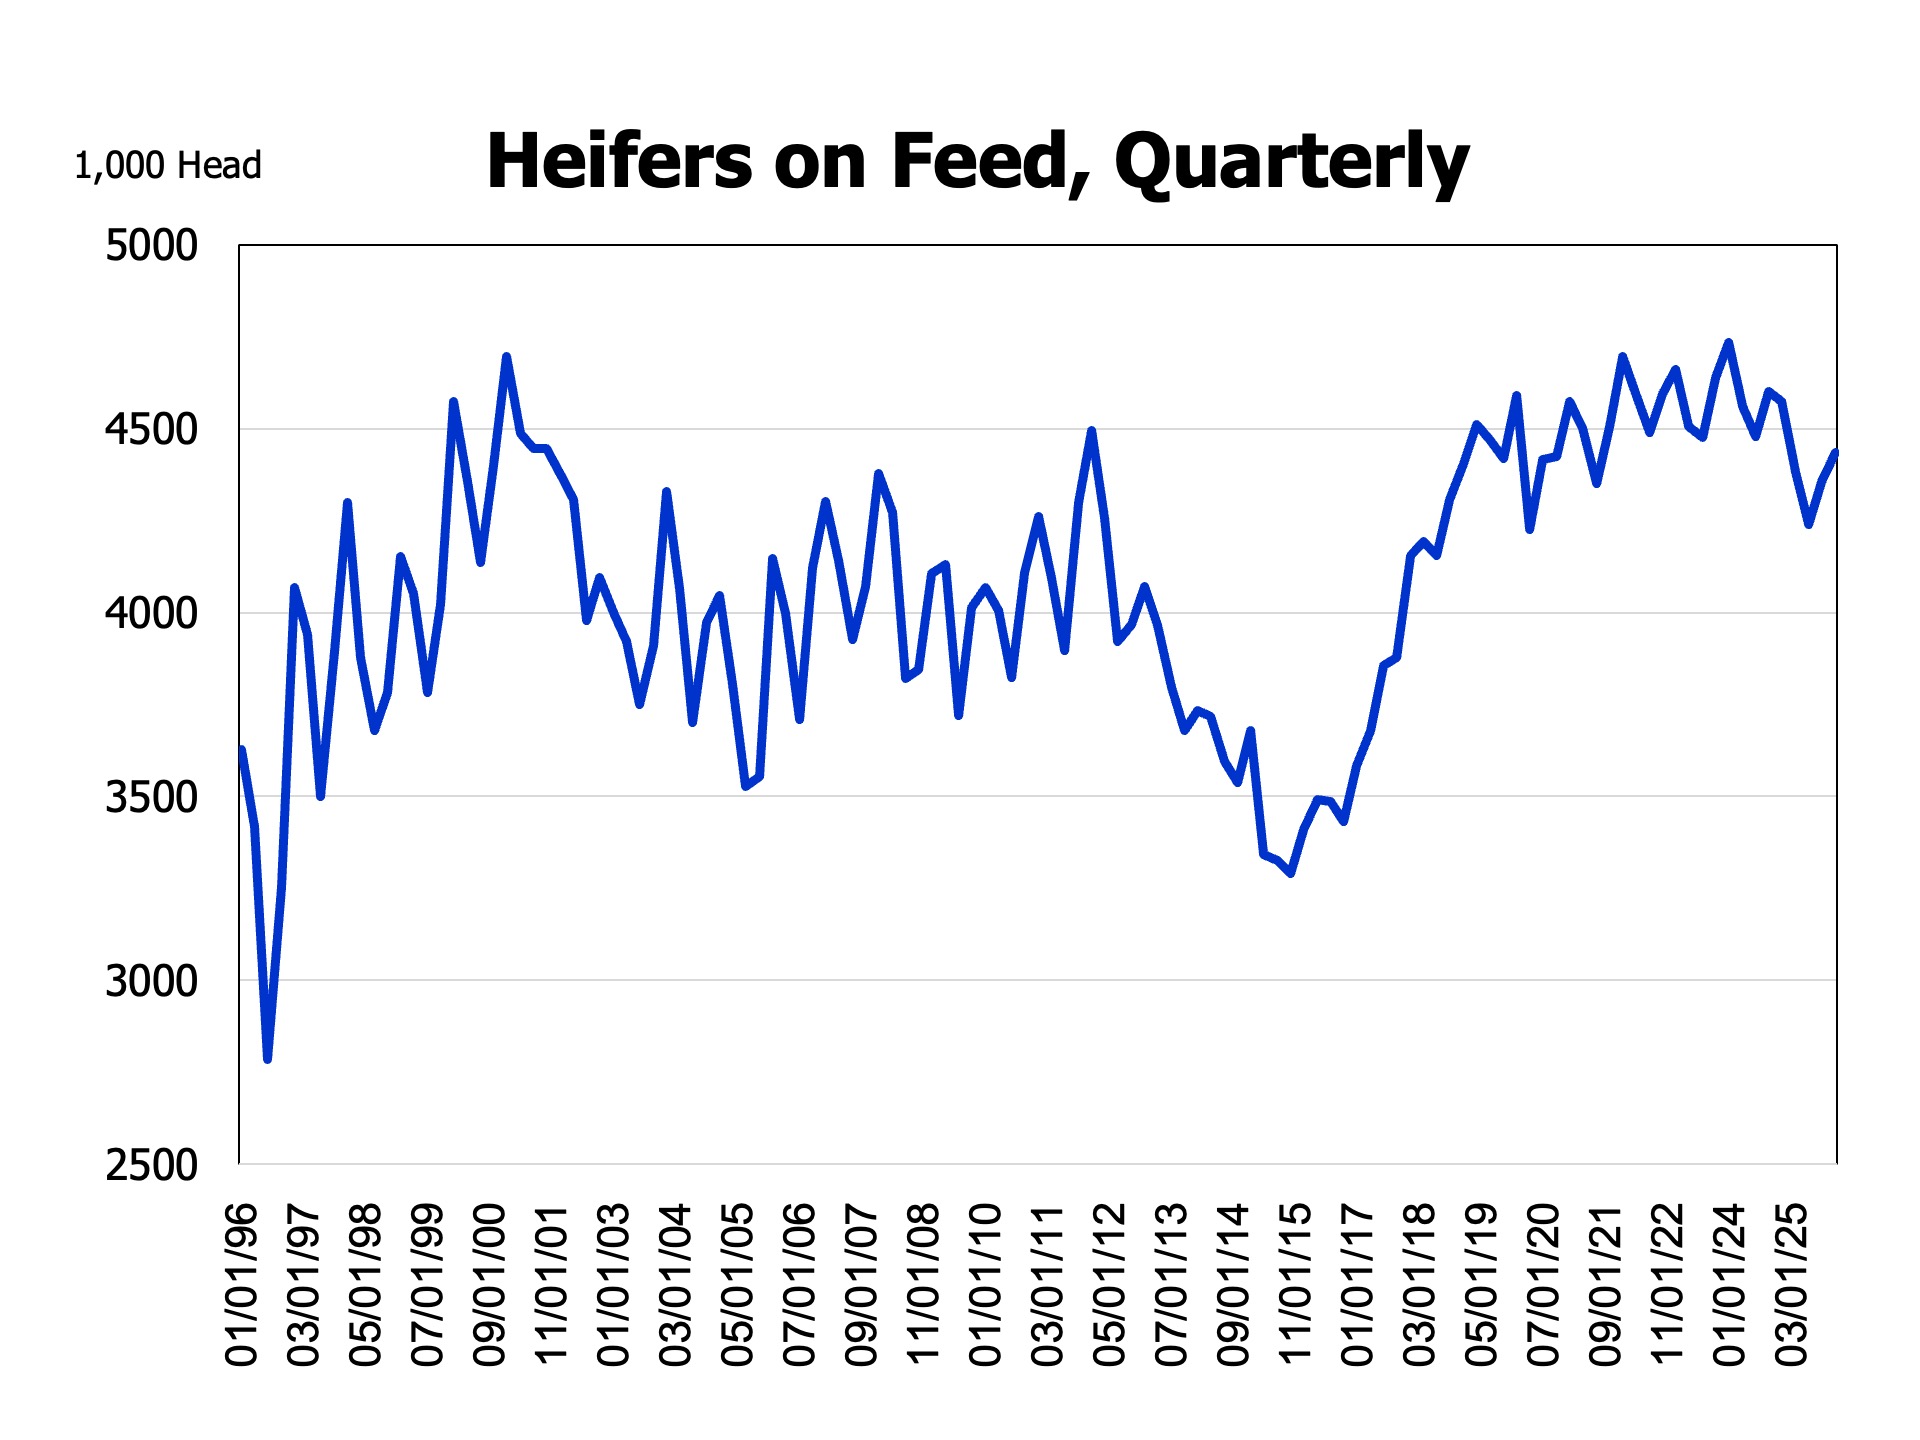
USDA’s Cattle on Feed Report, released on Friday, January 23rd, contained the estimated number of heifers on feed. The breakout of steers and heifers on feed is released quarterly. Many have been looking closely at this statistic for evidence of a significant herd expansion starting.
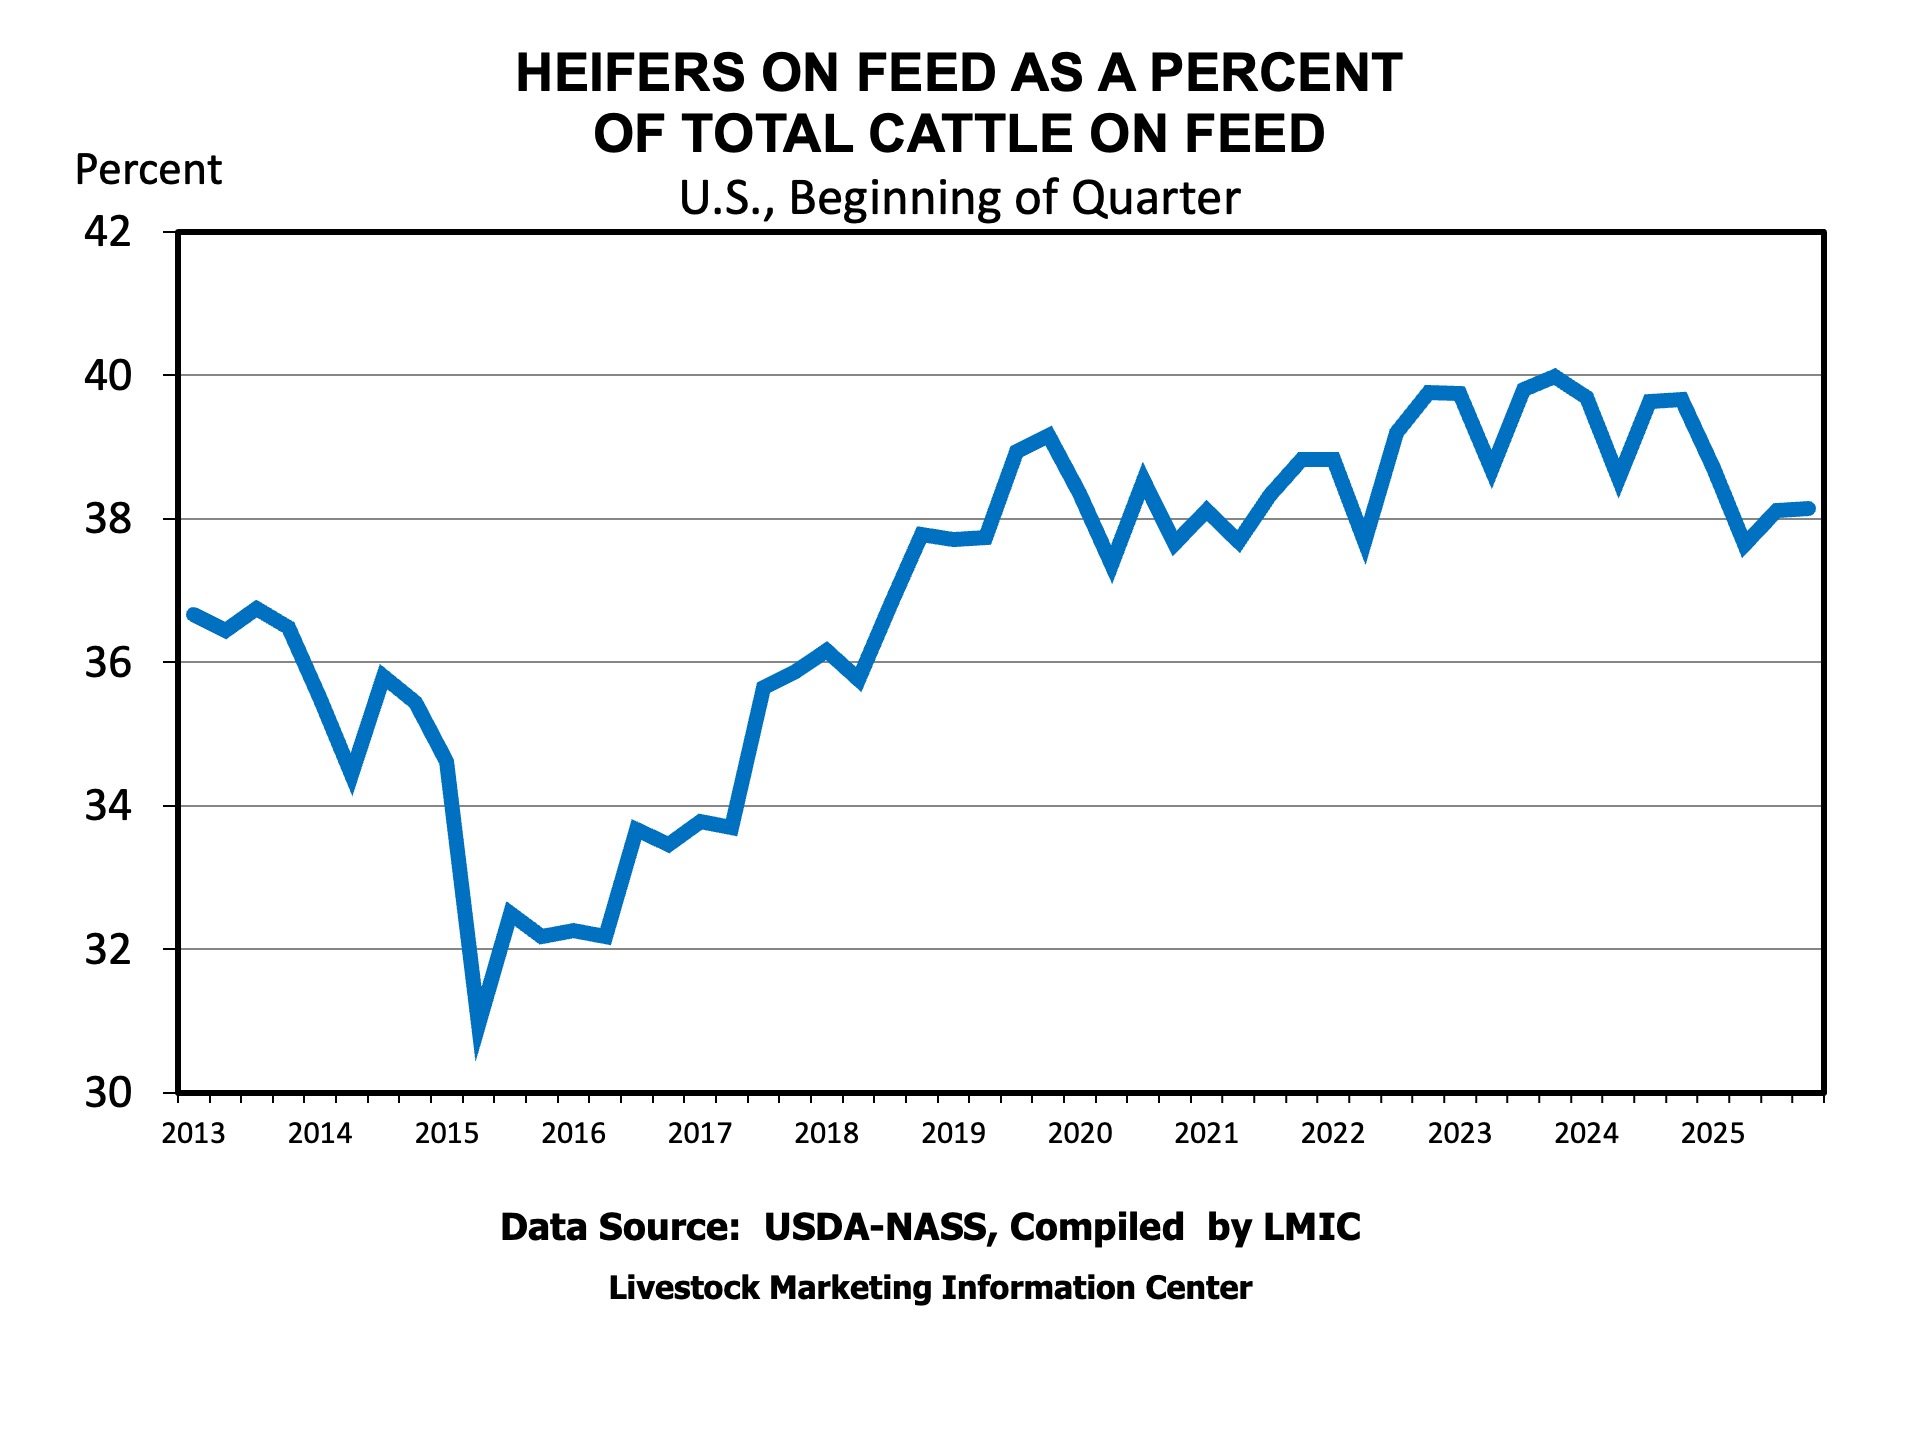
Heifers on feed totaled 4.435 million head, down 140,000 head, or 3.1 percent, from last January 1. The number of steers on feed also declined by 3.2 percent. Heifers represented 38.73 percent of the total cattle on feed, hardly different from last year’s 38.70 percent. It was the fewest January 1 heifers on feed since 2019. Arizona, Colorado, Oklahoma, and Texas had fewer heifers on feed, with Colorado having the largest decline of 85,000 head, followed by Texas, down 55,000 head. The decline in the heifers on feed in those states is interesting in that those states would have been most impacted by the border closure with Mexico. Other states either reported no change or, in the case of Nebraska, 10,000 more heifers on feed.
Spayed heifers imported from Mexico contribute to the total number of heifers on feed. The January Cattle on Feed report is the first full month of comparison to a year ago, with no cattle imports in December 2025 and 2024. Approximately 145,000 fewer spayed heifers were imported from Mexico in the months leading up to January 1, 2026, compared to January 1, 2025. So, the decline in heifers on feed could largely reflect fewer imports rather than a significant decline in domestic heifer feeders being placed.
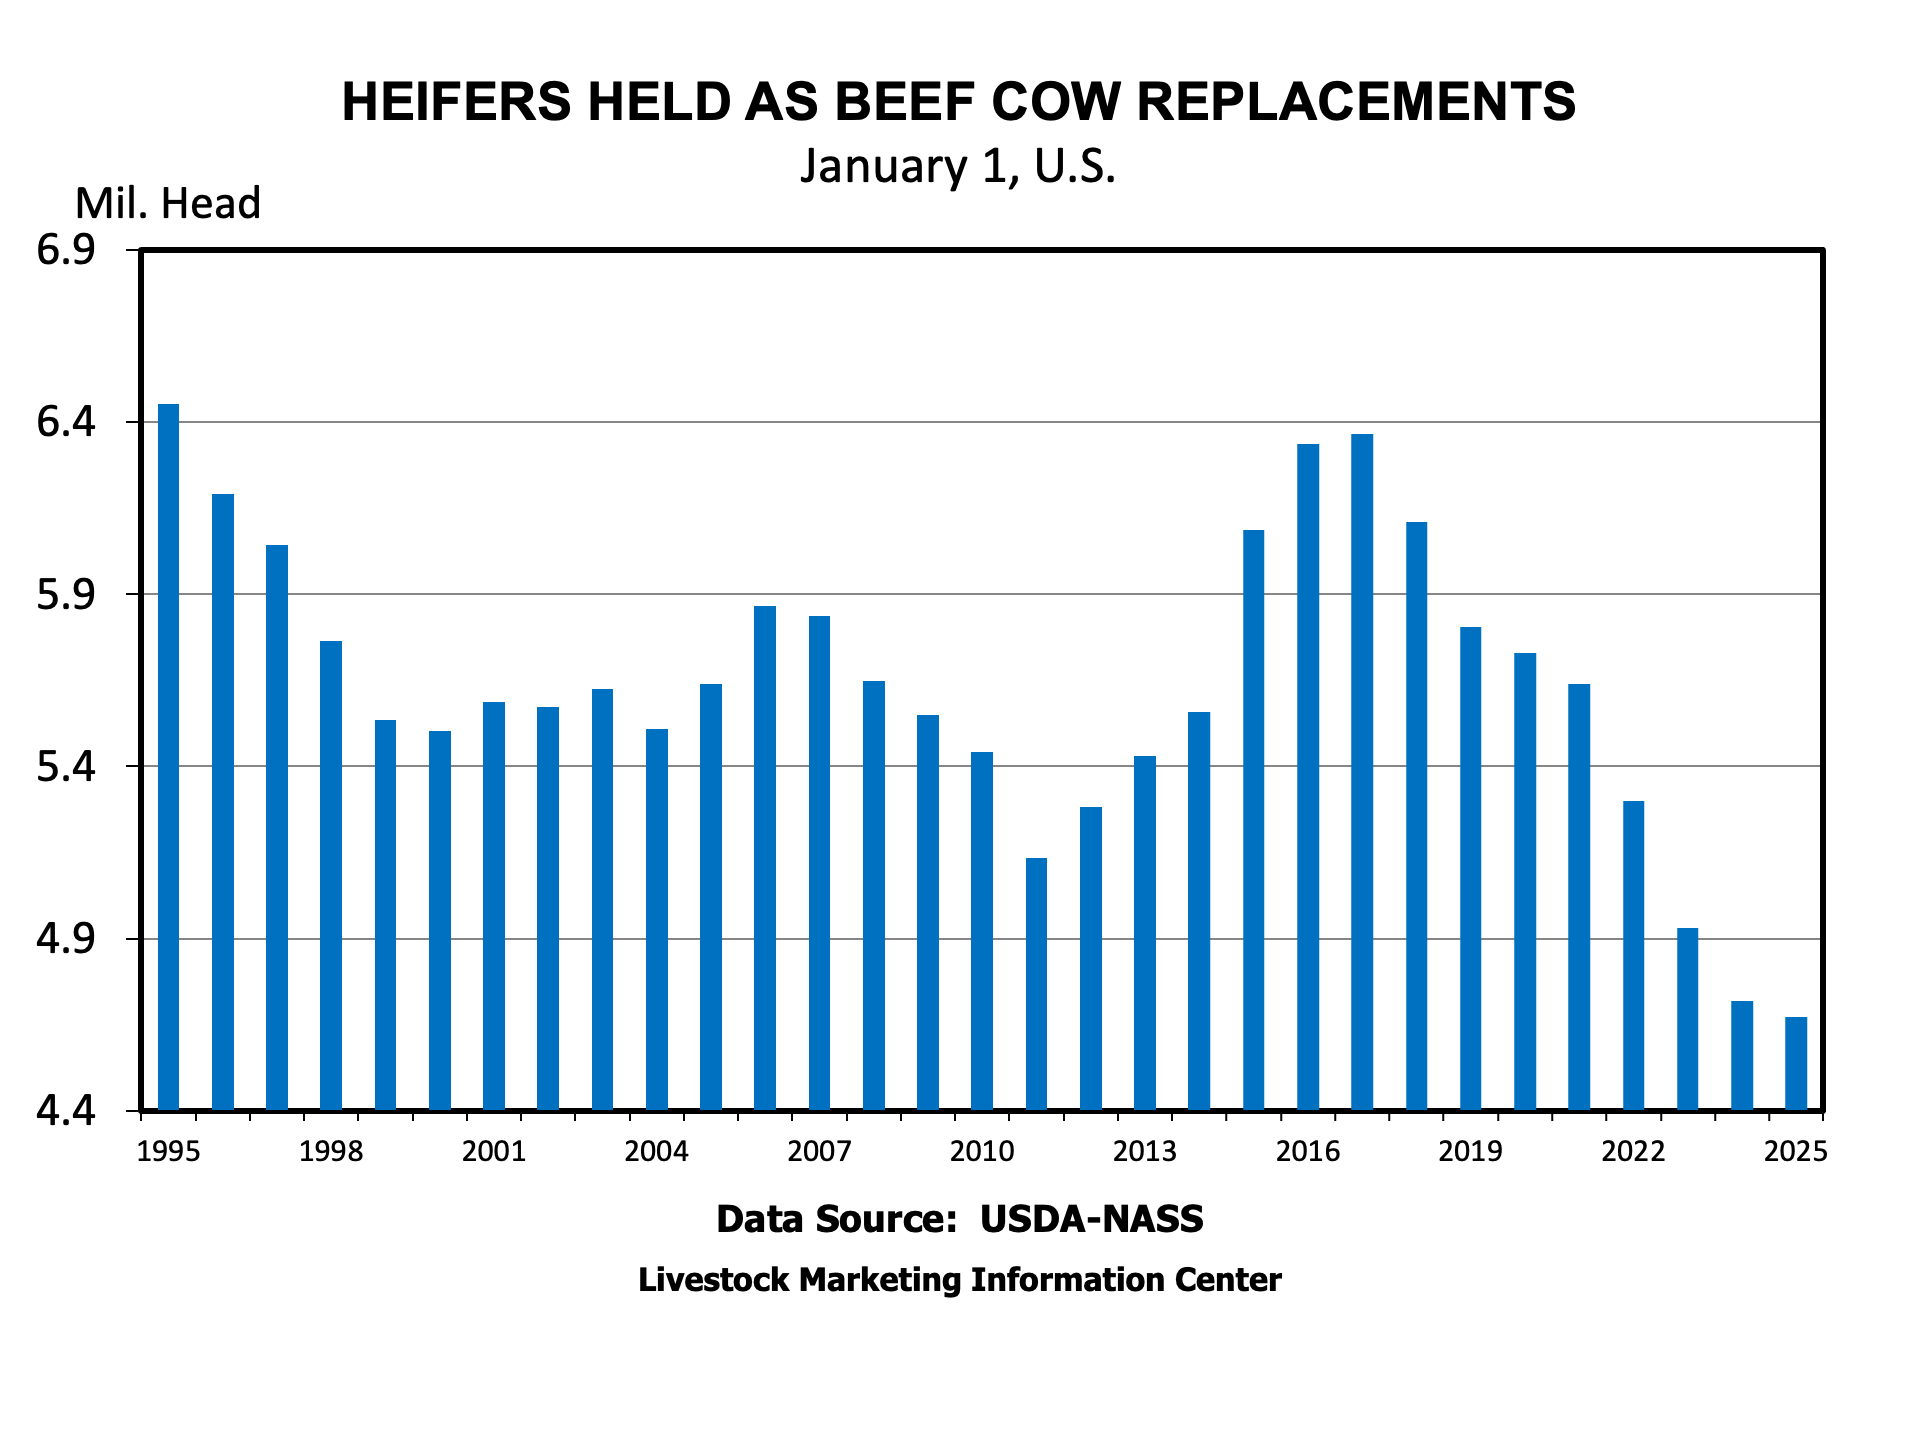
While the decline in heifers on feed suggests some heifers held for herd rebuilding, the reduction in supplies from Mexico and heifers as a percent of all cattle on feed indicates little herd rebuilding from additional domestic heifer retention, yet. It is likely that the inventory report released on the 30th should indicate more heifers held for beef cow replacement.
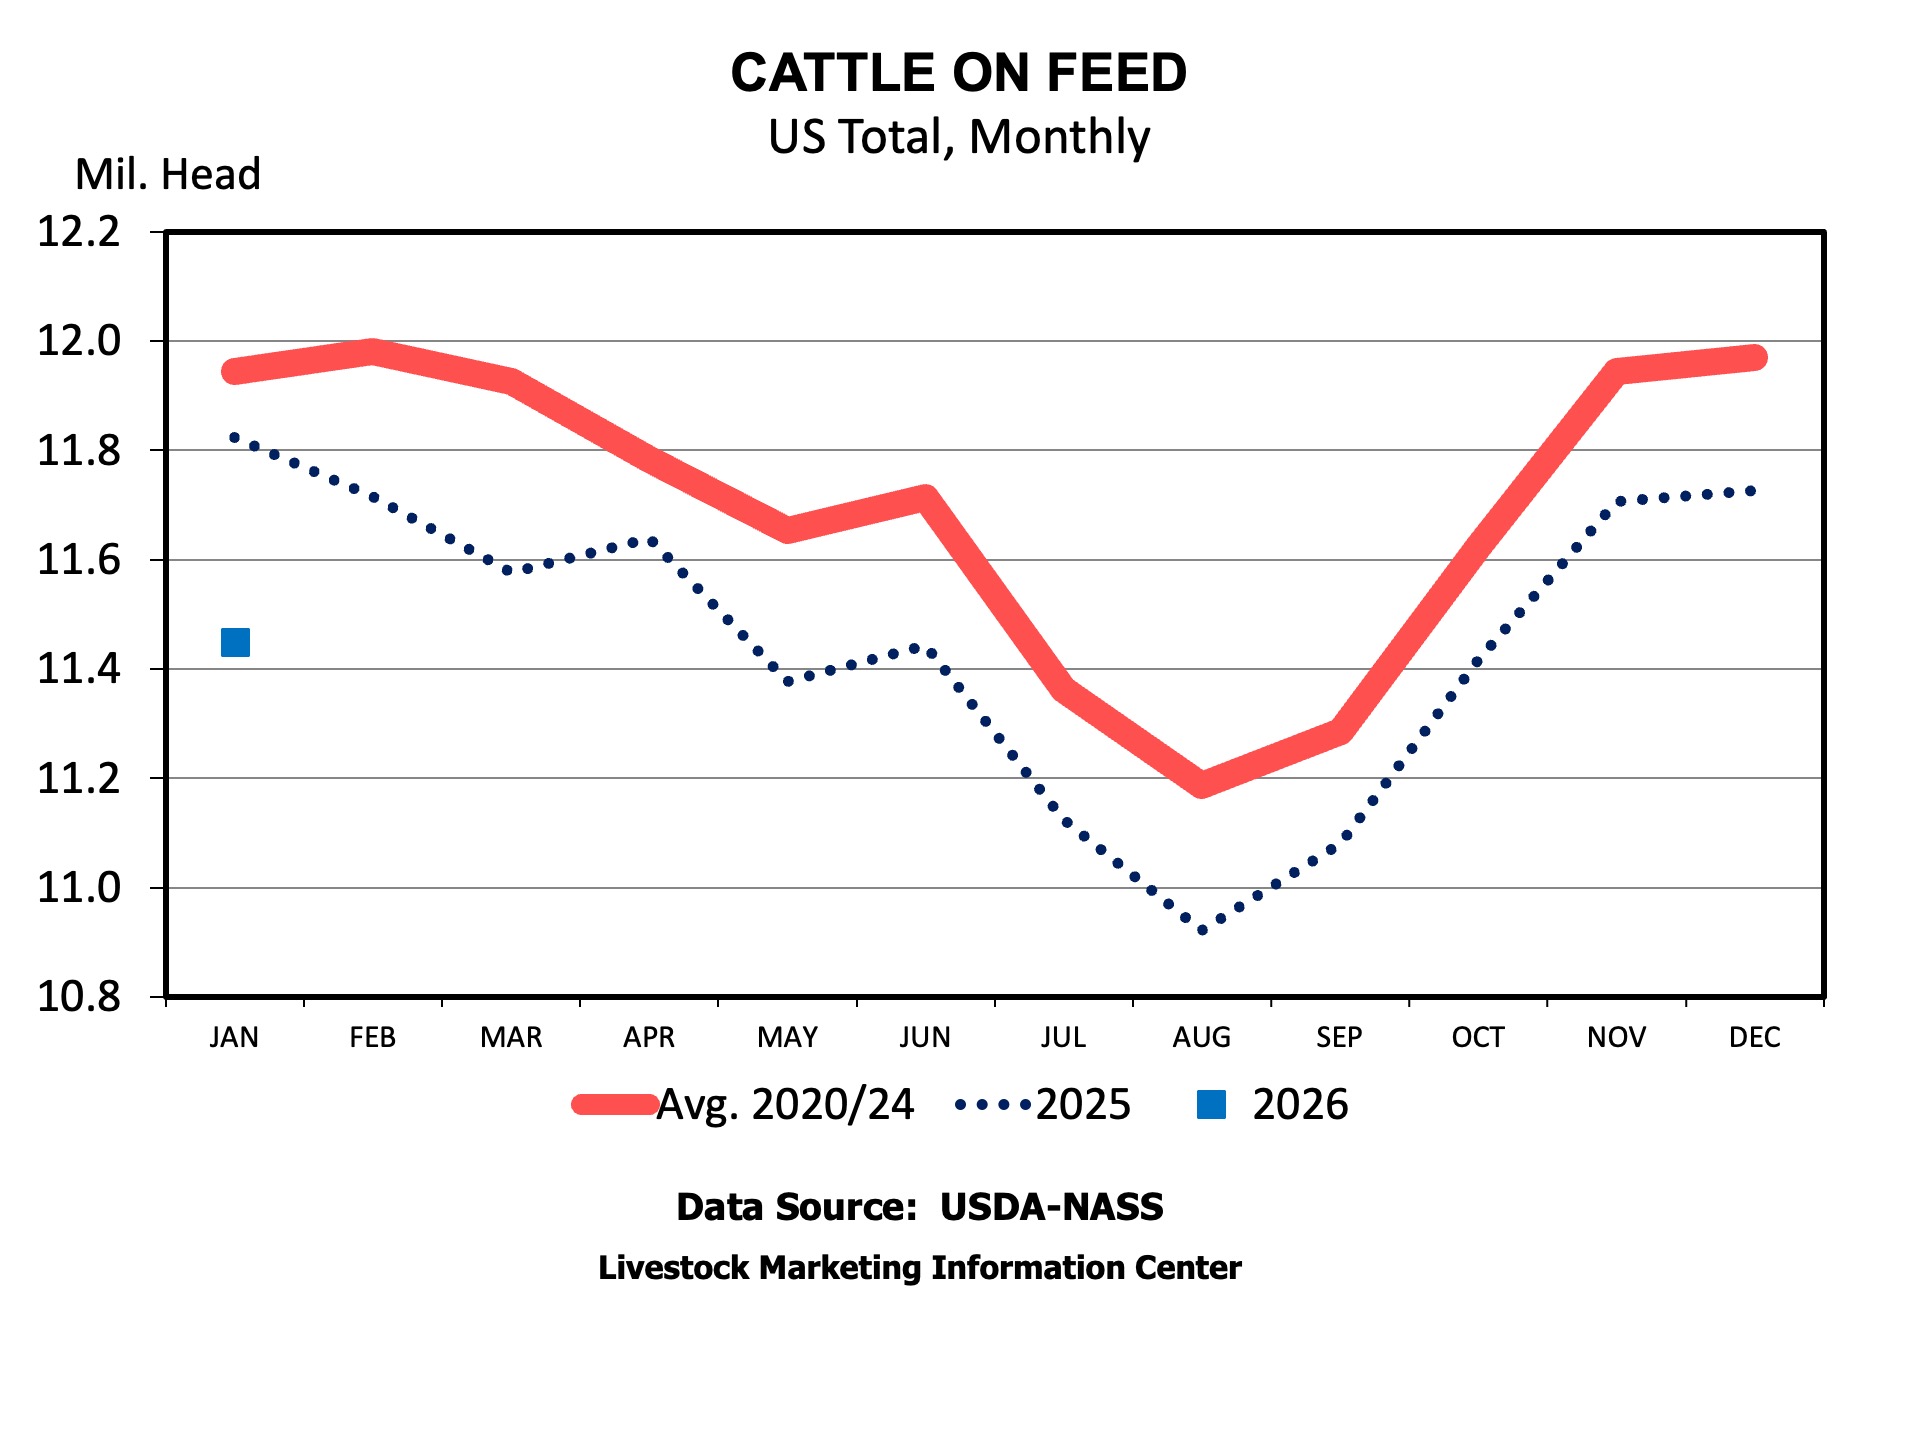
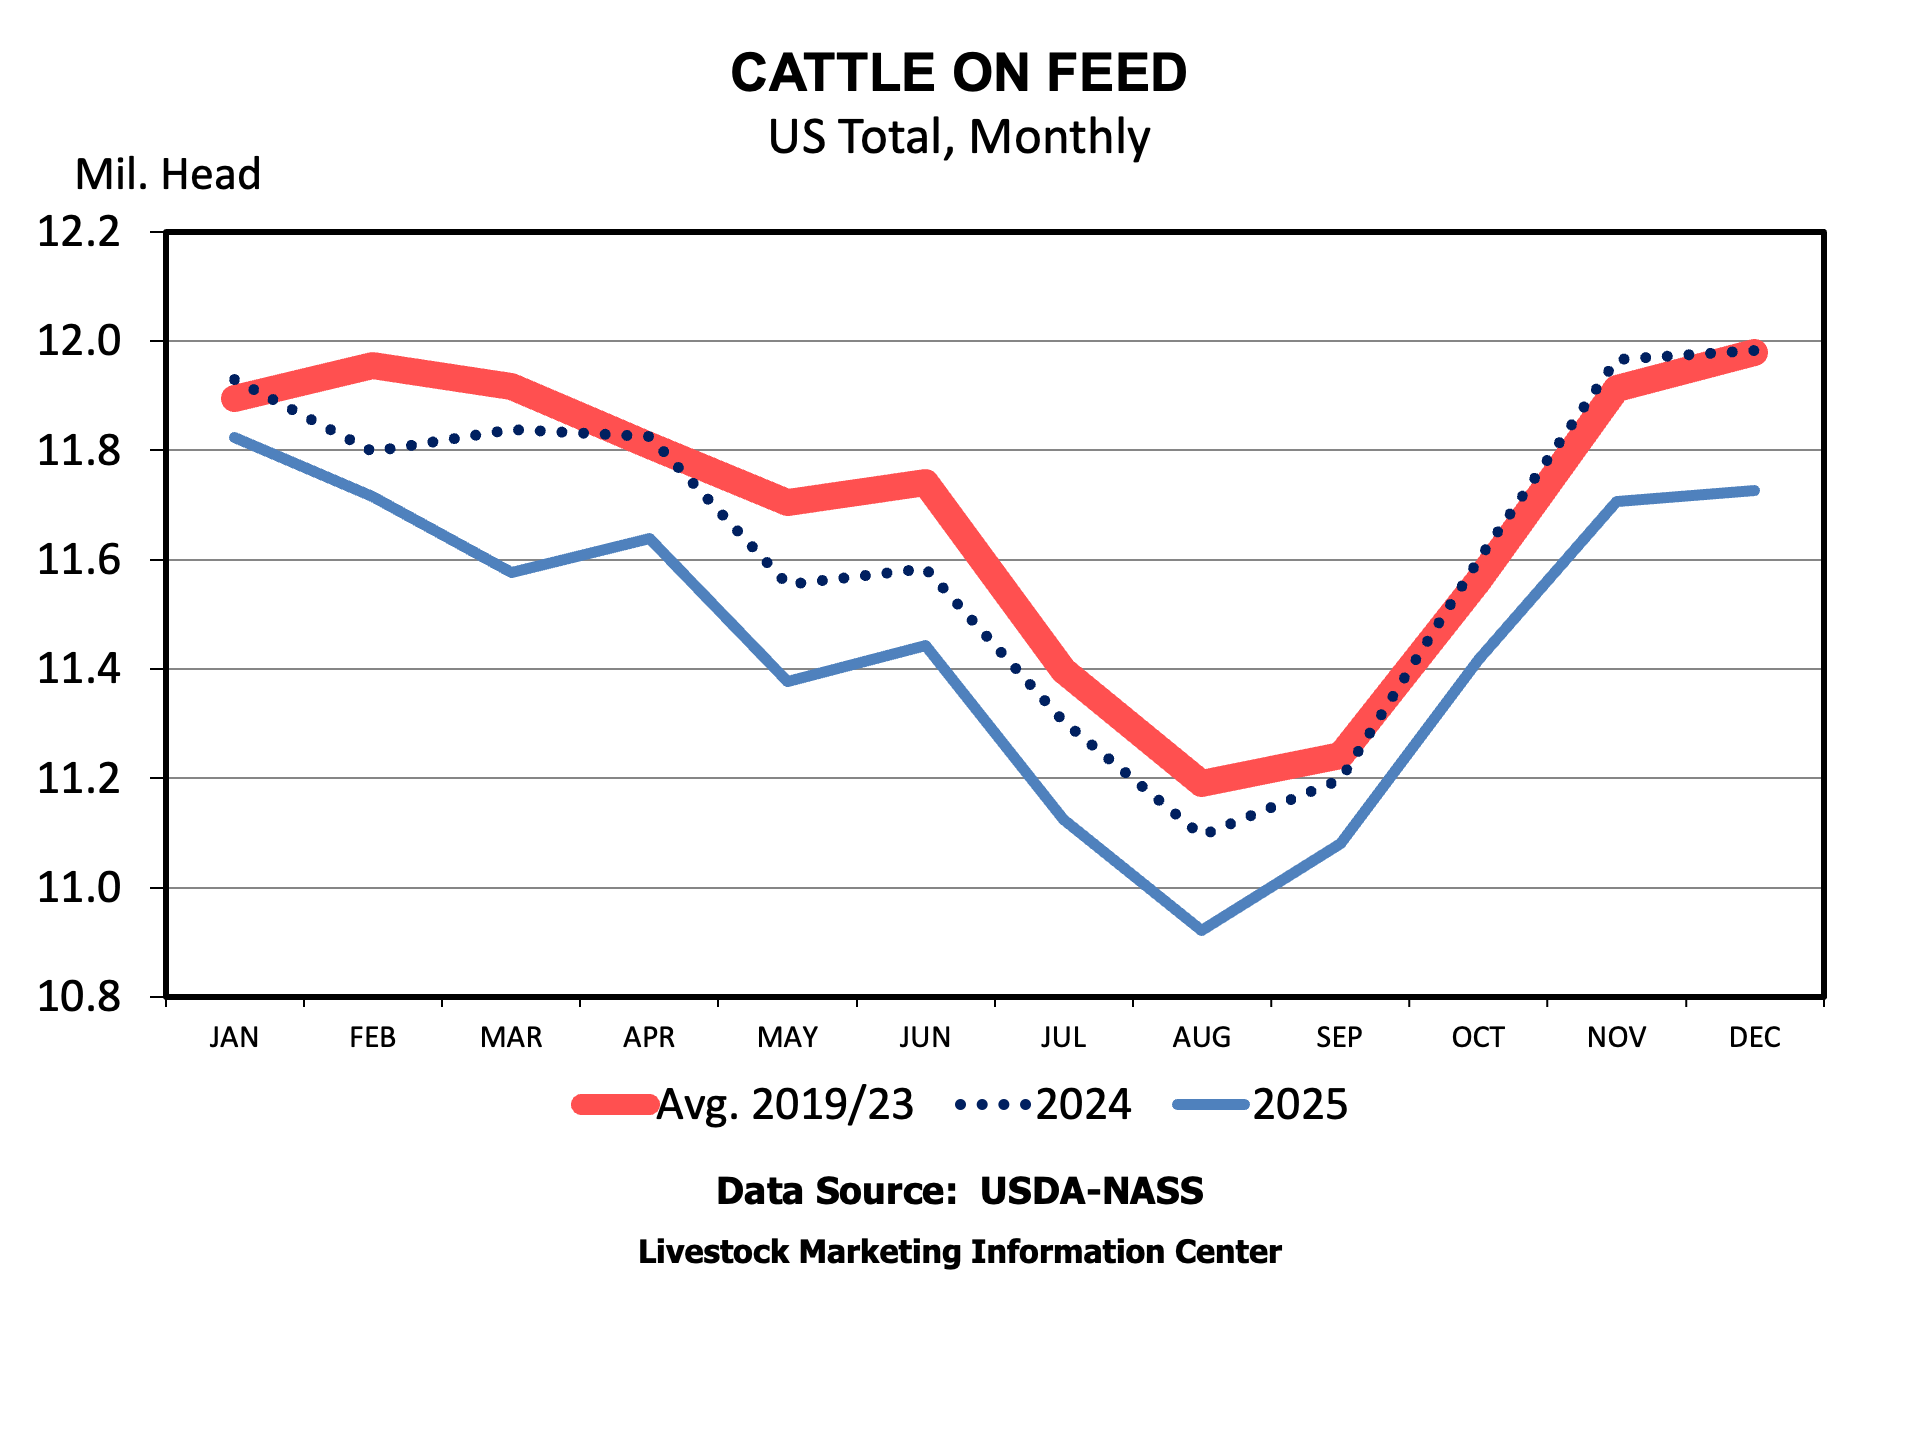
The rest of the cattle on feed largely lined up with expectations. Marketings were up about 2 percent, with one more slaughter day during December, daily average marketings were below a year ago. Placements were 5.4 percent below a year ago. The total number of cattle on feed was down 3.2 percent a year ago. Supplies should continue to tighten this year and into next year, as well.