While some of us might be tired of reading (and writing) about eggs, there is some new data out that sheds some more light on the pace of production recovery. USDA released its Chickens and Eggs report on Friday, March 21st. For eggs, two of the most important numbers in the report are: the number of table egg layers and the number of pullets on March 1st. These numbers tell us where we are currently in short term supplies and where we are headed in flock rebuilding.
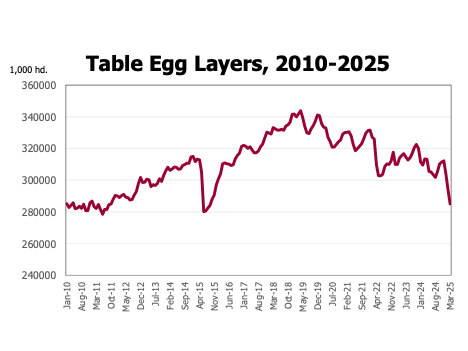
The report indicated that there were 285.1 million table egg layers on March 1. That was down 8.7 million from February 1 and down 28.3 million from last March. It was the fewest table egg layers for any month since October 2015 and the fewest for March 1 since 2011. HPAI continued in full swing during February, far outstripping the ability to replace lost birds.
The number of pullets, young hens heading to egg production, of all types was up 6.8 million or 5.5 percent over March of 2024. About 500,000 more were available than in February. While pullet production facilities have not been immune from HPAI occurrences, their numbers are growing as the industry responds to high prices and short supplies. Beyond the increased number of pullets, more eggs in incubators and eggs per 100 layers running ahead of a year ago indicate some more growing supplies.
On the price side of eggs, many have noted in the last couple of weeks falling wholesale egg prices. For the week of March 22nd USDA-AMS reported egg prices delivered to warehouses of $3.96 per dozen. That is down from the peak of $8.51 per dozen for the first week of March. Egg prices tend to be highly volatile and this data highlights that. Based on data from the chickens and eggs report, it does not appear that growing supplies are driving lower prices. The most likely factor is demand economics. For almost all goods, people buy fewer quantities of an item when its price goes up. It appears that consumers are reacting to record high prices by purchasing fewer eggs which results in lower prices.
The bottom line is that while there are fewer table egg layers currently, increased egg production appears to the on the way. While egg prices are volatile, increased supplies, given a respite from HPAI caused chicken losses, will keep prices trending lower.
Anderson, David. “Chickens Before Eggs.” Southern Ag Today 5(13.2). March 25, 2025. Permalink
This Friday brings the next USDA Cattle on Feed (COF) report. The March 21st report will include data for February and the number on feed as of March 1st. This report comes amid cattle market price volatility and declining fed cattle prices throughout February.
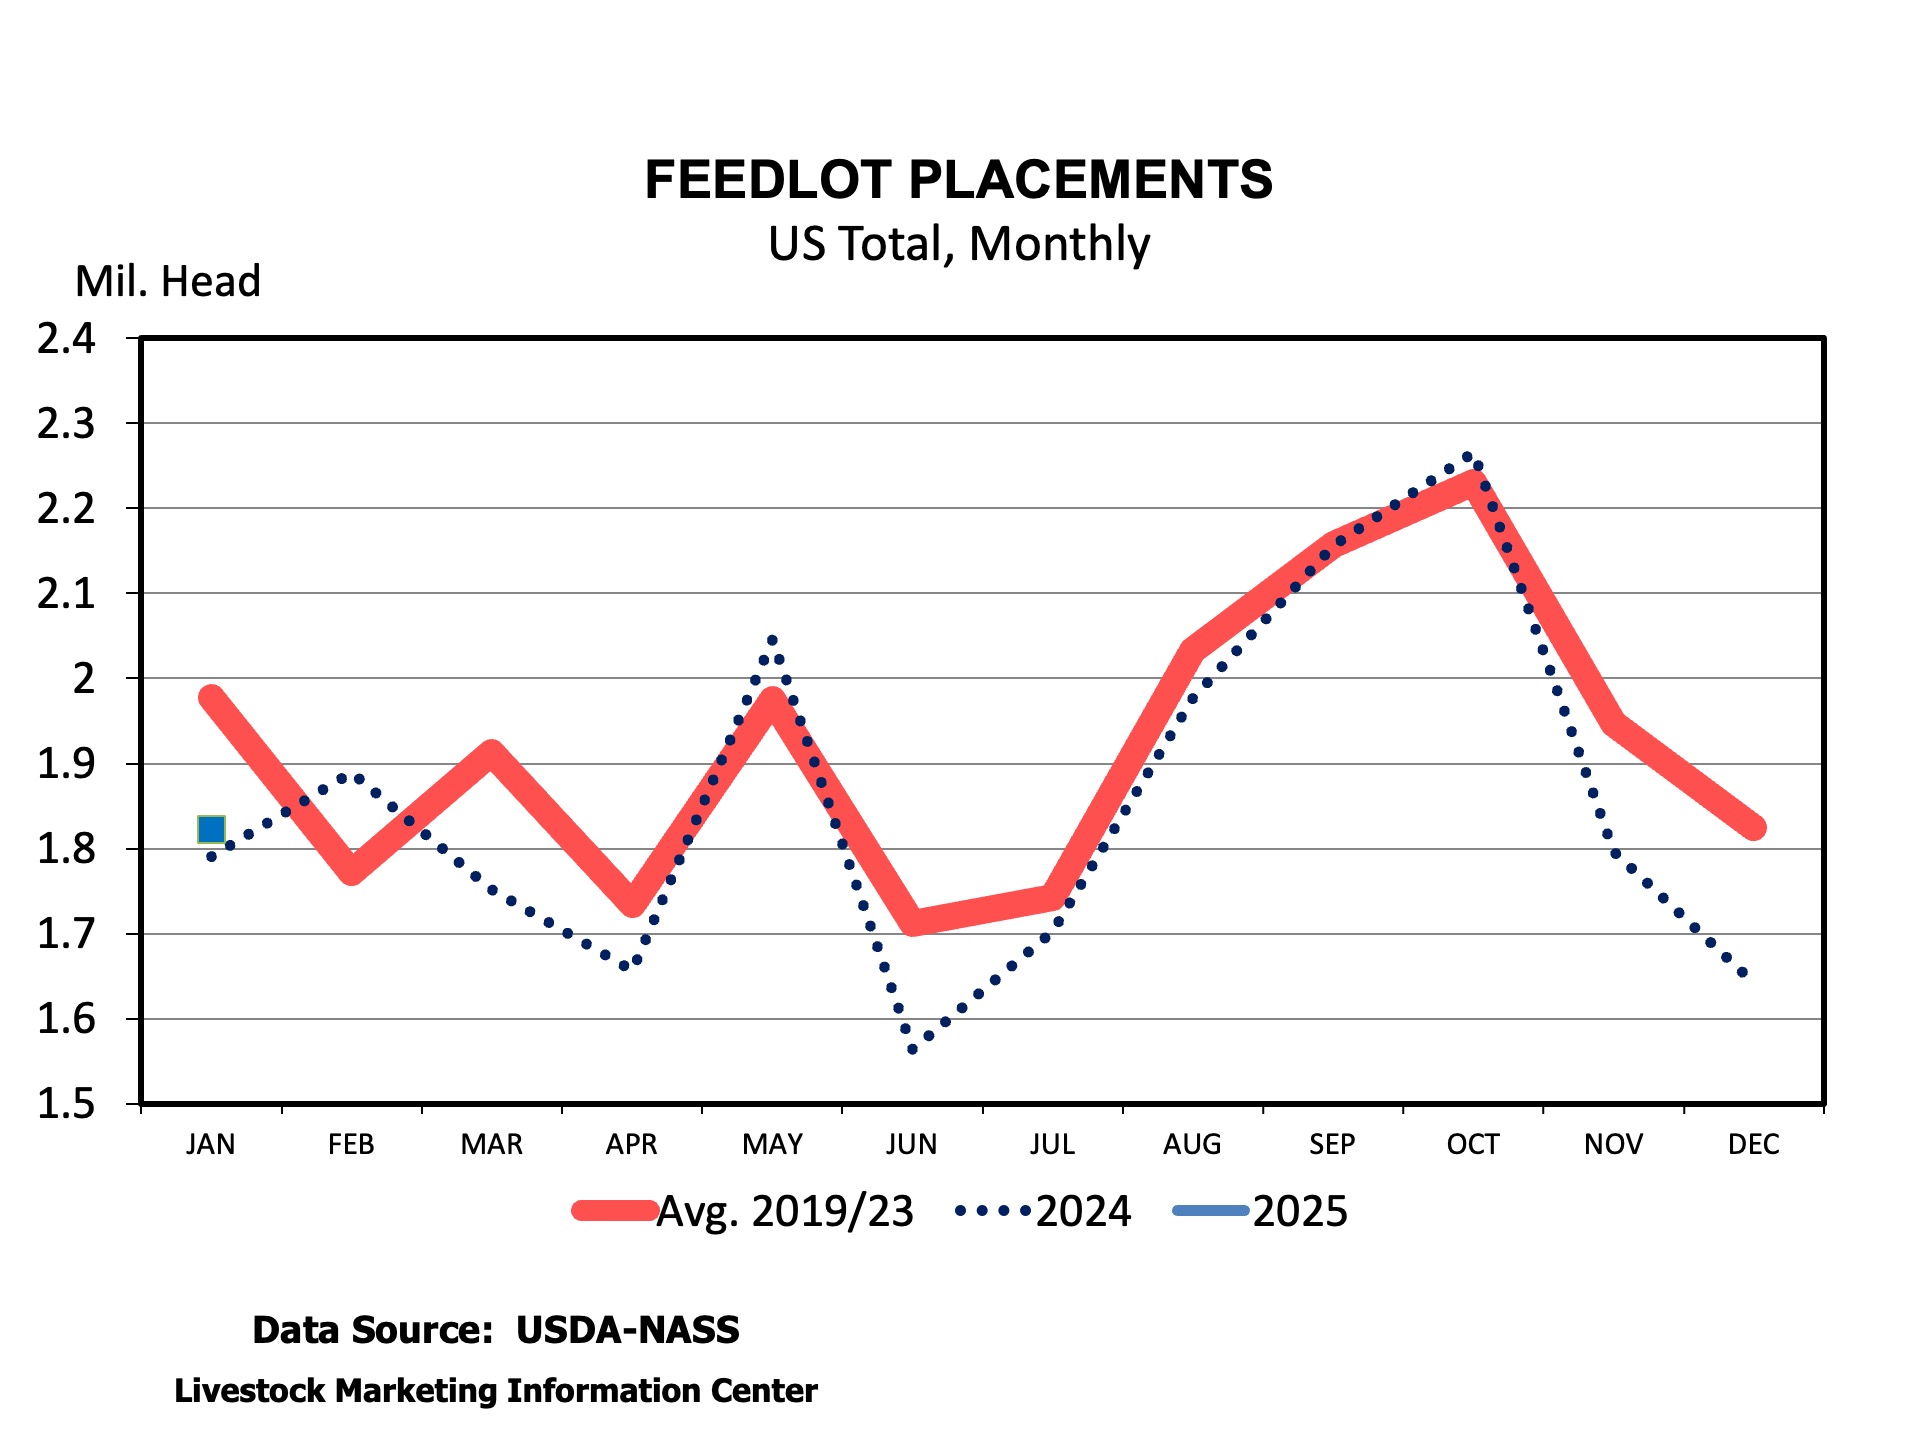
There are three big numbers in the COF report: marketings, placements, and COF. Last year was leap year so there was one less working day in February 2025 compared to last year. Marketings should be about 8 percent smaller than last year. Some of that comes from one less day in the month but, it is also indicative of smaller slaughter rates in February. Placements are expected to be more than 10 percent smaller than last year. One factor is that feeder cattle imported from Mexico only just began to trickle in during the first week of the month. Sharply fewer cattle were reported in the CME feeder cattle index compared to a year ago. Fewer feeder cattle available should be taking its toll on placements. Any slowdown in heifer placements will further cut numbers. Finally, feedlot placements in February 2024 were very large so, normally, smaller February placements will look like a big percentage change from a year ago. That leaves the number of cattle in feedlots more than 1 percent smaller than last year. Some sharp reductions in feedlot supplies have to come sooner or later given the cow herd. This report may provide some evidence of supply contractions.
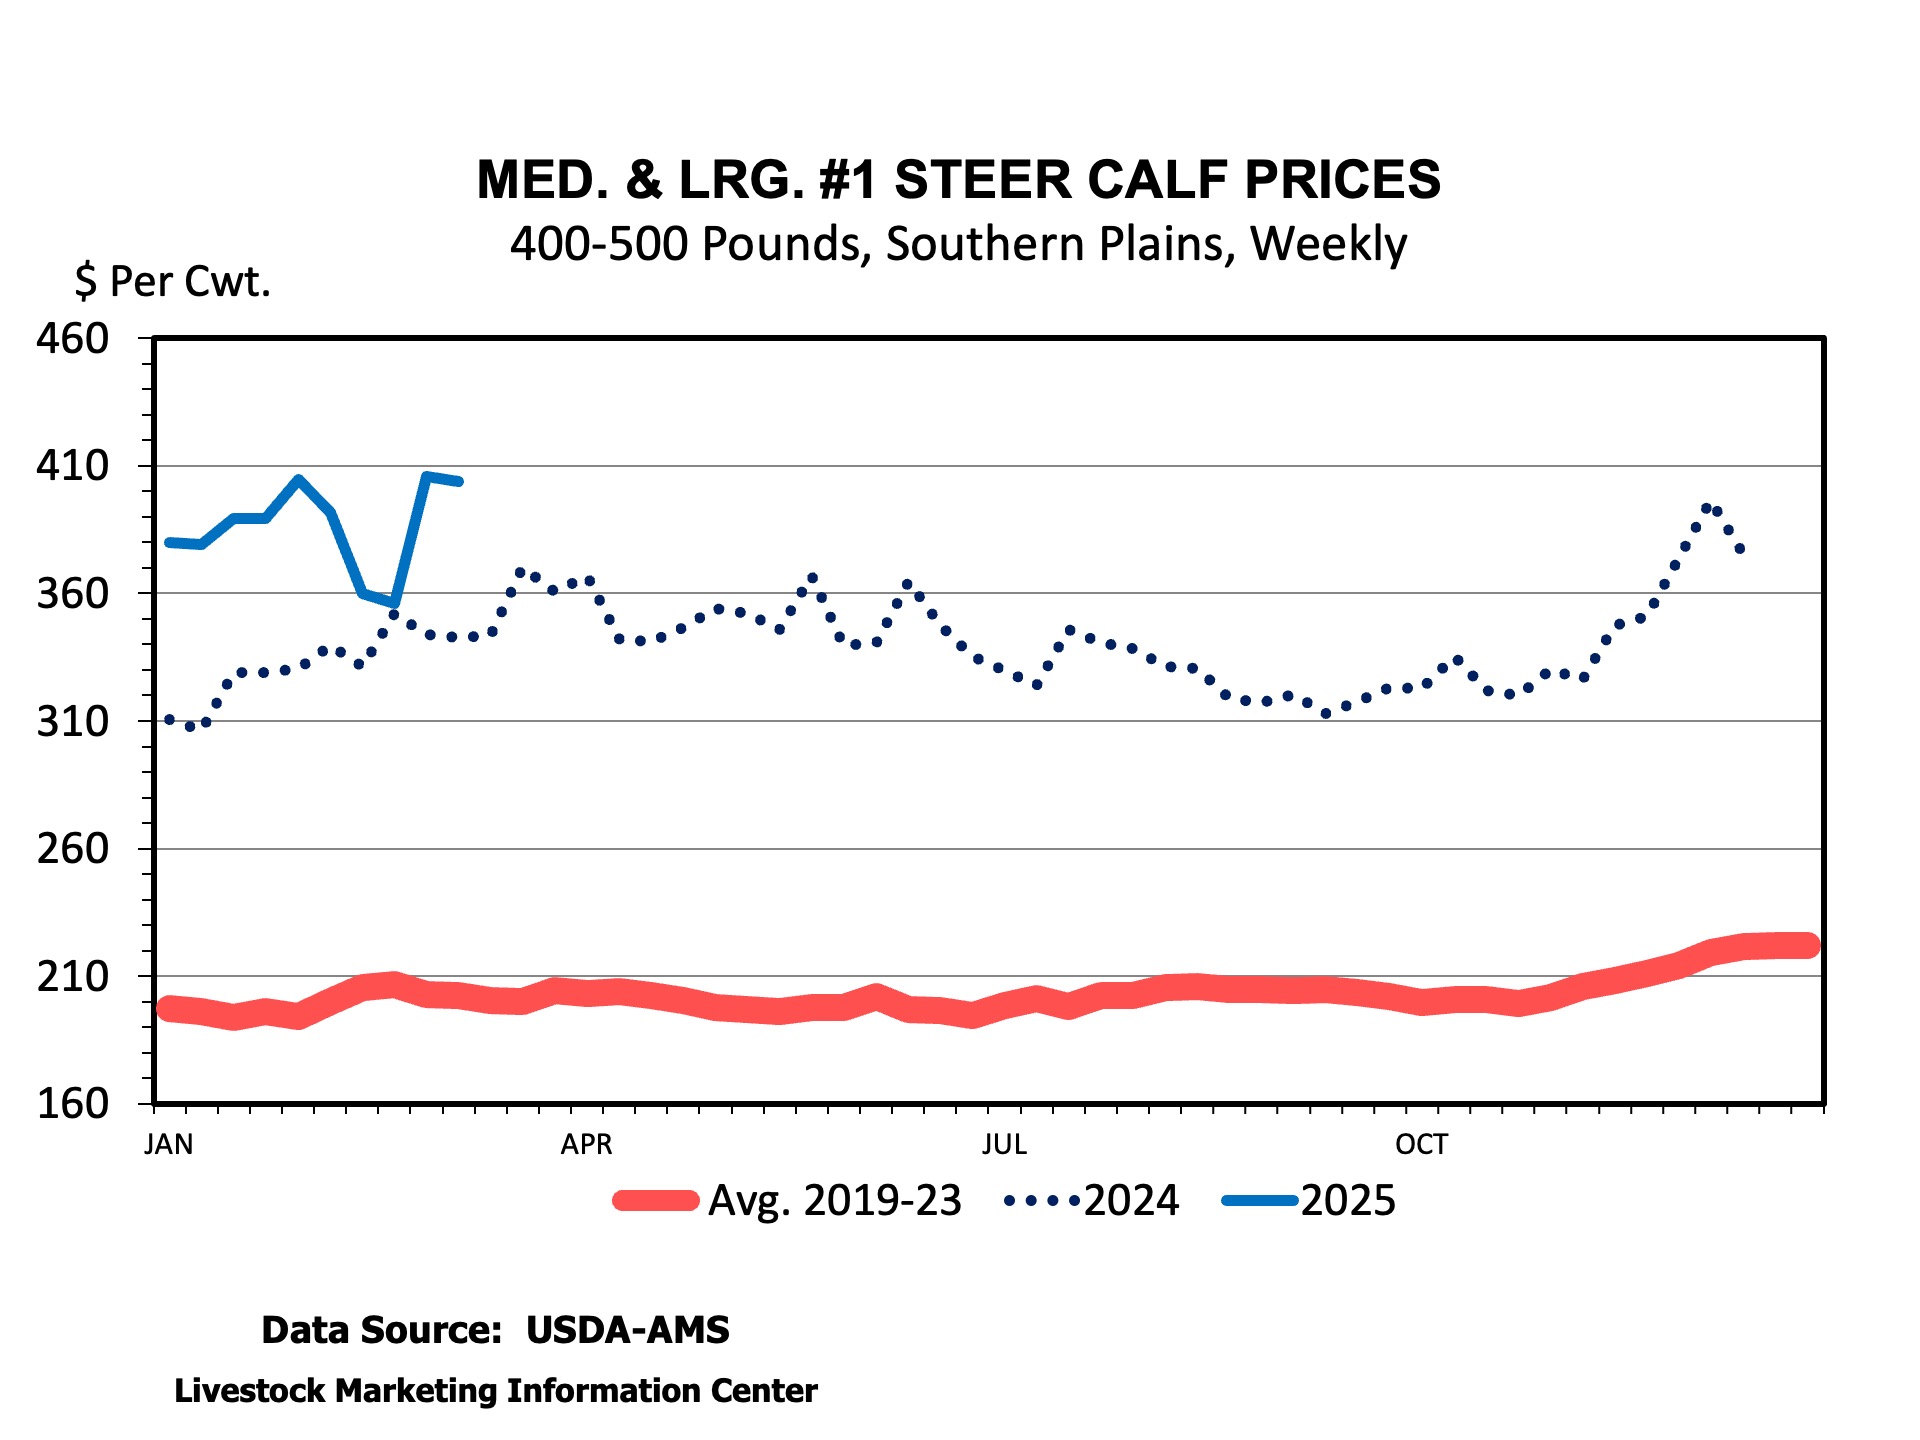
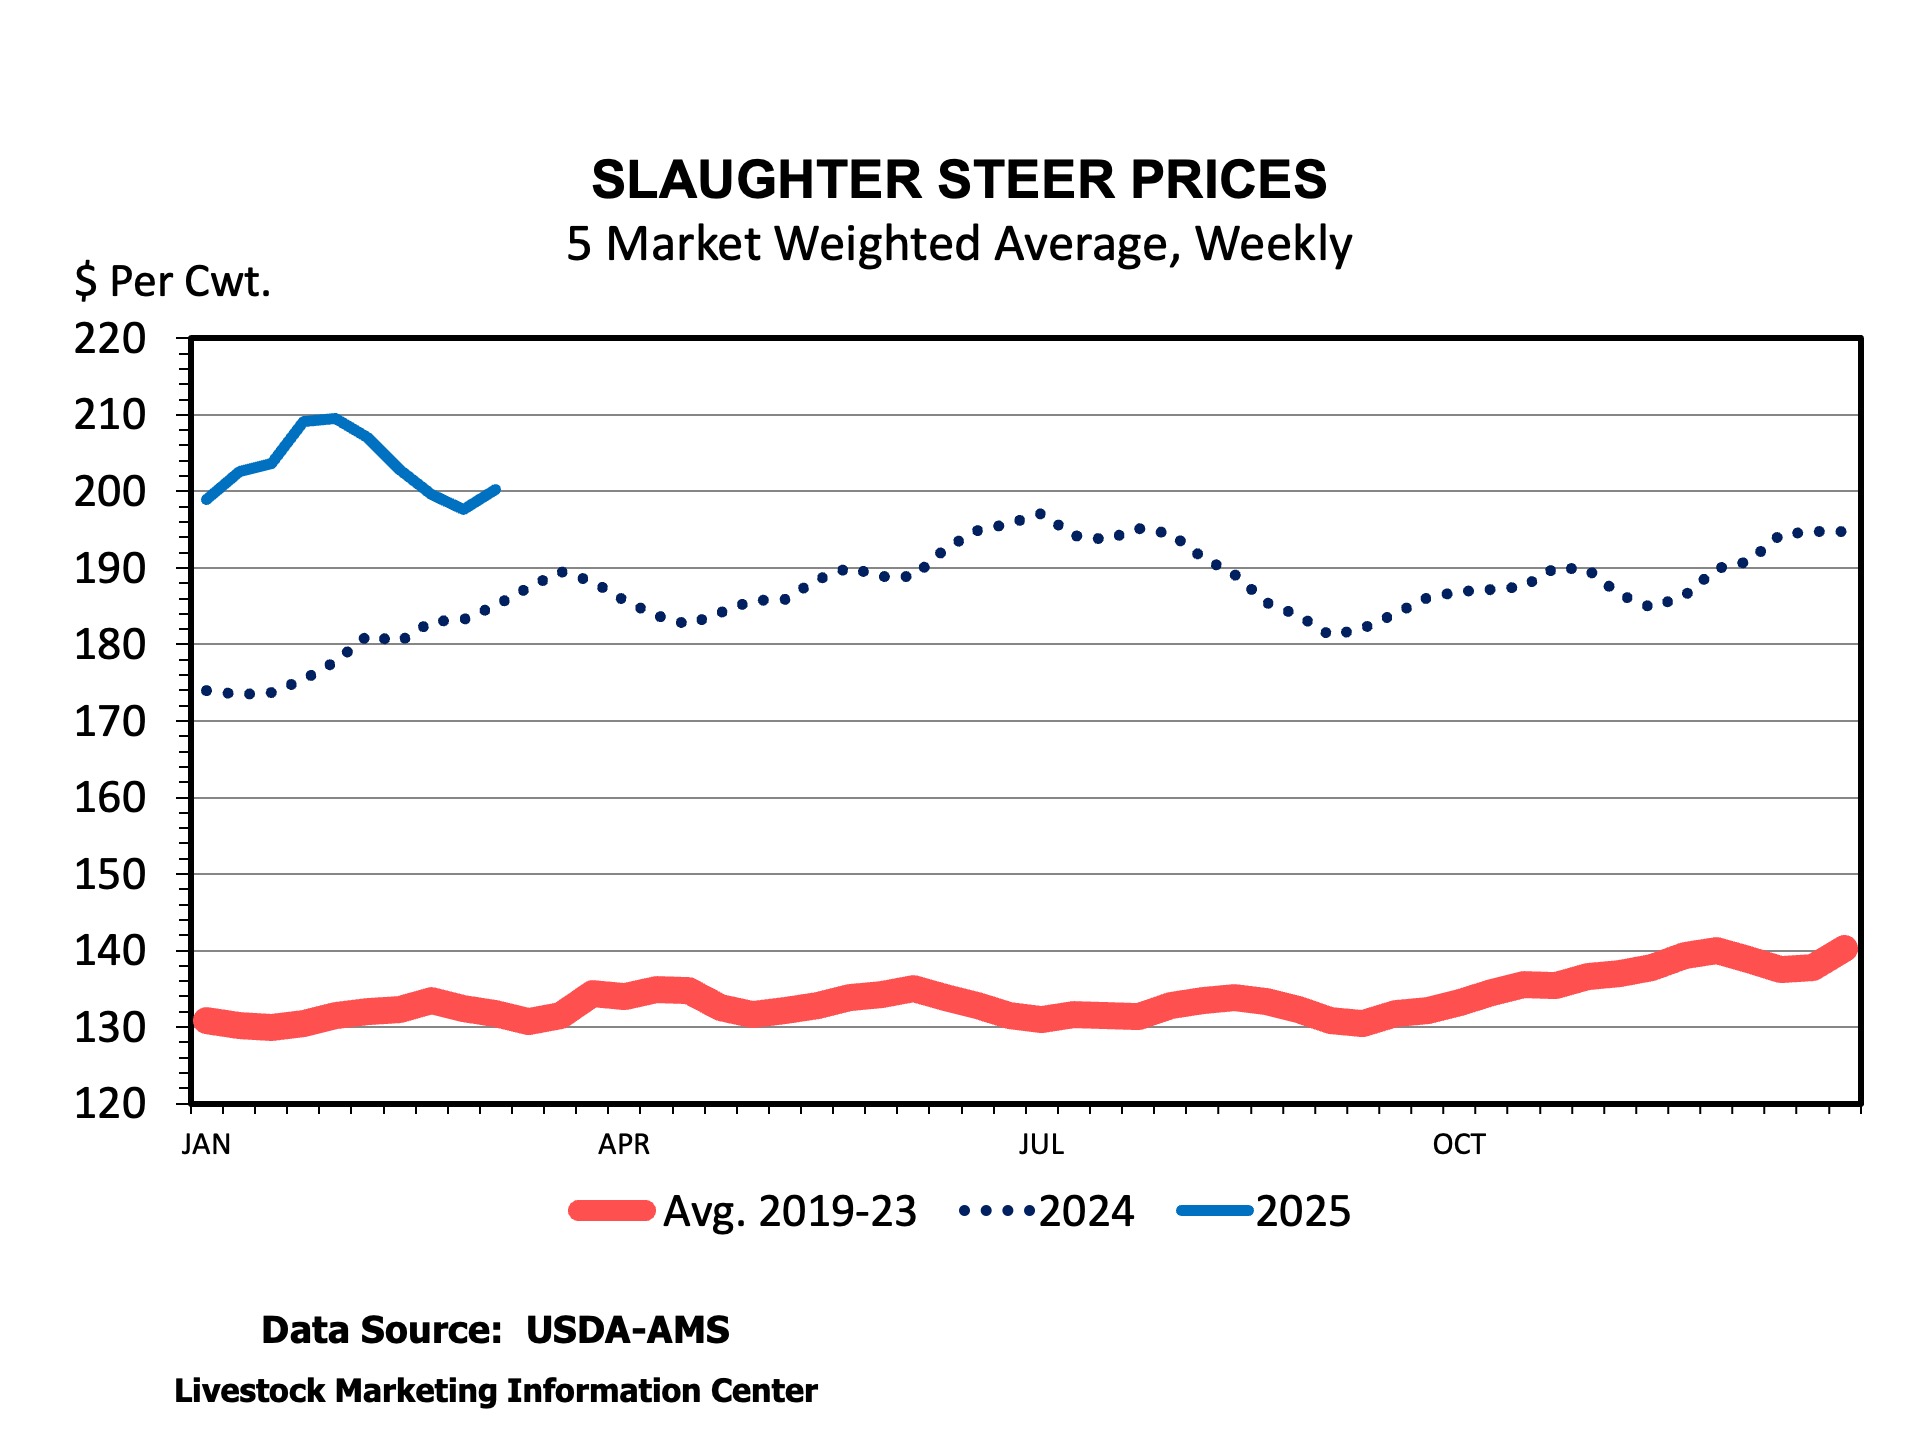
From January 30th to March 6th the 5-market fed cattle weighted average steer price declined from $210.10 to $195.00 per cwt. (the 5-market average price was back over $200 per cwt at the time of this writing). Falling fed cattle prices certainly contributed to lower feeder prices during February. Falling fed cattle cash prices and futures prices may have cut some placements too. February and early March saw swings of about $50 per cwt., down and back up, in 400-500 pounds steer prices. The weekly average Choice boxed beef cutout declined about $15 per cwt over the same time period. Fed cattle weights continue to be heavier than last year, supporting beef production even though feedlot marketings are fewer than last year.
On balance, it’s going to be an interesting report if the number of cattle on feed declines close to 2 percent. The tighter supplies will provide more support for higher prices but, also some more opportunity for price volatility.
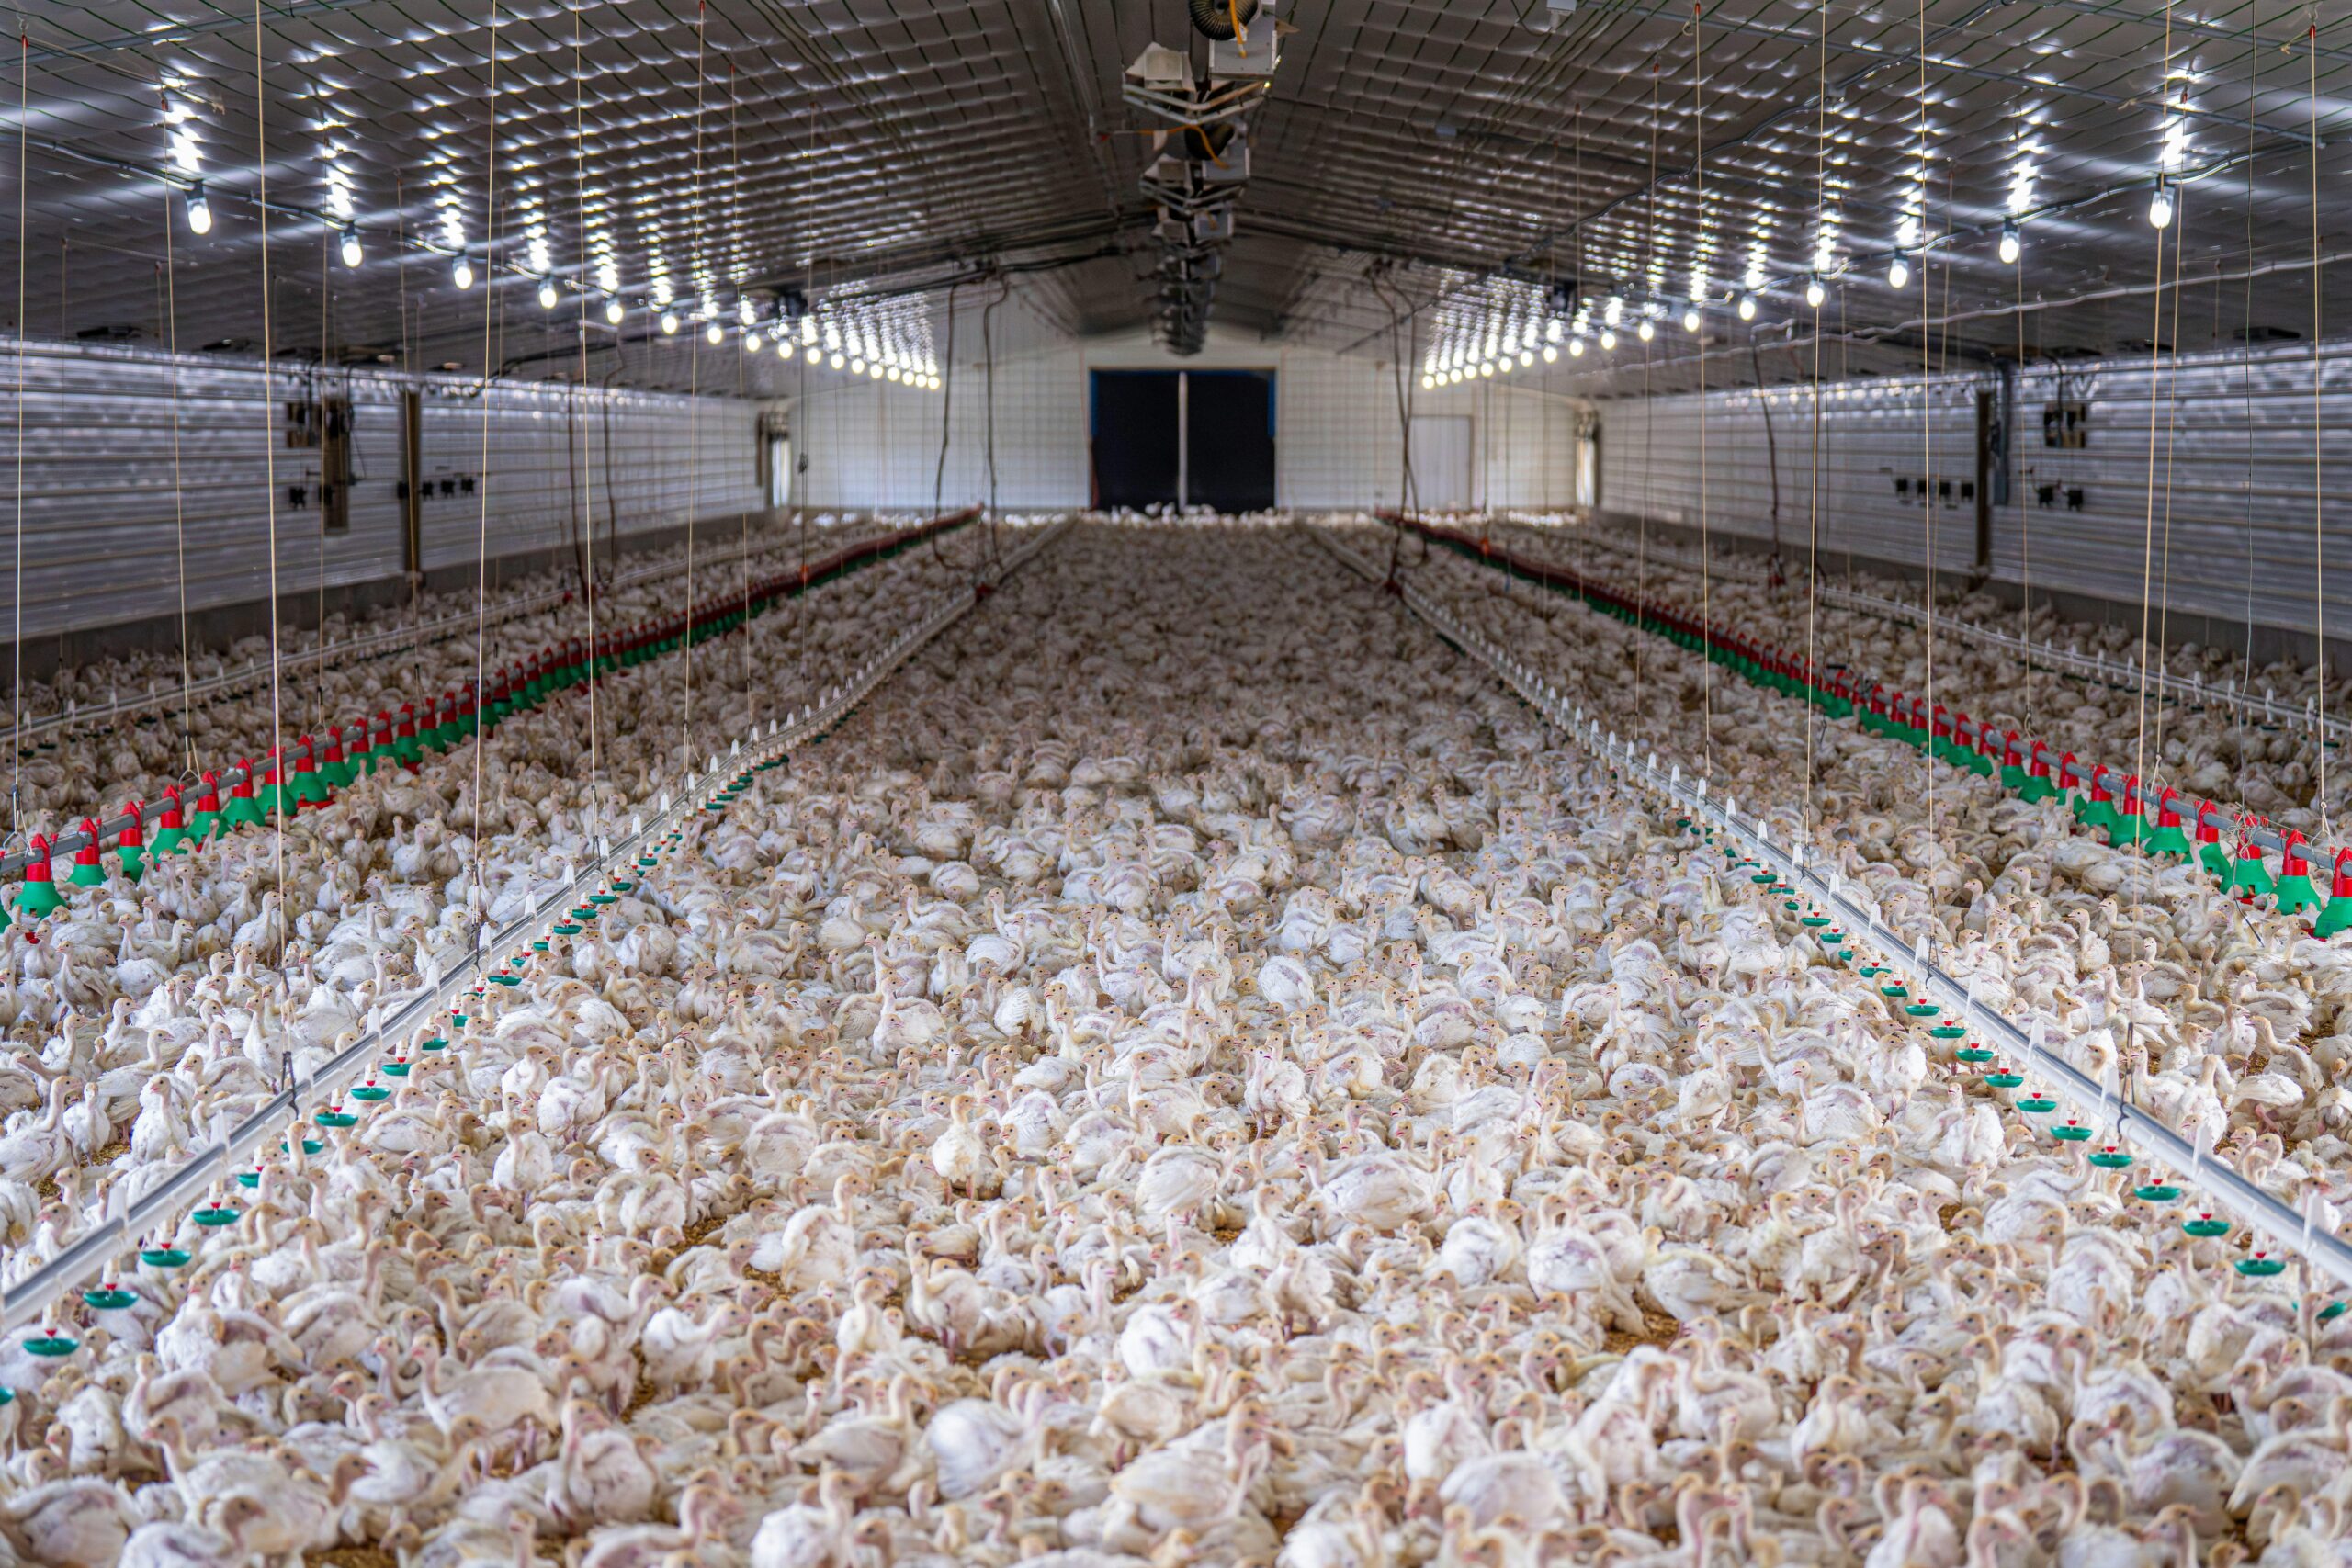
Highly pathogenic avian influenza (HPAI) has been in the news regularly due to high egg prices and limited quantities of eggs on grocery store shelves. These effects have mostly been driven by large numbers of table egg layers depopulated due to HPAI (see Figure 1). Depopulation is “the rapid destruction of a population of animals in response to urgent circumstances with as much consideration given to the welfare of animals as practicable” (USDA APHIS, 2022). Depopulation is a key response to HPAI and other highly contagious diseases for two reasons. First, HPAI is deadly to poultry, causing high rates of death within a matter of days and rapid spread through a flock given even minimal contact. Second, when HPAI is allowed to circulate in poultry populations it can easily spread to other farms and potentially to farm workers. Despite rapid depopulation of farms where HPAI is detected, ongoing exposure threats exist due to virus circulation in wild bird populations.
Currently, HPAI circulates in all four wild bird flyways (Pacific Flyway, Central Flyway, Mississippi Flyway, and Atlantic Flyway) that extend across the Western Hemisphere and overlap into the Eastern Hemisphere. For example, the Pacific Flyway overlaps the East Asian and Australasian Flyway. This overlap created the origins of the 2014-2015 Eurasian H5N8 HPAI outbreak in the U.S. from migratory birds moving along the Pacific Flyway (USA APHIS, 2016). HPAI strains mutate rapidly, and most recently in 2024 H5N1 HPAI spilled over into dairy cattle. However, dairy cattle are less susceptible with much lower rates of inflection within herds (<10% of cows), less significant clinical signs, and very low rates of death (AVMA, 2024). This has allowed dairies to isolate and quarantine infected dairy cows until they recover and can be cycled back into production, barring any complications in the cow’s recovery. As a result, depopulation has not been pursued for HPAI control in dairy production. Rather there is a greater interest in the use of vaccination, which is still in the development process and is not commercially viable at this time.
There are other highly contagious diseases for which depopulation would likely be used to reduce disease spread. The first example is foot-and-mouth disease (FMD), which has not been found in the U.S. since 1929 but circulates in wildlife and livestock populations in other parts of the world. Unlike HPAI, FMD has a low rate of mortality. However, FMD has a very high (almost 100%) rate of infection from relatively low exposure and rapid spread through herds. FMD is also a hardy virus that lingers in an environment for some time. For that reason, FMD is another disease for which the baseline response is depopulation of infected animals.
The second example is African swine fever (ASF), which is also highly contagious with high rates of spread, as well as serious clinical signs and high rates of mortality among young pigs. ASF response would also likely involve depopulation of infected herds. The danger of ASF to swine industries was highlighted by the outbreak in China in 2018. China is the largest swine producer in the world, and also the largest pork consumer. The estimates of the Chinese swine herd that died or were depopulated due to ASF were reported as 40.5% with a 39.3% decline in the breeding herd (Ma et al., 2021); for perspective, the 12.3 million head death loss in China’s breeding herd was roughly twice the size of entire U.S. swine breeding herd in that same year (6.17 million head). In the following 2 years, as the herd was rebuilt, China depended heavily on imported pork from a variety of trading partners. Neither FMD nor ASF are zoonotic diseases, with the potential to spill over into humans, and neither FMD nor ASF is currently in the U.S.
Depopulation is expensive, with depopulation costs associated with the destruction of animals, the disposal of contaminated carcasses, and the indemnities to compensate producers for depopulated livestock or poultry. However, this is offset by some benefits, mainly associated with maintaining consumer confidence in the safety of the food supply as well as maintaining access to international markets. For an industry that exports a significant amount of meat or animal product into the world market, the loss of export market share can be very expensive. However, if outbreaks can be constrained geographically export losses can be minimized through the application of regionalization. Regionalization is a general term for allowing trade to continue from disease free areas. Regionalization requires transparent reporting of the disease and eradication measures, which typically includes extensive quarantine, movement restrictions, depopulation of infected premises, and surveillance. Bilaterally, trading countries can place regionalized trade bans of different extents and durations, which could be a control zone within 20 km of an infected herd, a county, or a state or multi-state region. A national trade ban can occur, but is used by fewer countries where proof of geographic containment can be provided.
Most recently, there is discussion of investing in vaccination strategies for highly contagious animal diseases in order to reduce spread and consequently reduce the need to depopulate. There are a few considerations for vaccination to think about. First, a vaccine needs to match the circulating virus well to be effective. This is why viruses that are fairly stable can be effectively eradicated through vaccination. The highly contagious animal diseases mentioned here mutate quickly. A viable vaccine is available for FMD, and the U.S. has invested in a FMD vaccine bank that can be quickly deployed in the event of an outbreak. However, no approved vaccine is currently available for ASF. The threat of HPAI in both poultry and dairy cattle has accelerated the development of vaccines, and the ability to match an HPAI vaccine is improving even with a quickly mutating virus. Licensed HPAI vaccines are not commercially available and there are aspects of an HPAI vaccination policy that are yet to be worked out. For all of the potential benefits, vaccination will likely come at a high cost also.
Trade partners generally will treat eradication or prevention through vaccination campaigns with similar trade bans to outbreaks. This is because vaccination can prevent signs of clinical illness but may not prevent infection. As a result, extensive surveillance requirements are needed to assure that infection is not being spread to areas outside of the vaccination zone through the movements of animals or products. Bilateral discussions with trading partners will be needed to agree to protocols for ensuring disease freedom status. This can be expensive, both in terms of budget and also in terms of trained personnel to track vaccinated animals. If vaccination is expected to be ongoing due to external disease pressure, as is the case with HPAI in wild bird reservoirs, costs will accrue on an annual basis. The logistics of applying a vaccine may be challenging. FMD and HPAI vaccines require two doses to be fully effective, requiring animals to be handled multiple times. In long lived species like cattle, the vaccination must be repeated for protective immunity. Vaccination is unlikely to ever be used to prevent a disease from entering a country due to these expenses and complex policy implications. However, for a disease like HPAI where risk of introduction is ongoing via wild bird exposures, vaccination may well be a viable response strategy.
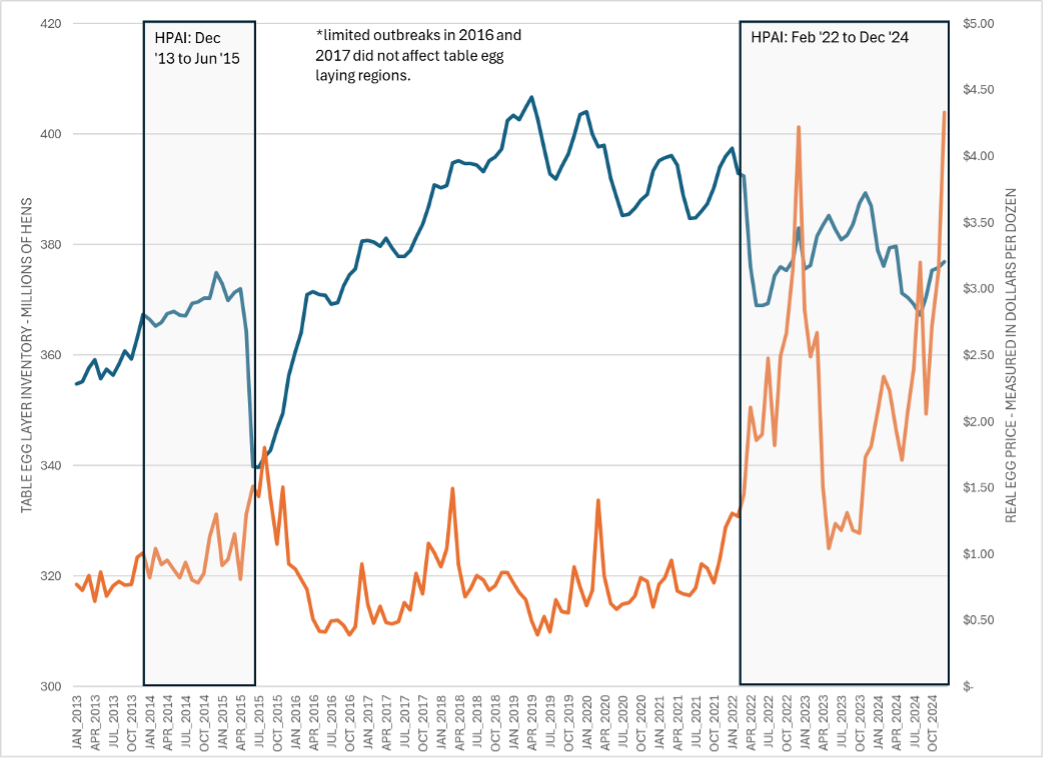
Figure 1. Table Egg Layer Inventory (left axis) and Real Egg Price Per Dozen Egg (right axis) from 2013 to 2024, with HPAI Outbreaks Highlighted In Each Box
Data Source: USDA National Agricultural Statistics Service; Outbreak Dates: USDA Animal and Plant Health Inspection Service
References:
United States Department of Agriculture Animal and Plant Health Inspection Service (USDA APHIS). 2022. “HPAI response: Response goals & depopulation policy” Available online: https://www.aphis.usda.gov/sites/default/files/depopulationpolicy.pdf
United States Department of Agriculture Animal and Plant Health Inspection Service (USDA APHIS). 2016. “Final report for the 2014–2015 outbreak of highly pathogenic avian influenza (HPAI) in the United States.” Veterinary Services Surveillance, Preparedness, and Response Services Animal and Plant Health Inspection Service. Available online: https://www.aphis.usda.gov/media/document/2086/file
Ma, M., H.H. Wang, Y. Hua, F. Qin, J. Yang. 2021. “African swine fever in China: Impacts, responses, and policy implications.” Food Policy, 102(102065).
There have been over 20 million commercial table/shell egg laying hens lost already in 2025 alone due to High Pathogenic Avian Influenza (HPAI). Losses have impacted egg supply and prices have spiked. At the time of this writing, nationally, large white shell eggs are over $8.00 per dozen. Discussions over HPAI vaccination have been going on at some level from the beginning of this outbreak in 2022, but just recently a conditional approval has been given for a vaccine to be used here in the U.S. While vaccination holds some promise, it has its own set of problems and costs that must be balanced with the potential gains from controlling the virus.
As a stopgap measure to boost egg supplies, it has been suggested that surplus eggs from broiler hatcheries could be transferred into the egg products market, replacing shell eggs that could then be sold as fresh, helping lower prices. Eggs that go into egg products are used for things like dressings, sauces, etc. or for powered egg products like cake mixes. These products are pasteurized and considered some of the safest egg products available for human consumption. The surplus broiler eggs come from the occasional over-supply of hatching eggs not being able to be set to hatch. They are currently used for animal feed products or often simply disposed of. At one time, they were allowed to enter the edible egg products market. Using surplus broiler eggs stopped in 2009 when a law specifically targeting normal table egg handling and storage was passed requiring ALL eggs, whether sold fresh or used for egg products, be handled in such a way that precludes the surplus broiler eggs from the process. Now, some are asking the law be rescinded or modified to allow broiler eggs to again be used to help relieve the current egg shortage.
To analyze this question, we must look at a few big numbers. First, it is estimated by the National Chicken Council that there would be an annual surplus of “…almost 400 million broiler eggs (going) into the egg breaking supply each year…” That is a lot of eggs, but would it affect the price of table eggs? According to the USDA-Economic Research Service, total table egg production for 2024 was 7,751 million dozen, or over 93 billion eggs. If we assume an even distribution, that’s 7.75 billion eggs being produced per month! If we evenly distribute the surplus broiler egg supply, it could provide an additional 33.6 million eggs per month, or about 0.4% of the monthly total – an amount not likely to make any appreciable difference in the current prices. Still, there is no reason not to add these eggs into the market, but there should be no expectation of any significant price impact for doing so. It would however benefit the broiler companies as a market outlet for eggs that are often a loss. And if a few more eggs hit the store shelves, that’s not a bad thing.
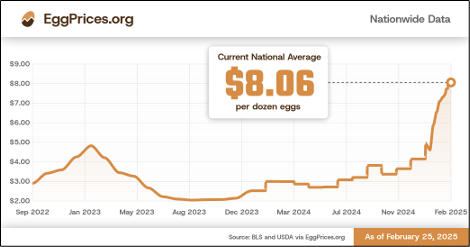
Fig. 1 – Egg prices declined and stayed close to the recent annual average of around $2.00/dz for a couple of months after the most recent spike in January 2023. The current spike far outweighed that spike and will likely not abate for some time.
The February Cattle on Feed report was released this past Friday afternoon and reported 11.7 million head of cattle in feedlots on February 1st. This was a 0.7 percent decrease from February 1, 2024. Marketings were up 1.4 percent year-over-year. There were no big surprises in the report relative to pre-report expectations, but there were some interesting points in the report.
Placements of cattle into feedlots during January were up 1.7 percent above January 2024. Weather and winter storms delayed January 2024 placements, so the increase shown for 2025 is partially driven by a lower 2024 number. In 2024, placements were higher in February than they were in January which was the first time that had occurred since 1996. We have not seen those same challenges so far in 2025, but February placements are likely to be impacted by the lingering impacts of the Mexico cattle import ban.
A regional look at the data implies an impact of the Mexico import ban on January placements. January 2025 placements of cattle into feedlots in Texas were 50,000 head lower than a year ago which is a 14.5 percent decrease. This was offset by a 60,000 head (15.4 percent) increase in Kansas and a 30,000 head (5.9 percent) increase in Nebraska during January.
The largest increase in placements was in the 700-799 pound weight range which were up 30,000 head (6.3 percent) from a year ago. Placements were up across all weight classes in Nebraska and Kansas and lower across all weight classes in Texas. Placements of cattle into Texas feedlots weighing less than 699 pounds were down 35,000 head during January compared to a year ago.
The data mentioned above comes from feedlots with at least 1,000 head capacity. However, another interesting part of the February report is the detail about the distribution of cattle across feedlot sizes. There are 2,105 feedlots with at least 1,000 head feeding capacity. These feedlots housed 83 percent of cattle on feed as of January 1, 2025. The remaining 17 percent of cattle on feed were located across the 24,000 feedlots with a capacity of less than 1,000 head. Of the 1,000+ capacity feedlots, there were 80 that have a capacity of 50,000 head or more, and these were home to 35 percent of the total U.S. cattle on feed on January 1.