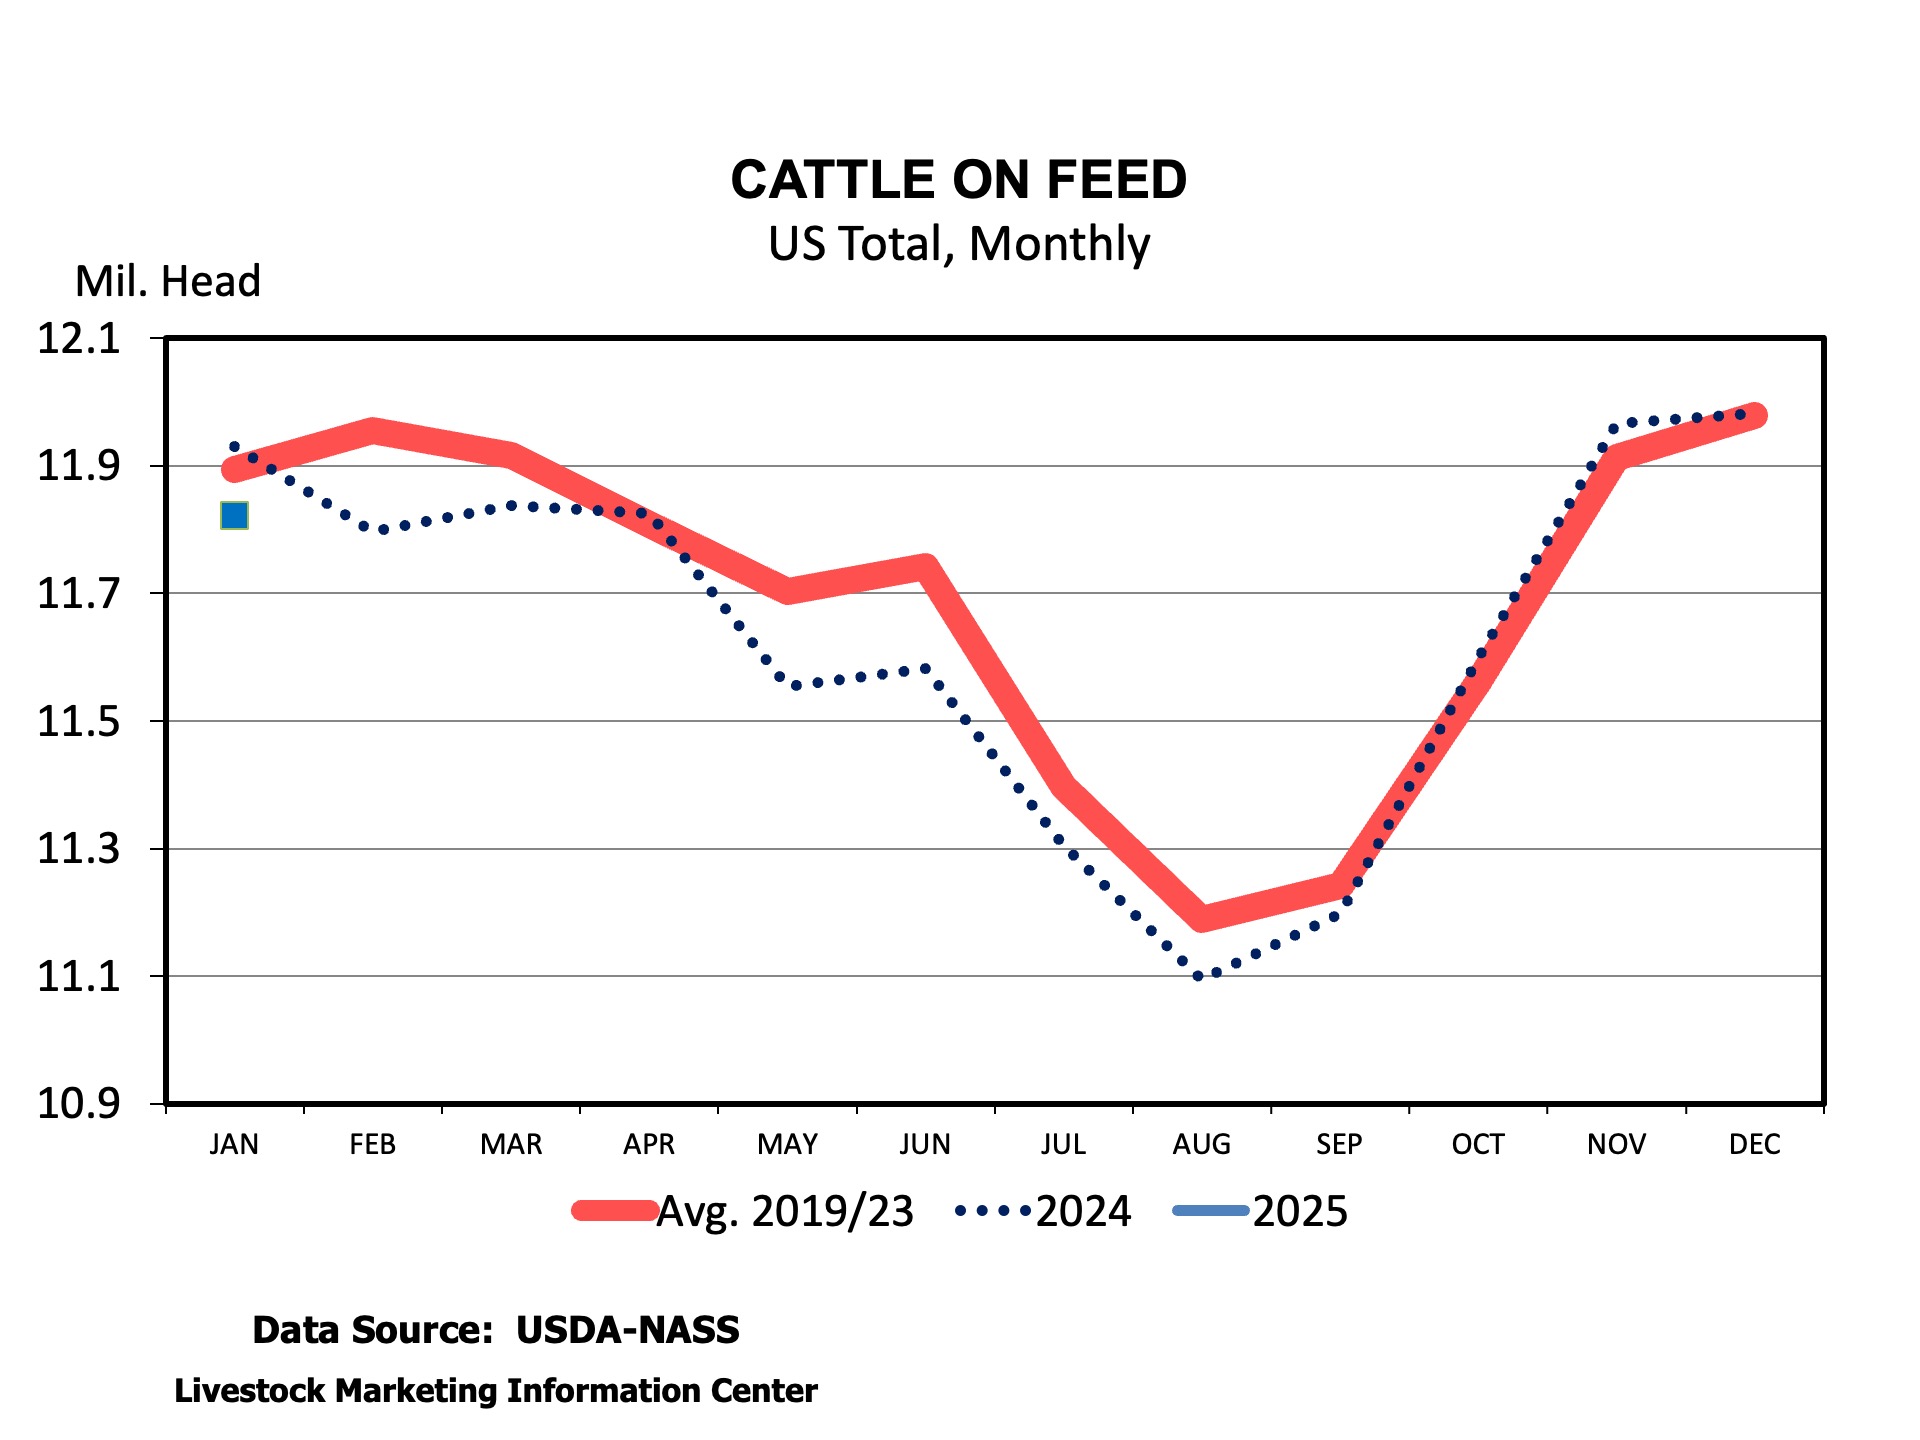
The February Cattle on Feed report was released this past Friday afternoon and reported 11.7 million head of cattle in feedlots on February 1st. This was a 0.7 percent decrease from February 1, 2024. Marketings were up 1.4 percent year-over-year. There were no big surprises in the report relative to pre-report expectations, but there were some interesting points in the report.
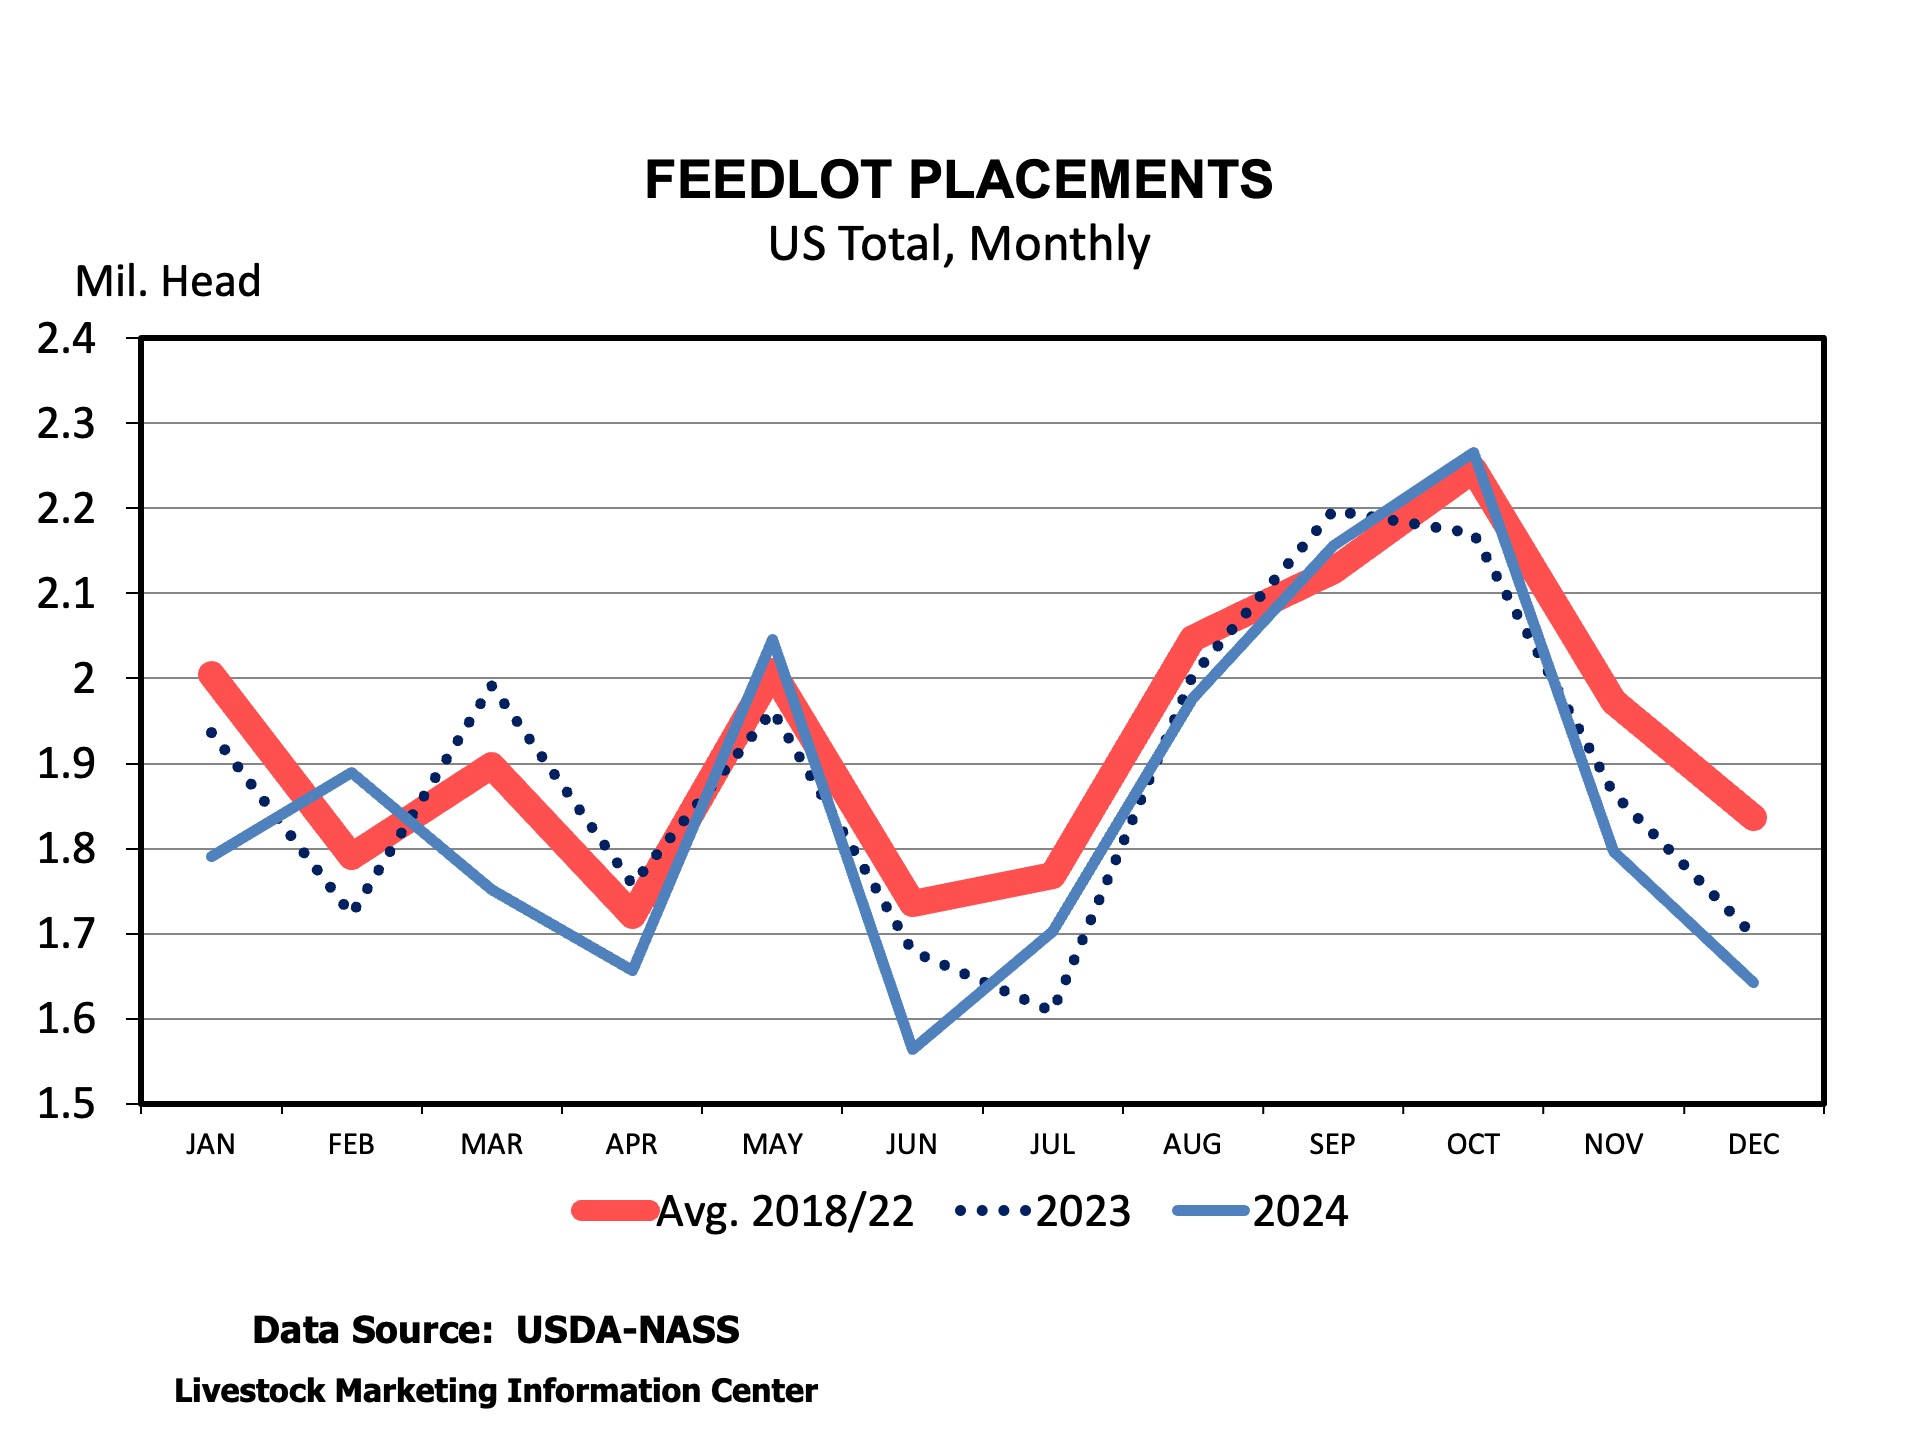
Placements of cattle into feedlots during January were up 1.7 percent above January 2024. Weather and winter storms delayed January 2024 placements, so the increase shown for 2025 is partially driven by a lower 2024 number. In 2024, placements were higher in February than they were in January which was the first time that had occurred since 1996. We have not seen those same challenges so far in 2025, but February placements are likely to be impacted by the lingering impacts of the Mexico cattle import ban.
A regional look at the data implies an impact of the Mexico import ban on January placements. January 2025 placements of cattle into feedlots in Texas were 50,000 head lower than a year ago which is a 14.5 percent decrease. This was offset by a 60,000 head (15.4 percent) increase in Kansas and a 30,000 head (5.9 percent) increase in Nebraska during January.
The largest increase in placements was in the 700-799 pound weight range which were up 30,000 head (6.3 percent) from a year ago. Placements were up across all weight classes in Nebraska and Kansas and lower across all weight classes in Texas. Placements of cattle into Texas feedlots weighing less than 699 pounds were down 35,000 head during January compared to a year ago.
The data mentioned above comes from feedlots with at least 1,000 head capacity. However, another interesting part of the February report is the detail about the distribution of cattle across feedlot sizes. There are 2,105 feedlots with at least 1,000 head feeding capacity. These feedlots housed 83 percent of cattle on feed as of January 1, 2025. The remaining 17 percent of cattle on feed were located across the 24,000 feedlots with a capacity of less than 1,000 head. Of the 1,000+ capacity feedlots, there were 80 that have a capacity of 50,000 head or more, and these were home to 35 percent of the total U.S. cattle on feed on January 1.
USDA will release the February Cattle on Feed report on Friday, February 21st. It’s following closely on the heels of the cattle inventory report released at the end of January. There are several interesting things to look for in this report, including overall placements, the impact of border restrictions on placements in Texas, and the number of cattle in feedlots.
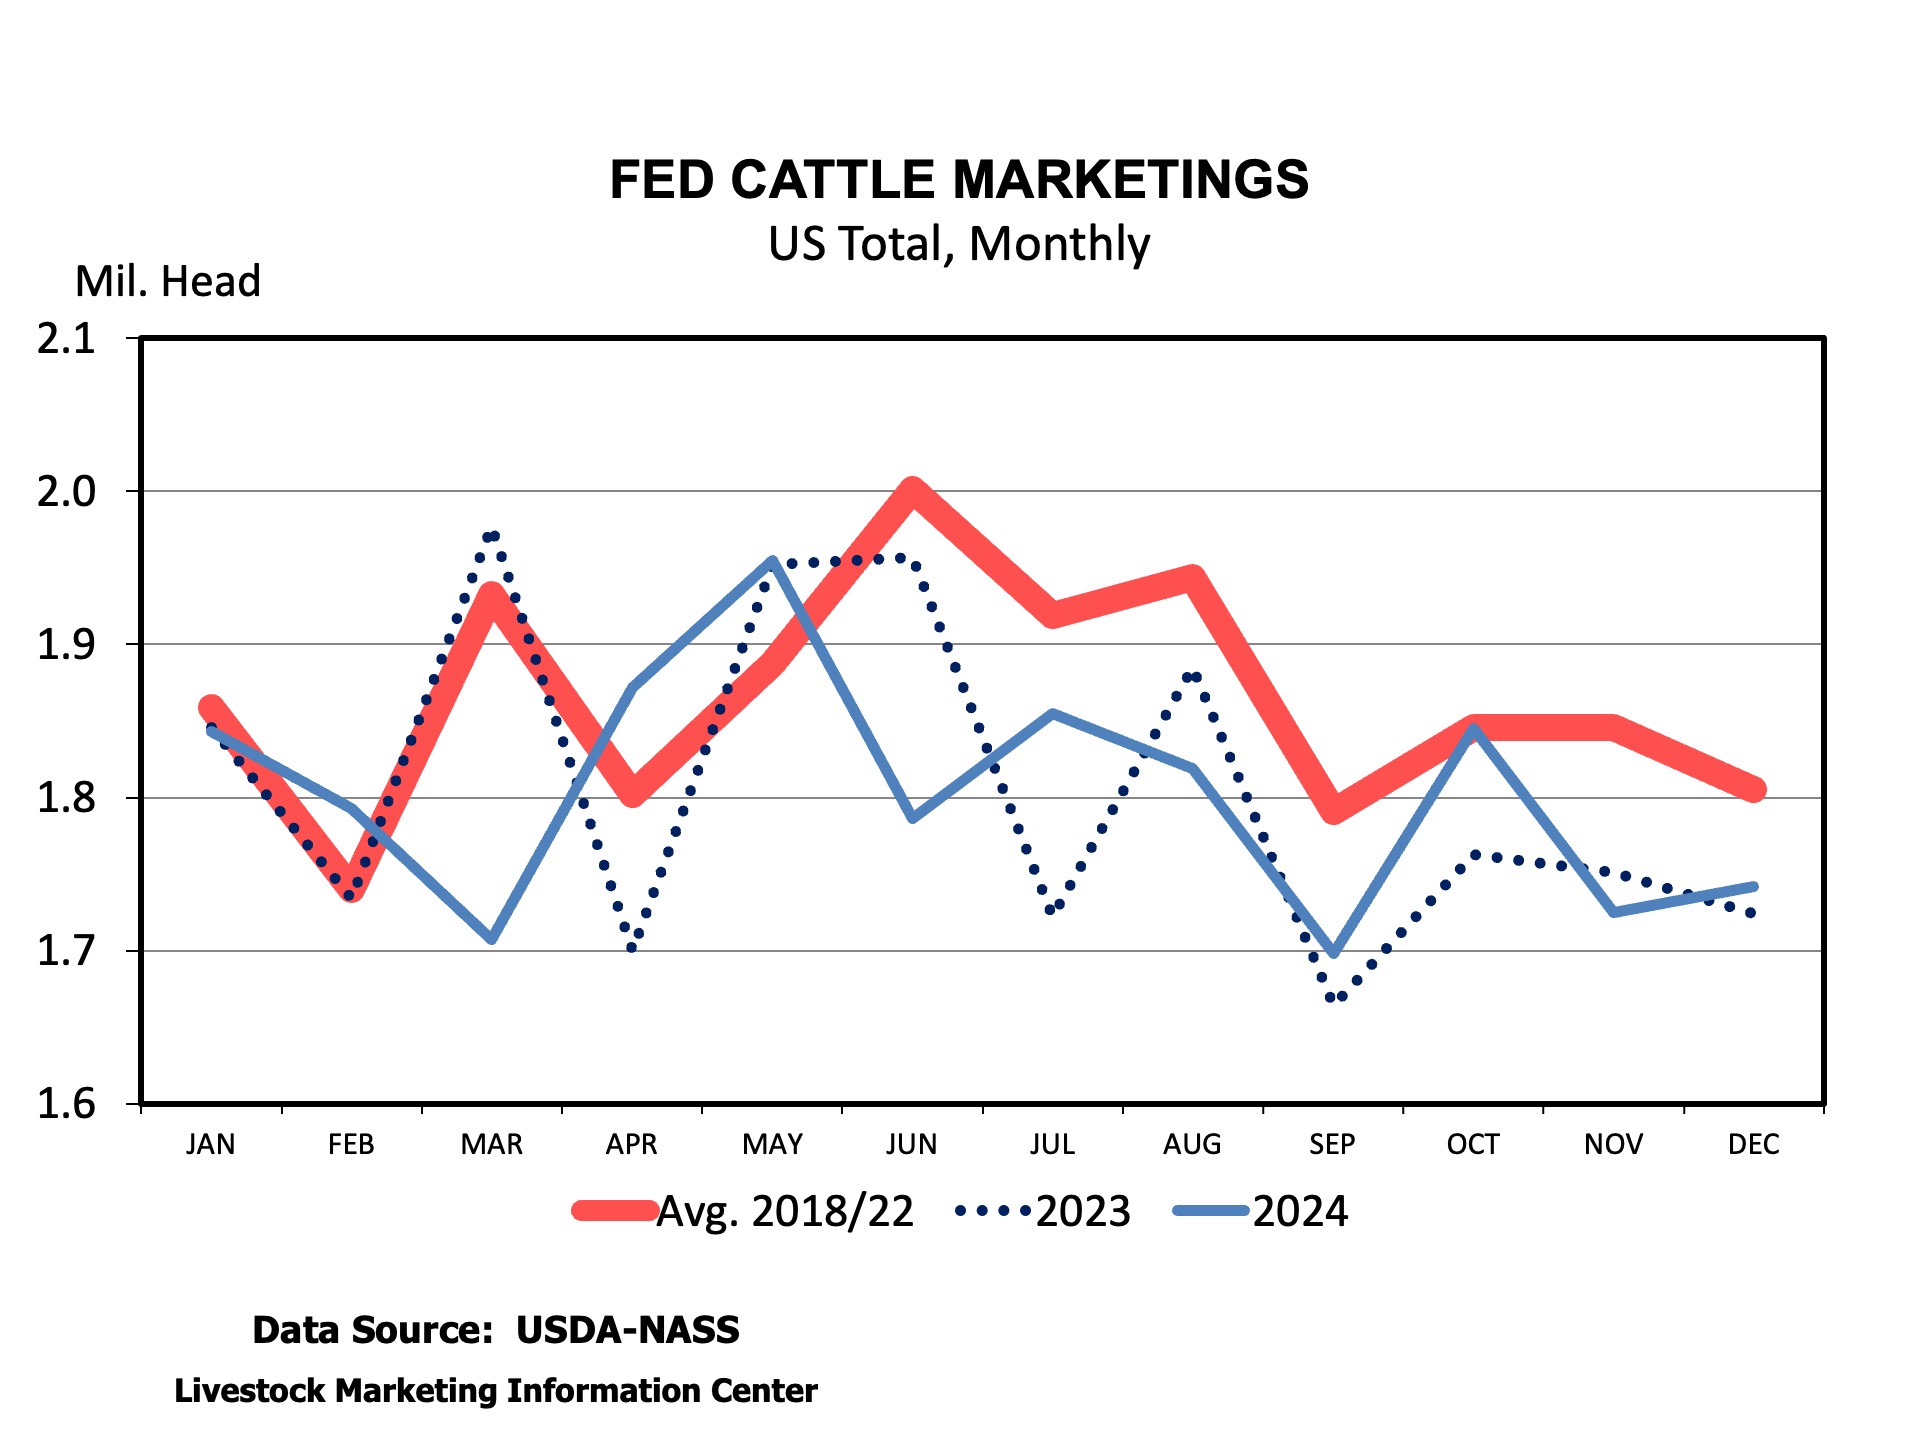
In a sense, marketings and placements are related. We can think of cattle leaving the feedlot for a packer (marketings), making way for new cattle to enter (placements). Marketings are estimated to be up about 2.5 percent in January compared to last January. Given the same number of working days as a year ago, daily average marketings were faster than last year.
In my pre-report estimates, I expect placements to be about the same as a year ago. Placements equal to last January would imply a fairly small number of feeder cattle placed compared to marketings. This estimate balances larger numbers of feeder cattle in the CME feeder cattle index and no cattle entering the U.S. from Mexico in January. The U.S. imported 107,000 fewer feeder cattle in January 2025. Feeder cattle imports only resumed in the second week of February, at very low levels compared to last year. The number of lightweight placements in Texas will provide some good insight into the impact of the ban on placements. Texas placements in December were down 23 percent, with much of that decline coming in the lightest weight categories.
The combination of larger marketings and no change in placements would pull down the number of cattle on feed on February 1st to 98.8 percent of the prior February. Sooner or later, fed cattle supplies will begin to decline dramatically due to fewer calves and herd rebuilding. The market likely can’t continue to rob Peter to pay Paul by pulling animals ahead and placing heifers, and when that ends, the number of cattle on feed will decline dramatically. That will lead to another increase in calf and feeder cattle prices this year.
Two other interesting pieces of information will be included in this report. The February report includes an estimate of total feedlot capacity in the U.S. We often talk about packer capacity but rarely feedlot capacity. Feedlot capacity has not been a limiting factor in the market. This report will also include data on the number of fed cattle marketings and cattle on feed by size of feedlot. That data provides some insight on concentration in the feedlot sector.
In a recent Southern Ag Today article, Anderson and Maples addressed increasing slaughter weights in beef cattle while also mentioning slaughter weights are increasing in swine and poultry. In this article, we will address poultry weights, specifically broilers.
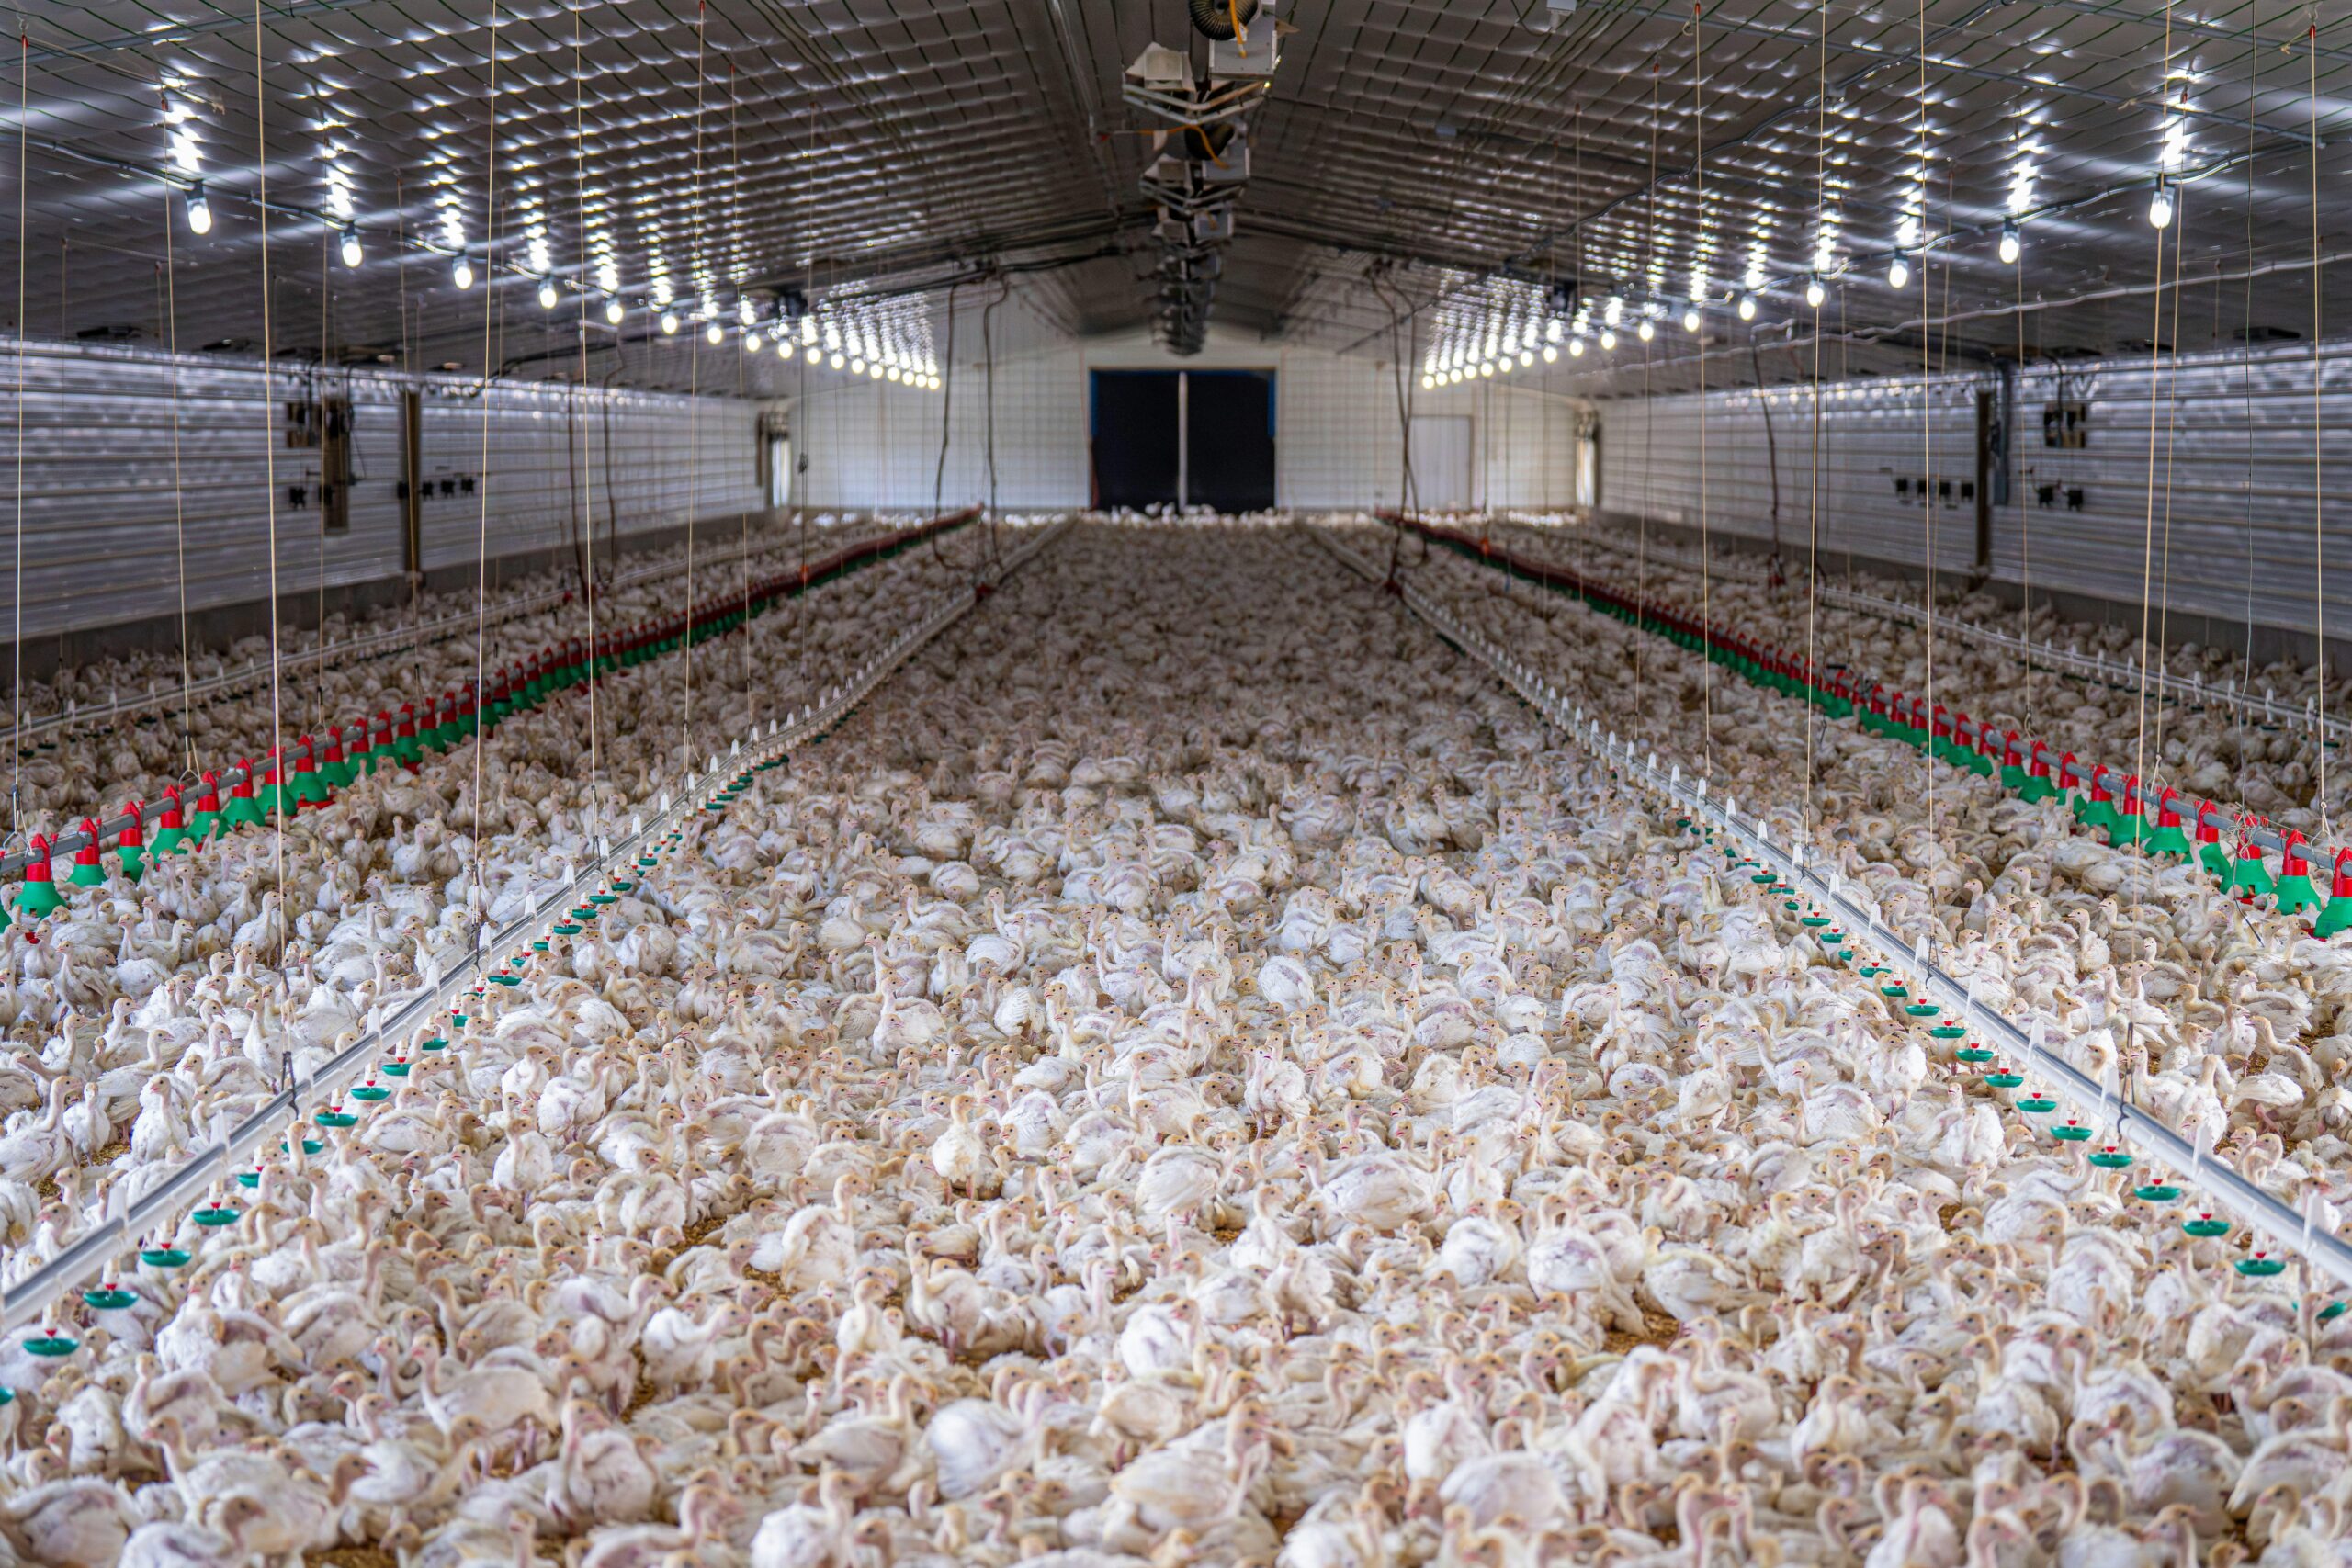
Broiler slaughter weight has been increasing, however, the reasons for the increase are different than was outlined in the referenced beef article. The trend is a long-term situation rather than a short- or intermediate-term phenomenon. Broiler weights have been on a steady increase since the 1920s. The primary driver of these increases is market-derived; it is a slow change based on U.S. poultry consumers’ desire combined with the changing genetic potential of the birds. Unlike the beef industry, where the producers, feeders, and packers are usually separate entities, the poultry companies producing chicken own the chickens and control their genetics and production from the egg to chicken sandwich.
Most chickens in the U.S. are produced to meet specific market demands, and this requires varying sizes of birds. Grocery store chill-packaged products like split breasts or boneless breasts usually come from birds in the 6– 7-pound range. Fast food chicken restaurants like Popeyes or KFC typically require smaller birds to fill their “pieces” menu. These birds are usually 3.5-to-4-pound slaughter weight. The same companies sell chicken sandwiches that require filets from larger birds of upwards to 9-pound slaughter weight. Frozen processed chicken fingers and sandwich filets at the grocery store are best produced from larger birds as well. As consumers have demanded more chicken sandwiches, chicken fingers, breast filets, etc., and fewer whole birds or cut-up pieces, poultry companies have moved their genetic target toward producing birds that more efficiently meet these demands per square foot of grow-out space. Simply put, you can get more chicken fingers per square foot of grow-out space from a bigger chicken. This demand has pushed companies to produce more of the larger birds and increase the size of the larger birds (Fig 1). Since companies own the chickens and control the genetics and production, they can make these changes in response to consumer trends quickly and sustain those changes over time. From 1955 to 2021, the combined average of all broiler sizes in the U.S. increased from 3 pounds to approximately 6.5 pounds, or 116%, in response to U.S. consumer demands. But that’s not the whole story. Along with increasing weights, the poultry industry has decreased the amount of feed needed by 38 percent, from 3.0 pounds to 1.85 pounds of feed per pound of gain. The time it takes to achieve average market weight has decreased by about 20 days. Overall mortality has also decreased, though recently a change in production methods has caused a slight uptick in mortality (Fig 2). All these changes have been achieved by foundational efforts in genetics, nutritional advances, and grow-out environment/housing improvements. Overall, this represents a case study in sustainability – producing more output with fewer inputs. In commercial poultry’s case, that means more chicken for less feed, over less time, with less environmental impact.
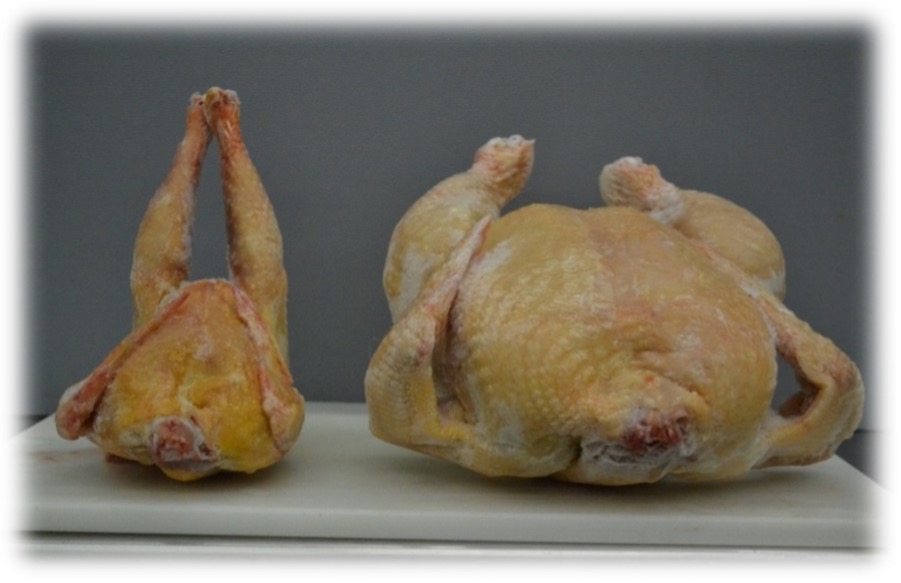
Fig 1. Broiler weights (bird size) have increased a remarkable amount from the 1950’s to the modern bird of today. These changes have been the result of focused genetics, improved nutrition and bird environment.
(Source: Aviagen Inc.)
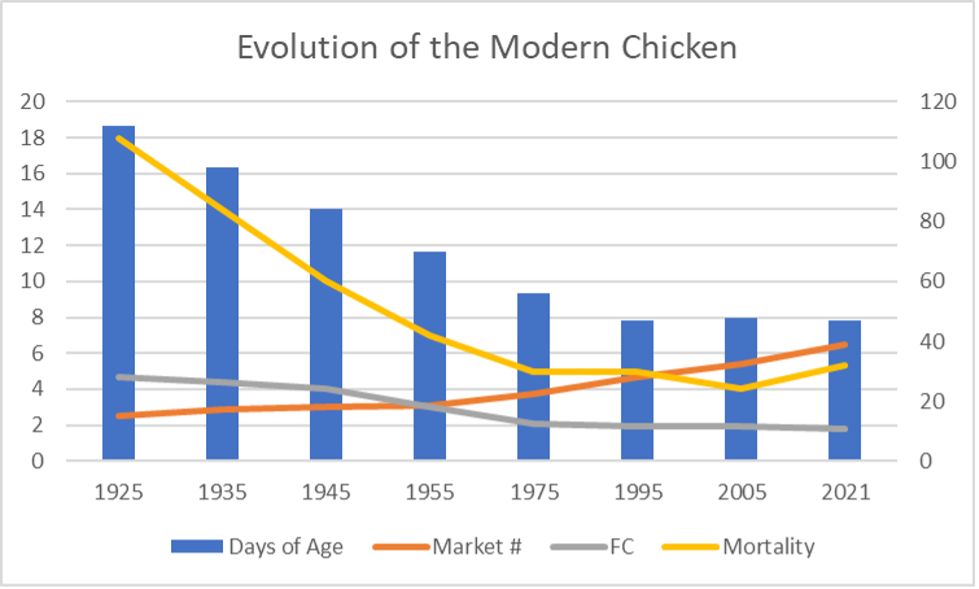
Fig. 2: From 1955 to modern day, average broiler weights have increased by 116 percent. At the same time, feed conversion has improved by 38 percent. Days of age to slaughter have also decreased by 27 percent, and mortality by 21 percent.
Lbs/Percent on the left and days on the right. (National Chicken Council data)
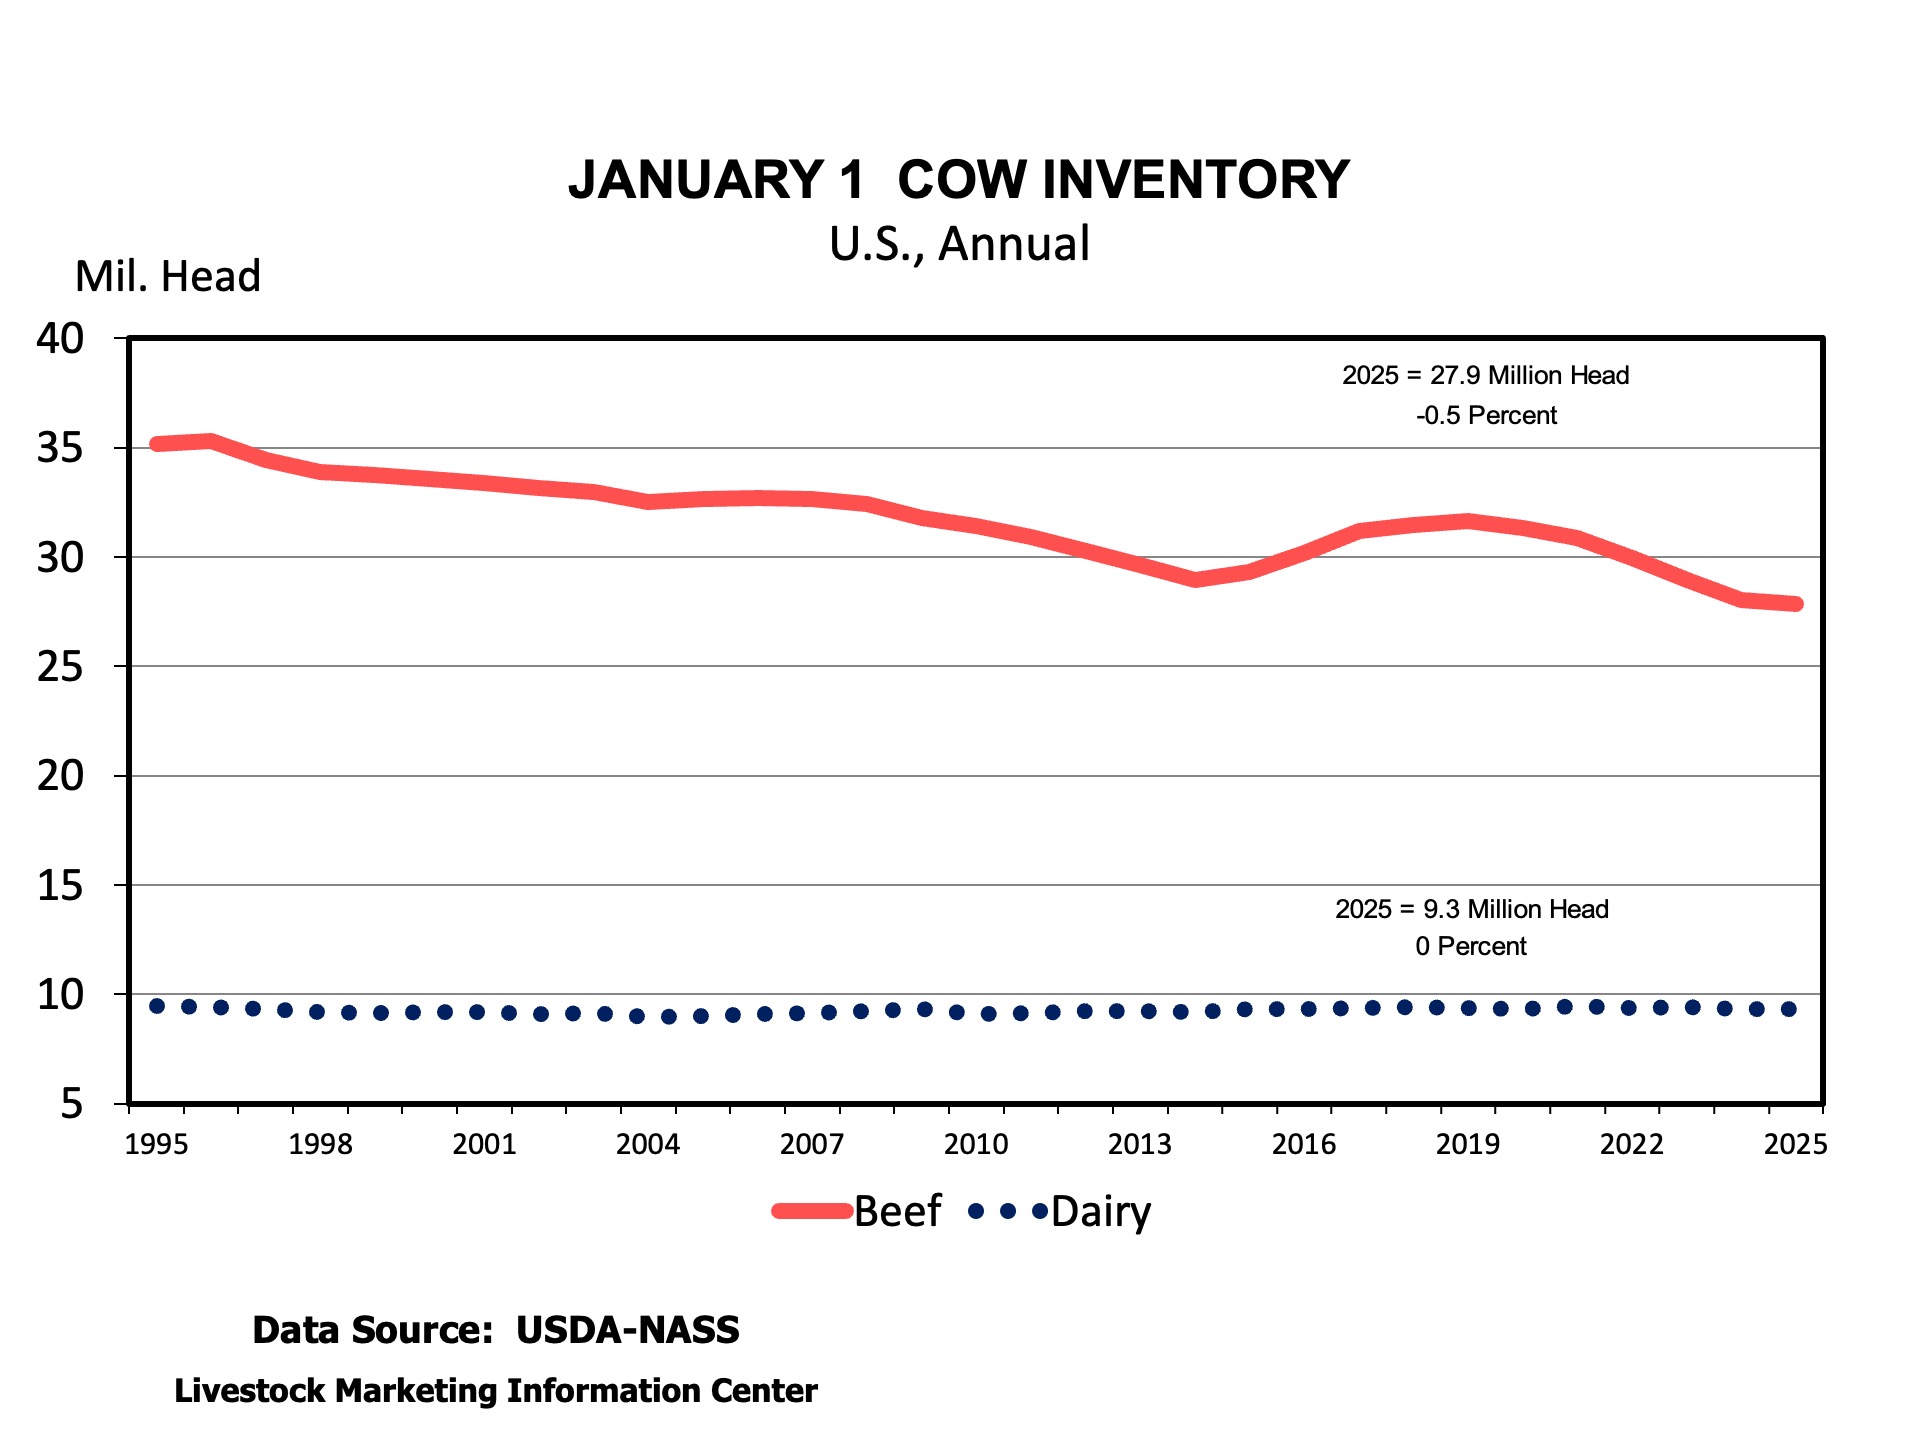
USDA released its Cattle inventory report on Friday, January 31st. This report is the benchmark for data on the number of total cattle in the U.S. and estimates of beef and dairy cows, replacement heifers, and stockers on small grain pastures. The data is the starting point for estimates of beef production and prices in the future.
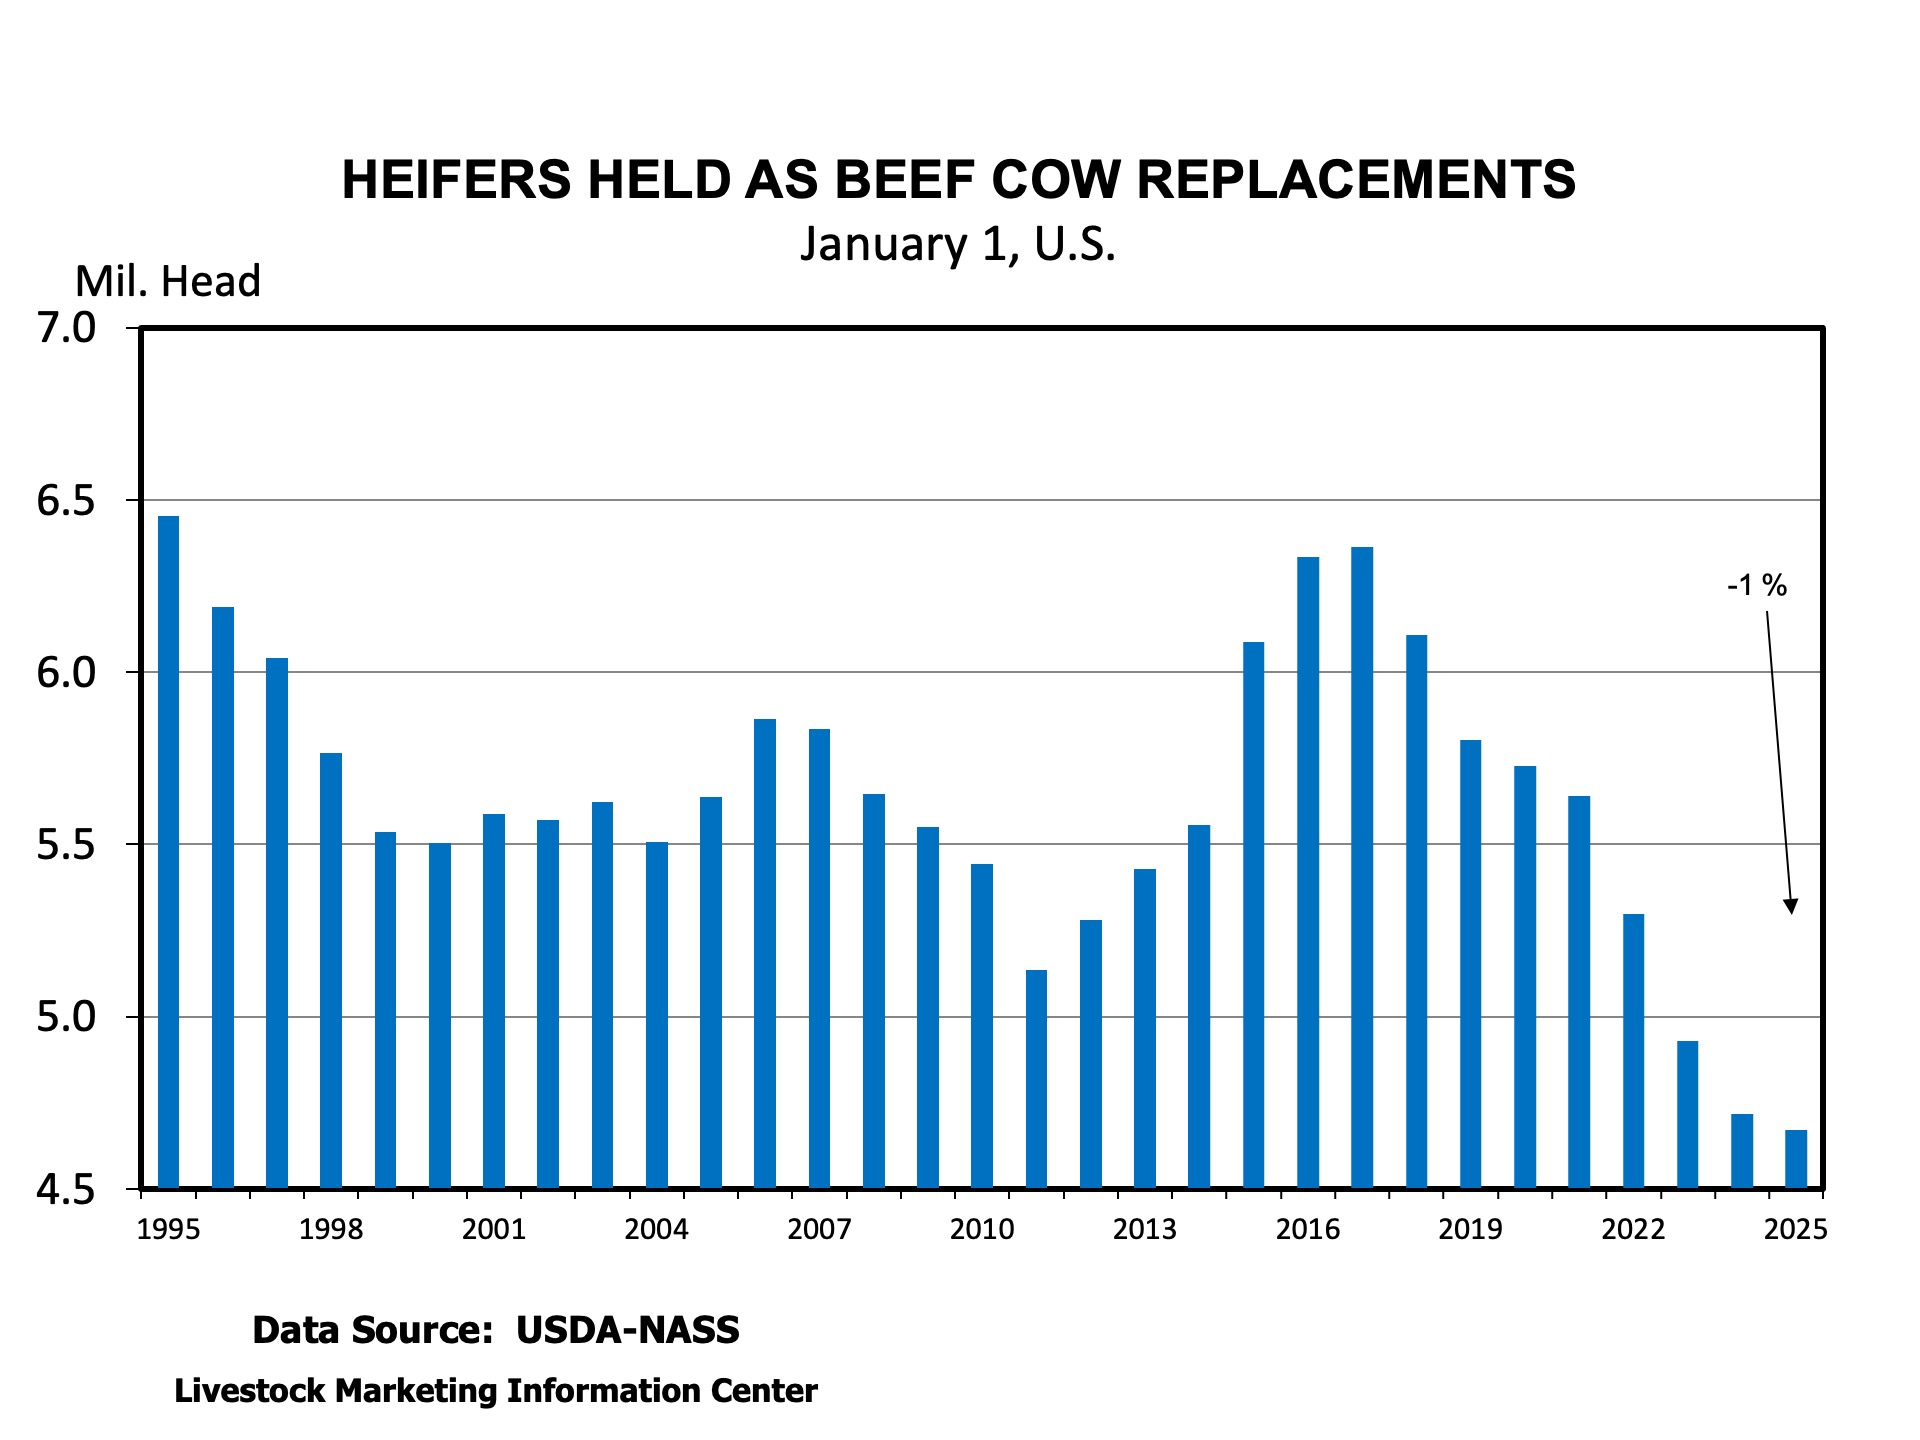
The big numbers in the report included a January 1, 2025, total cattle inventory of 86.66 million head, down 1 percent from the year before and the fewest since 1951. Beef cows were down 0.6 percent to 27.86 million head the fewest since 1961. Heifers for beef cow replacement were down 1 percent to 4.67 million, the fewest since 1949.
One of the interesting components of these statistical reports are revisions. USDA gathers the surveys and other information from other surveys and data reports and revises the previous year’s data if warranted. Sometimes revisions are important and sometimes they are a non-event. This report had some revisions that are interesting. Some states were not reported beginning in this survey due to budget cuts. While producers were surveyed, their numbers were only included in the total U.S. statistics.
Today’s article includes comments from SAT livestock economist writers to offer a few thoughts on their state and the report across the South.
Matt Fischer, Clemson University:
South Carolina cattle and calves inventory expanded in 2025 from 2024. Total cattle calves inventory on January 31, 2025, was reported 295,000, up 2% from 2024. Cow inventory increased in 2025 by 1%, from 156,000 to 157,000. Unfortunately, USDA did not provide inventory on any other category. Leaving speculation where the missing 4,000 head would be categorized, hopefully in unreported heifer inventory. Regardless, South Carolina reported inventory expansion in 2023 only to follow liquidation trend in 2024.
Will Secor, University of Georgia:
Broadly, the report was in-line with expectations. Georgia’s total cattle inventory and its inventory of beef cows declined by about 2% in 2025 compared to 2024. This confirms that there was no herd rebuilding in Georgia last year. However, these declines are smaller compared to last year despite dry weather struggles throughout much of the year. Additionally, the number of beef cow replacement heifers held steady at 85 thousand head.
Hannah Baker, University of Florida:
In Florida, the total number of cattle and calves was unchanged at 1.56 million head. The number of beef cows that calved in 2024 slightly increased by 0.3% (3,000 head) to 865,000 head. Florida is now ranked 10th in beef cattle production (9th last year). Florida’s 2024 calf crop was 1% larger than 2023’s at 770,000 head. The number of beef cow replacements remained unchanged at 115,000 head, unlike last year when we saw a 4% decline. While we don’t see major signs of expansion, we do see signs of stabilization starting in the Florida beef cow herd.
Kenny Burdine, University of Kentucky:
The overall decrease in beef cow numbers was not a surprise. But cow slaughter really pulled back in late 2024 and I do think the decrease in beef cow numbers was smaller than what many expected in the first half of 2024. The 200,000 cow downward revision to 2024 beef cow numbers is also worth noting. My general take on beef cow numbers is that liquidation is slowing, but that is primarily due to reduced culling.
Beef heifer retention was down by about 1% (also after a downward revision to last year), which was largely expected given the number of heifers on feed. The main point here is that we are still not currently retaining enough heifers to grow the beef herd given a reasonable assumption of cow slaughter in 2025.
If weather allows, I think it is very possible that we see more heifer retention during 2025. It’s also good to remind ourselves that the January 1 report is a snapshot of inventory. There are additional heifers in growing programs (grazing, backgrounding, etc.) that could also potentially be bred this year if market and weather conditions remain favorable. And the inverse is also true – not all of those heifers being held for replacement purposes will end up entering the cow herd.
I don’t know what to make of the decrease in cattle grazing small grains. The calf crop was smaller last year, wheat grazing prospects were late to develop, and I also think a lot of calves moved early because it was dry for much of late summer-early fall.
NASS estimated our beef cow herd to be down by 38,000 head. This was consistent with what our county Extension agents had been telling me. Land constraints are real in the Commonwealth. We have lost a lot of pasture ground to row crop and development pressures. High land prices do tend to negatively impact cow numbers, especially for young and beginning farmers. I did not expect to see the increase in the estimated number of heifers held for beef replacements. But there was also an estimated increase in the heavy (> 500 lbs) steer and bull categories. I think this speaks to a gradual shift away from cows and towards growing operations in Kentucky.
Andrew Griffith, University of Tennessee:
I expected a larger decline in the beef cow herd and beef heifers held for replacement given the quantity of heifers that went on feed and the fact that cow slaughter was still a large number. Beef cow slaughter was certainly much lower in 2024 than in 2023, but beef cow slaughter in 2023 was extremely large. Thus, this was a little surprising to me. As far as state of Tennessee, I was surprised that the beef cow herd declined by 9,000 head while the number of heifers remained the same. Somehow, we maintained the same calf crop compared to last year despite having fewer cows. I do have some concerns about the survey response rate over time.
Josh Maples, Mississippi State University:
Total cattle inventory in Mississippi was unchanged at 810,000 head. The calf crop was also reported unchanged at 345,000 head. I was a little surprised the calf crop was not lower in Mississippi. The big adjustment this year was the change in data reported. Mississippi is one of the 19 states that were dropped (due to USDA-NASS budget cuts) from individual state reporting for important categories such as beef cows, replacements, etc. Producers were still surveyed, but their responses were aggregated into the total cattle number presented.
David Anderson, Texas A&M University:The beef cow herd increased about 60,000 head or 1.5% from January 1, 2024. But, this larger cow herd is the result of a downward revision to last year’s cow herd. I often think it is helpful to look at the data over a longer period and doing so shows that the herd is smaller than 2 years ago. So, I don’t think the report is too surprising thinking about it in that context. Fewer replacement heifers were retained according to the responses. The 4.075 million beef cows reported are the fewest since 1959 except for the 3.9 million in 2014 following the drought of 2010-2013.
The January Cattle on Feed report was released on Friday afternoon. Total on-feed inventory to start the year was estimated at a little over 11.8 million head, which is down by just under 1% from January of 2024. Even though feeder cattle supplies have been lower, feedlot inventories ran above year-ago levels for eight of twelve months in 2024 as lower feed prices encouraged longer feeding times. While I don’t want to read too much into it, this was the largest year-over-year decline since May.
Placements were once again the headliner of the report as they came in below, and outside the range of pre-report estimates. December 2024 placements were estimated at 1.64 million, which was 3.3% below December 2023. On the surface, this seemed logical as December represented a full month of not receiving live cattle imports from Mexico. This also marked the second month in a row with placement levels being more than 3% below year-ago.
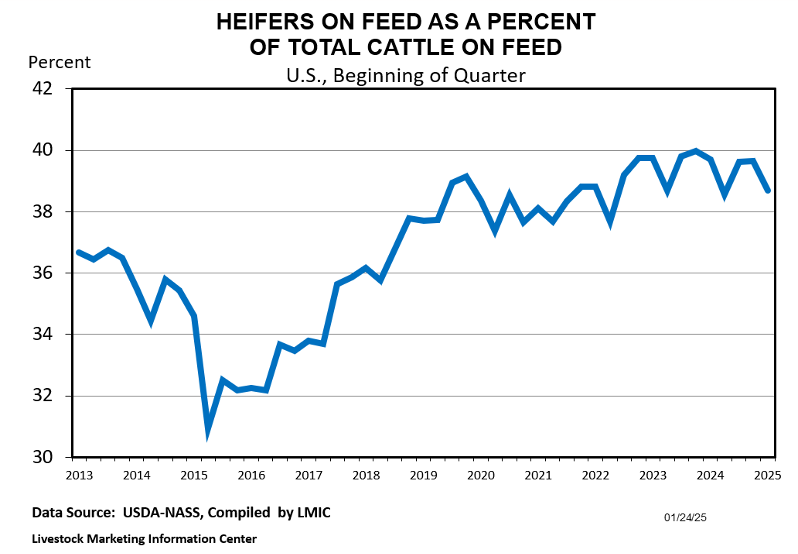
Friday’s report was also a quarterly cattle-on-feed report, which means it included an estimate of the steer/heifer breakdown. In the absence of a July cattle inventory report, this has been one of the main indicators economists have been tracking for evidence of heifer retention. Heifers accounted for 38.7% of the total on-feed inventory on January 1, 2025. While this doesn’t speak to retention, it is worth noting that this is about 1% lower than last January and 1% lower than October 2024. So, it does bear watching as we move further into 2025. Again, I think imports from Mexico had some impact here as heifers had represented a higher than usual share of imports prior to the ban in late November.
Last week’s cattle on feed report will be overshadowed later this week as USDA-NASS will release their annual inventory estimates on the afternoon of January 31st. While beef cow slaughter was down sharply for 2024, most are still expecting continued decreases in beef cattle numbers at the national level. It will be interesting to see the state-by-state numbers and specifically to look at areas where heifer retention may have already begun. Given the favorable price outlook for calves, I think heifer retention is very possible in 2025 if weather is cooperative. But I also think this will be a relatively slow cow-herd expansion once retention does begin.