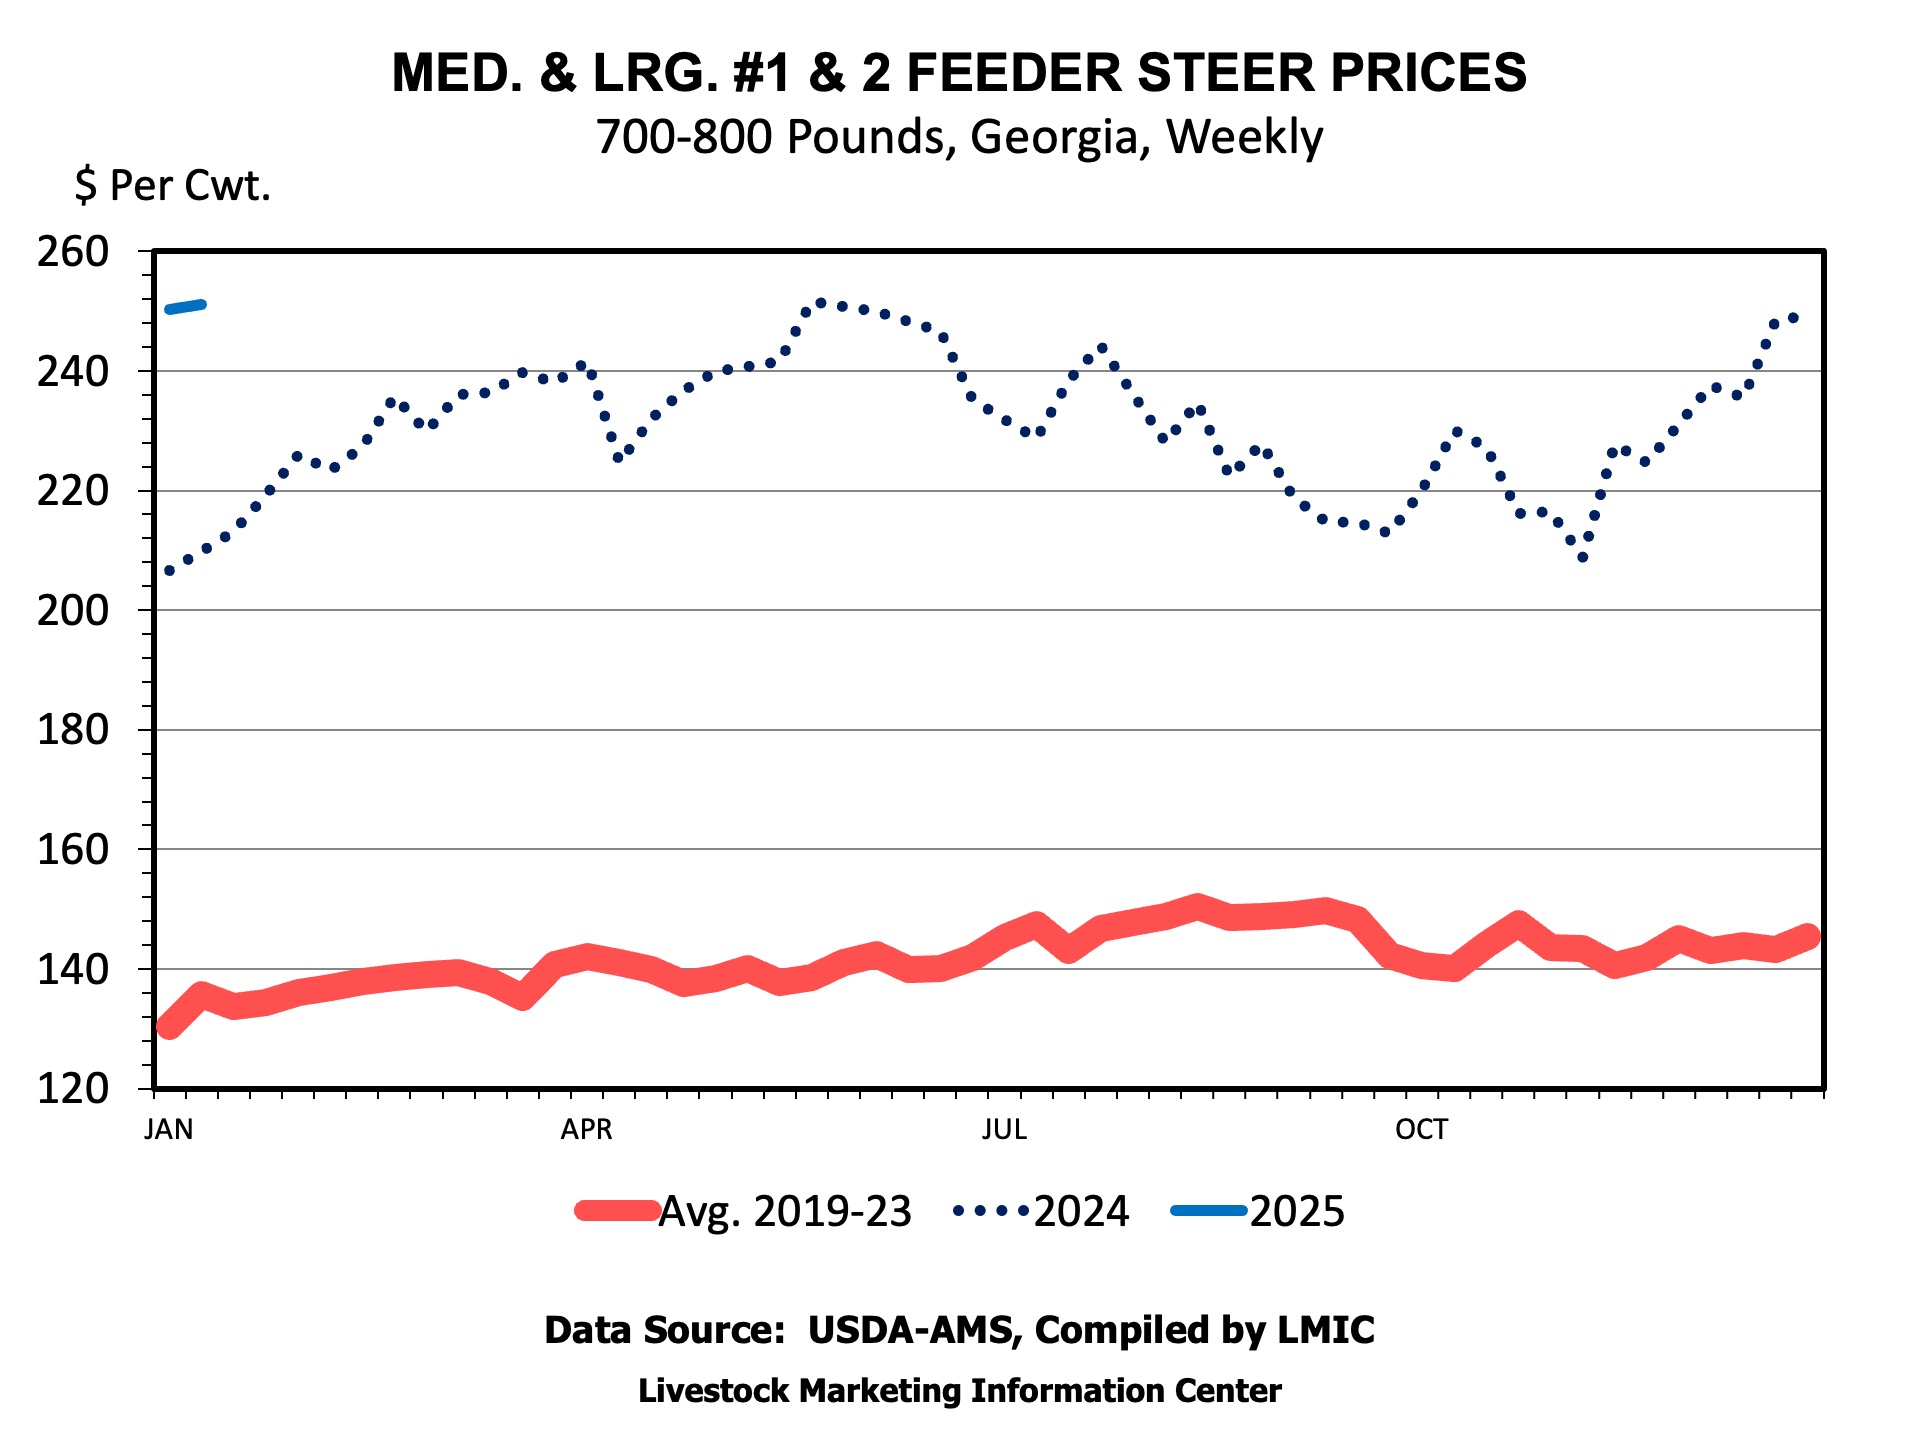
Trends are always difficult to ascertain coming out of holiday periods as many markets are closed and volumes tend to be pretty light, but cattle prices have started 2025 very strong. While questions exist on the demand side, tight cattle supplies will remain the primary driver in the new year and should continue to support prices. And as always, weather will have a significant impact on feed and forage availability and cattle marketing patterns. As I write this article in early January, I want to discuss four questions that I think will be important for the 2025 cattle market to answer.
Will we start to see significant heifer retention? – This question has been circulating for the better part of the last two years. There are a lot of reasons why retention has been delayed including weather, production costs and interest rates. But market conditions should be very favorable again and I do think heifer retention could be seen in 2025 if weather cooperates. When heifer retention does pick up, it will further tighten supplies of cattle as those females are held out of the marketing system. This will be the first stage of growing this cowherd, which is currently at a 60+ year low.
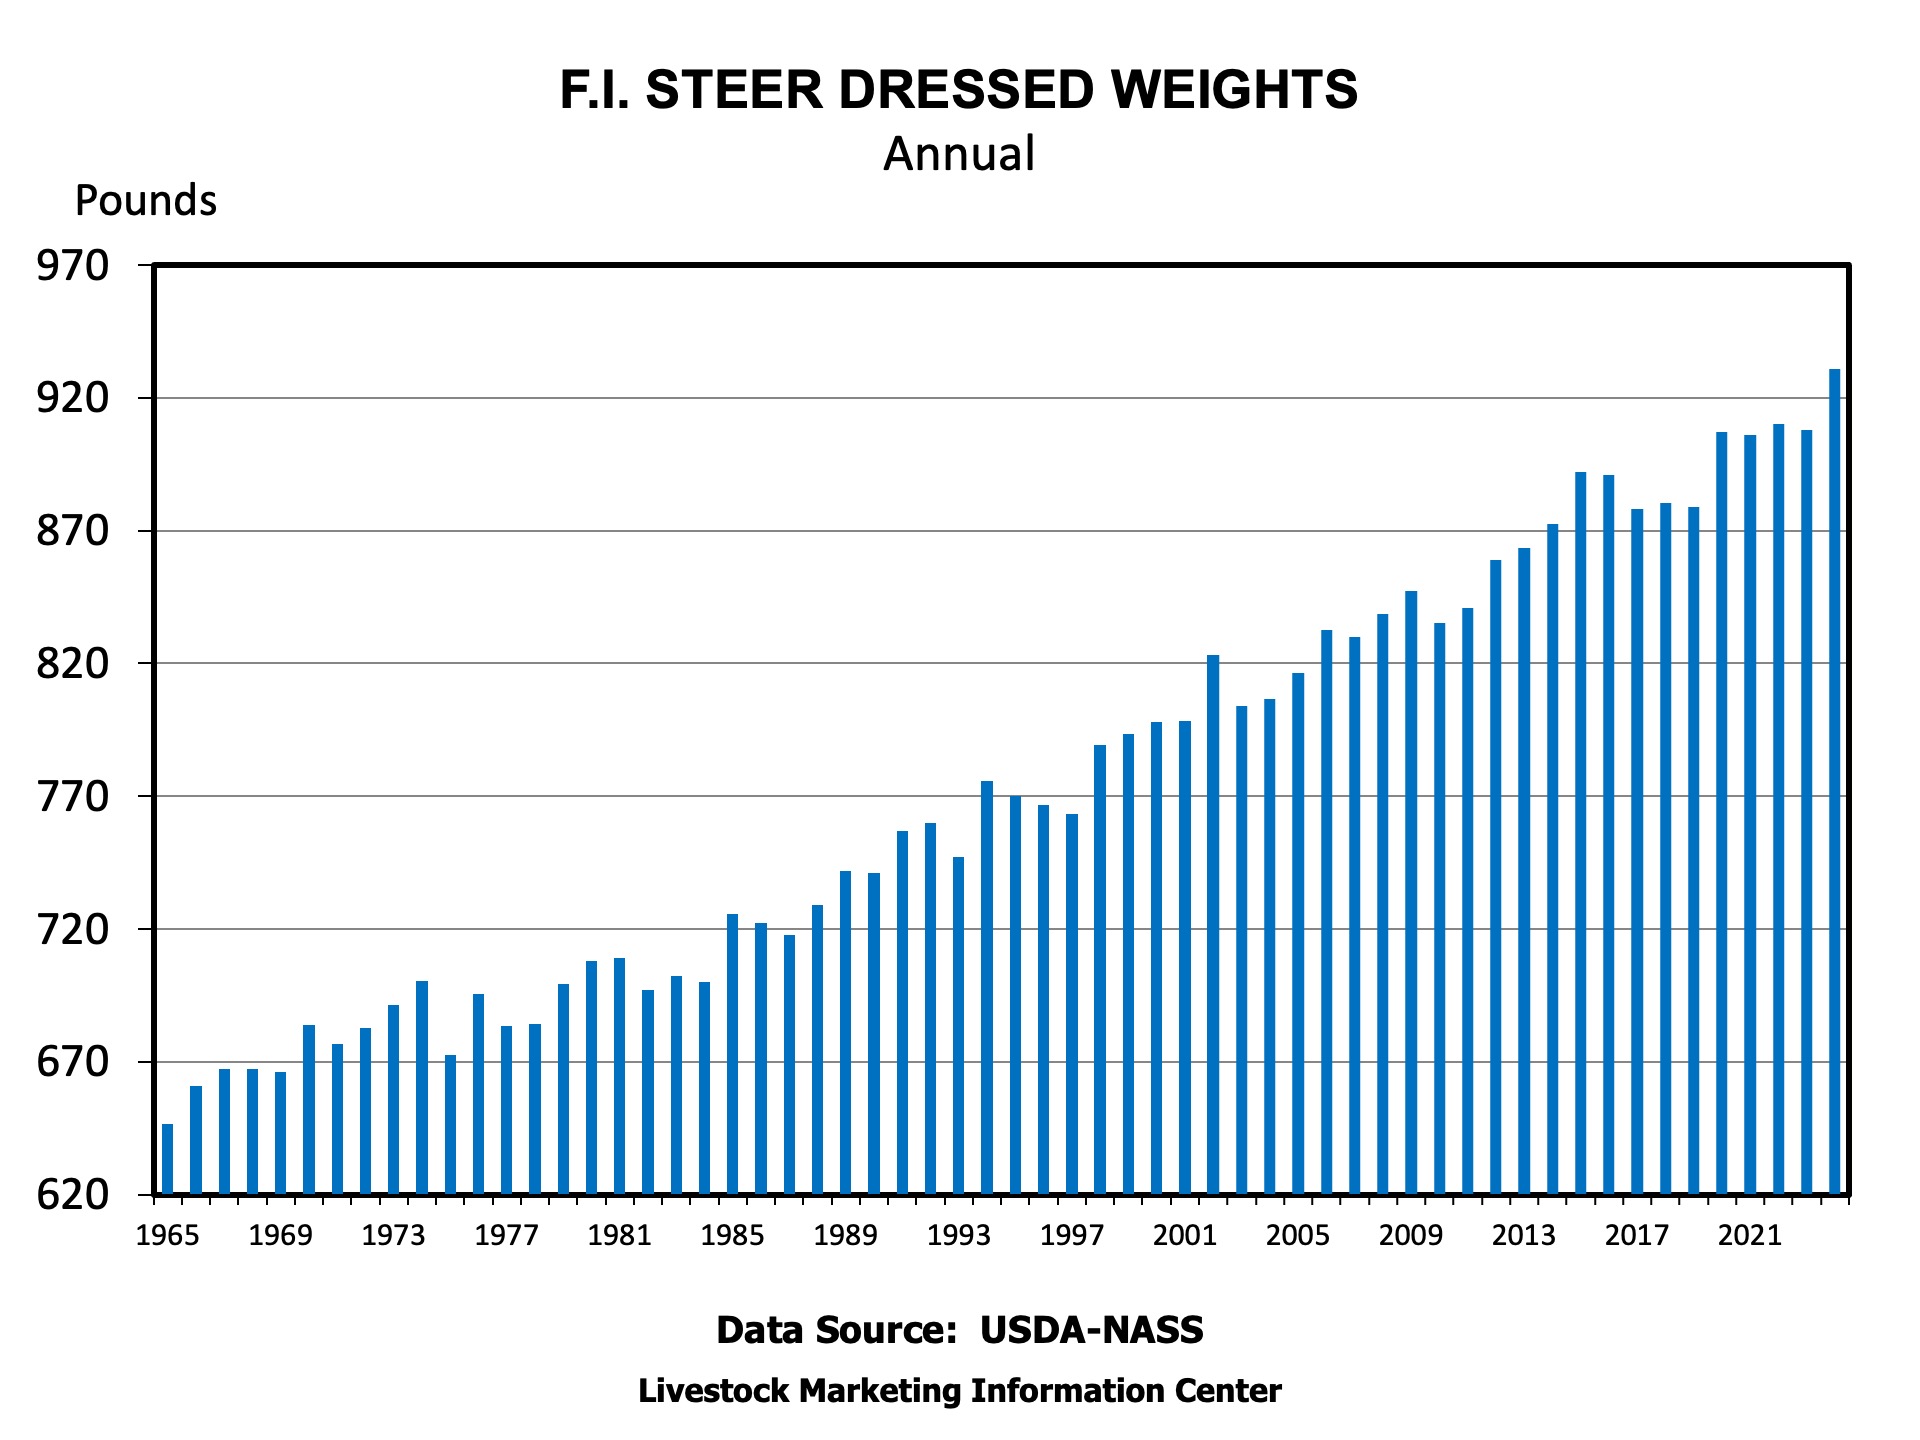
Can slaughter weights keep increasing? – Most analysts are forecasting beef production to be lower in 2025. These forecasts are based on continued decreases in cattle numbers and the potential for decreased female harvest in response to high prices. In truth, I could have written this exact same thing last year. But with cattle supplies tight, beef prices high, and feed prices relatively low, cattle were fed longer and to heavier weights. This increase in pounds largely offset the decrease in female slaughter and resulted in steady beef production levels for 2024. I will readily admit that I don’t know how much further weights can be pushed, if at all, but those same factors are largely at play again this year. So, I will be watching harvest weight trends very closely.
Will we see greater than expected growth in pork and poultry production? – Holding everything else constant, lower feed prices increase returns across all livestock species and lead to greater production levels. And production levels of competing meats do impact beef and cattle prices. Recent increases in pork production have been driven almost entirely by productivity, rather than increases in breeding inventory, and increases in broiler production have been running close to the long run trend. I just point this out because production increases can occur much faster in the hog sector than the cattle sector, and faster still in the poultry sector. While there aren’t many indications of expansion in other species currently, this was a factor in 2015, and I think it bears watching in 2025. It is important to remember that beef supplies are not the only factor that impacts beef prices. All proteins compete in the meat case.
What will be the impact of any changes in trade policy? – Trade has been a major topic of discussion recently and I doubt that will change in 2025. Beef exports have been lower in recent years due to tight domestic supplies and high prices, but the US still exported the equivalent of roughly 11 percent of production last year. In the past, retaliatory tariffs have impacted beef and cattle prices, so it bears watching going forward. It is also important to remember that the nature of beef trade very much depends on the trading partner. For example, we export a lot of beef to Mexico and Canada, but we are also a significant import market for those two countries. And while trade discussions typically focus on beef, a significant number of live cattle enter the US from Mexico and Canada each year. Conversely, over half of US beef exports go to Japan, South Korea and China, but those are almost exclusively export markets. The complexity of each of these trading relationships makes discussion of trade impacts very complex and something that will be interesting to follow this year.
Burdine, Kenny. “Four Questions the 2025 Cattle Market Will Need to Answer.” Southern Ag Today 5(2.2). January 7, 2025. Permalink