The January 2025 feeder cattle futures contract dropped roughly $25 per CWT from mid-July to mid-August. But, since early September, futures contract prices have rebounded about $15 per CWT. Points on the solid maroon line in the chart are the end of day futures contract prices from last Friday for each feeder cattle futures contract month. Points on the dotted black line are end of day prices back on September 6th, after the big decline.
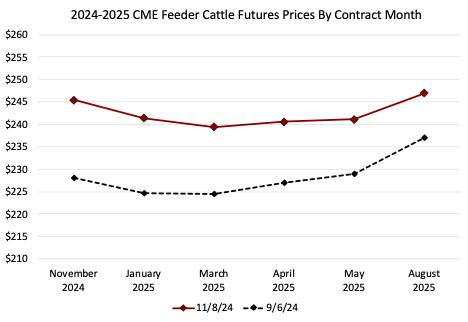
The chart nicely illustrates seasonality within the futures market. Auction prices for 750-pound feeder cattle are typically lowest in the spring months when those calves are yearlings. Futures prices reflect expectations of seasonal patterns too, but there are a few steps to thinking through the impact.
First, it’s important to remember that feeder cattle futures prices are the “market’s” expectation of what the CME Feeder Cattle Index will be at the end of the contract month. The “market” is made of buyers and sellers trading the futures contract. The feeder cattle index is calculated from auction prices for 700-899 pound steers collected by USDA-AMS for a 12-state region in the middle of the U.S. (there are no states east of the Mississippi River included in the index). It is a 7-day rolling weighted average, so today’s index value is a weighted average of the auction prices over the past week. Most auctions only operate one day per week so the 7-day average catches sales during a week’s period.
How does seasonality fit into this? If prices are typically expected to be lower during certain months (i.e. seasonality), then the futures contract prices for those months will likely be lower because traders are “baking-in” the seasonality expectations. The chart above is a good example. Since these prices reflect 700-899 pound feeder steers, the market (futures traders) is expecting auction prices (the CME index) to be lower during the spring months before rising seasonally as summer approaches.
This exercise illustrates the importance of understanding how the value of your cattle correlates to futures market prices for risk management or for forecasting prices. Your cattle may not be 800-pound steers sold in that 12-state region. But if you know your cattle are usually $10 above or $10 below the futures market at sales time, then then you can still use the futures market’s expectations to forecast the expected value of your cattle and to participate in price risk management tools.
Maples, Josh. “Feeder Cattle Futures Prices.” Southern Ag Today 4(46.2). November 12, 2024. Permalink