Whether or not herd rebuilding has started is among the most frequently asked questions. For the most part, the answer is there is not much evidence of rebuilding yet. The number of heifers held for herd replacement in the January 1 inventory report was the smallest on record. The quarterly cattle on feed reports indicated more heifers on feed than a year ago which implies more heifers placed in feedlots rather than kept in producers’ herds to produce a calf next year. However, there is a different set of data that might shed some more light on heifer retention.
Monthly cattle imports from Mexico have been greater than a year ago during every month of 2024. We import both feeder steers and spayed feeder heifers which eventually go to feedlots. The quarterly cattle on feed reports, which indicate the number of heifers on feed, would include those heifers that came from Mexico. If the number of feeder heifers imported from Mexico is large enough, it could suggest fewer U.S.-born heifers have been placed on feed in 2024. This could be an indication of fewer U.S. heifers available or that more heifers were held back for replacement.
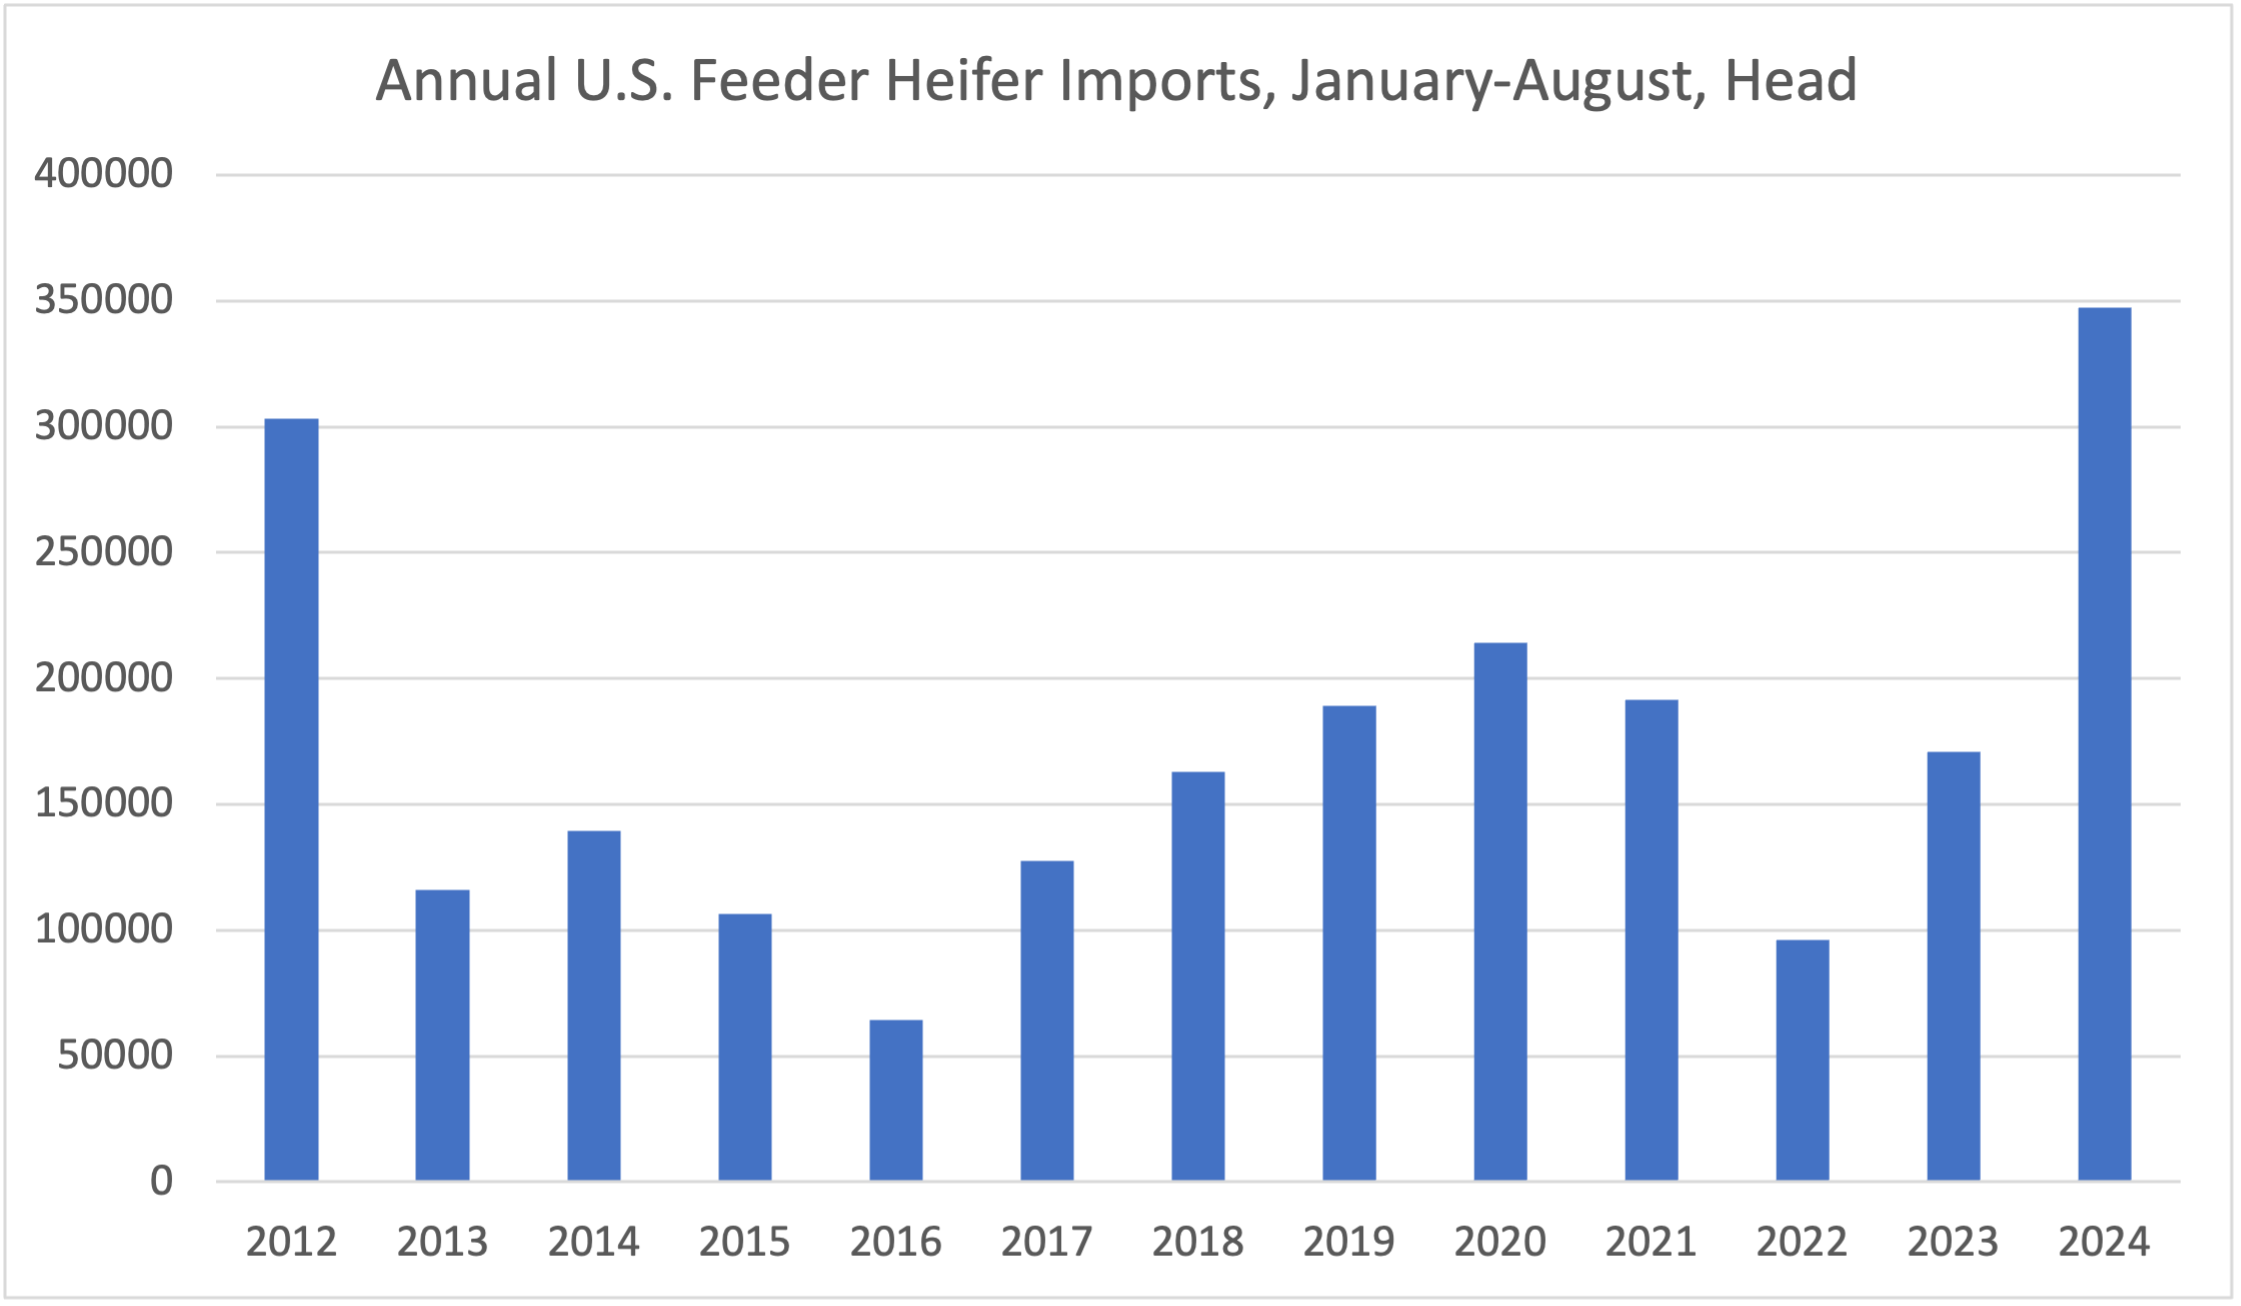
We have the weekly data for feeder steers and feeder heifers imported from Mexico beginning in January 2012. Through the week of August 24, there were 347,401 feeder heifers imported during 2024. That is 176,644 more than the same period last year. It is also the most feeder heifers imported for this time period going back to at least 2012 when 303,290 head were imported. Feeder heifers make up 37 percent of total feeder cattle imports, the highest since at least 2012. Over the same number of weeks, total feeder cattle imports (including steers) are the second largest behind only 2012.
What does this mean for U.S. herd rebuilding? If we take the total number of heifers on feed on July 1 and then subtract the number of feeder heifers imported from Mexico during January-June, it would indicate 126,784 fewer domestic heifers on feed than last year. It is probably too big of an assumption to think all of those imports have already been placed in feedlots since many imported feeder cattle go to pasture before heading to feedlots. Still, this result might indicate that a few more domestic heifers have been held back, although some of this decline could simply be due to fewer heifers born in the U.S. We certainly aren’t convinced of any widespread expansion yet. However, larger heifer imports from Mexico are propping up the percentage of U.S. heifers on feed and need to be carefully considered when making comparisons to previous years.
Anderson, David, and Josh Maples. “Feeder Heifer Imports from Mexico and U.S. Herd Rebuilding.” Southern Ag Today 4(36.2). September 3, 2024. Permalink