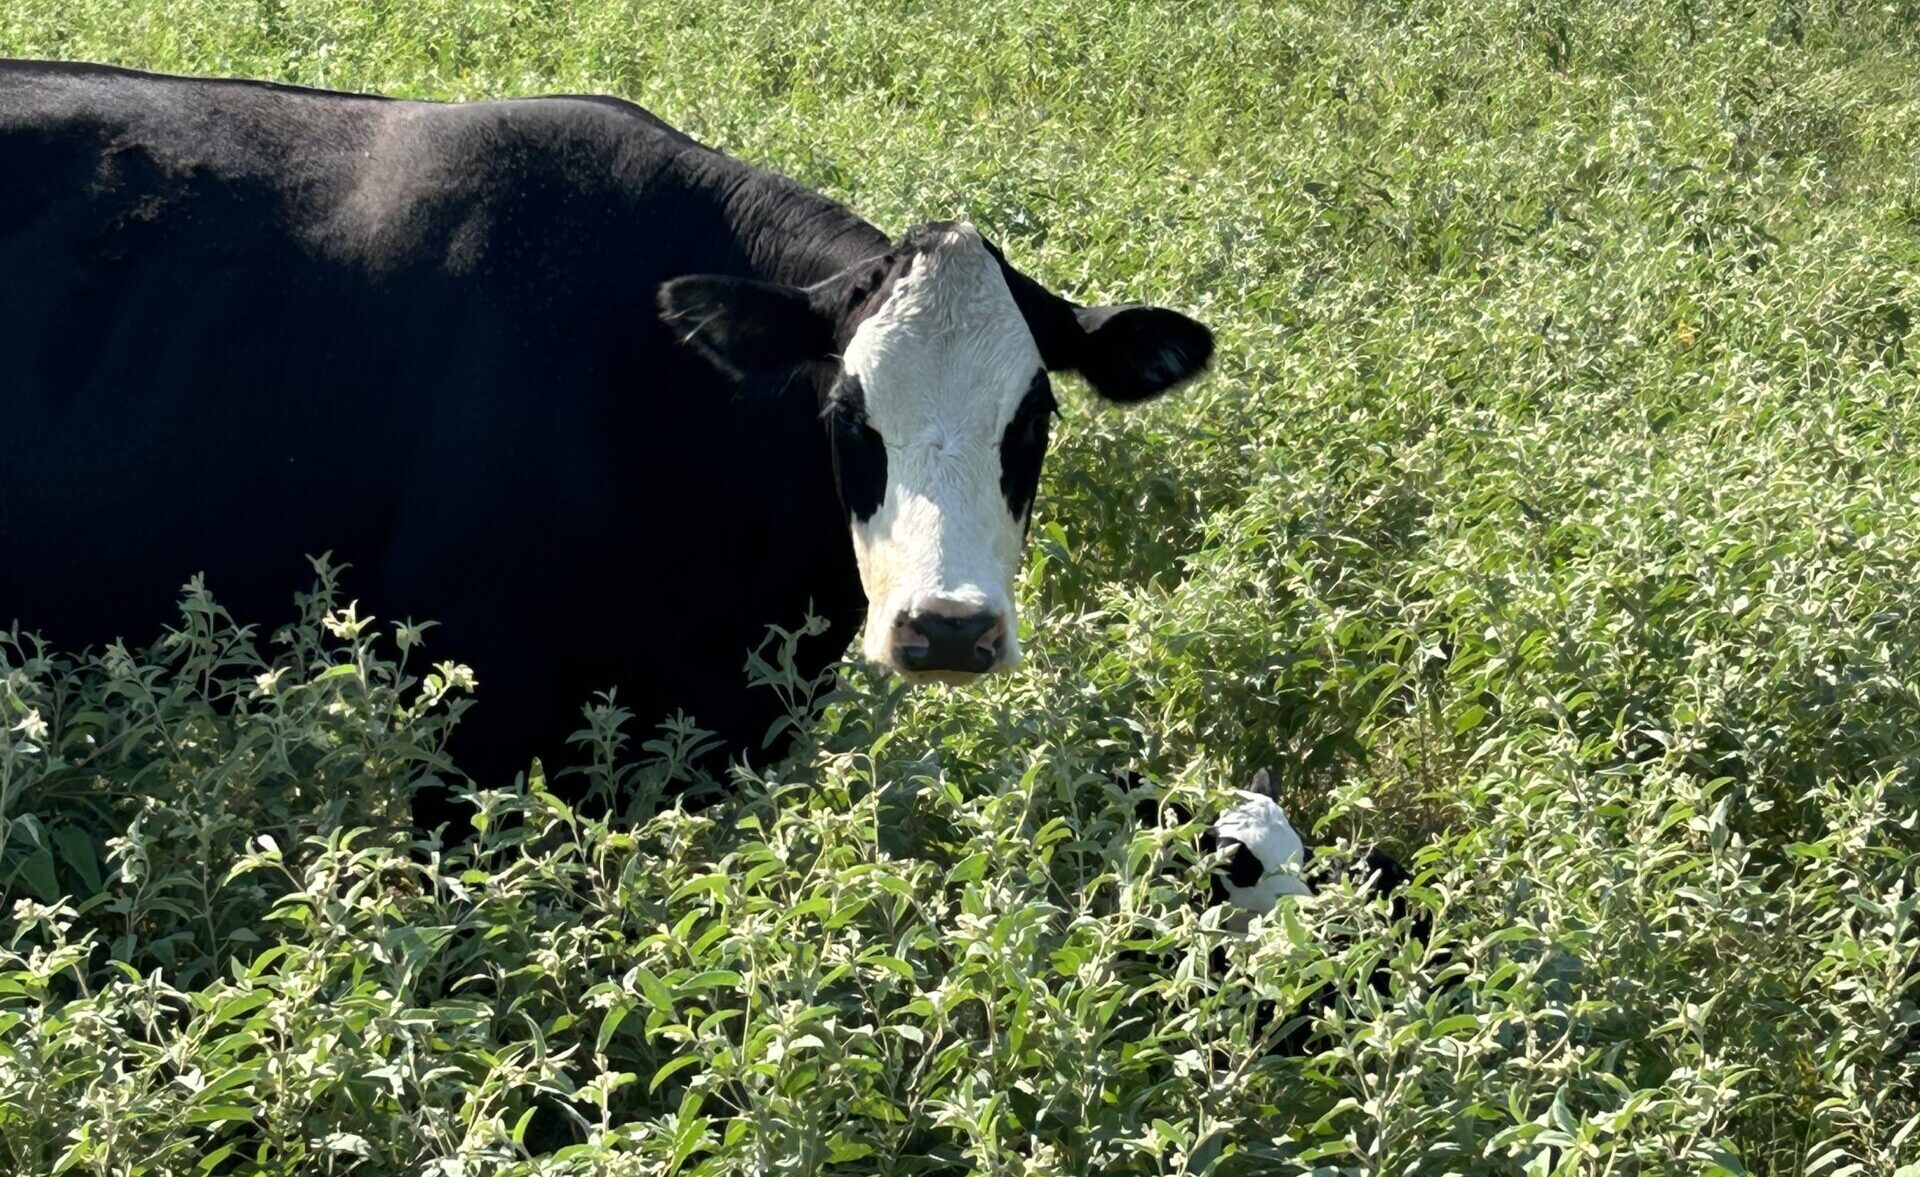
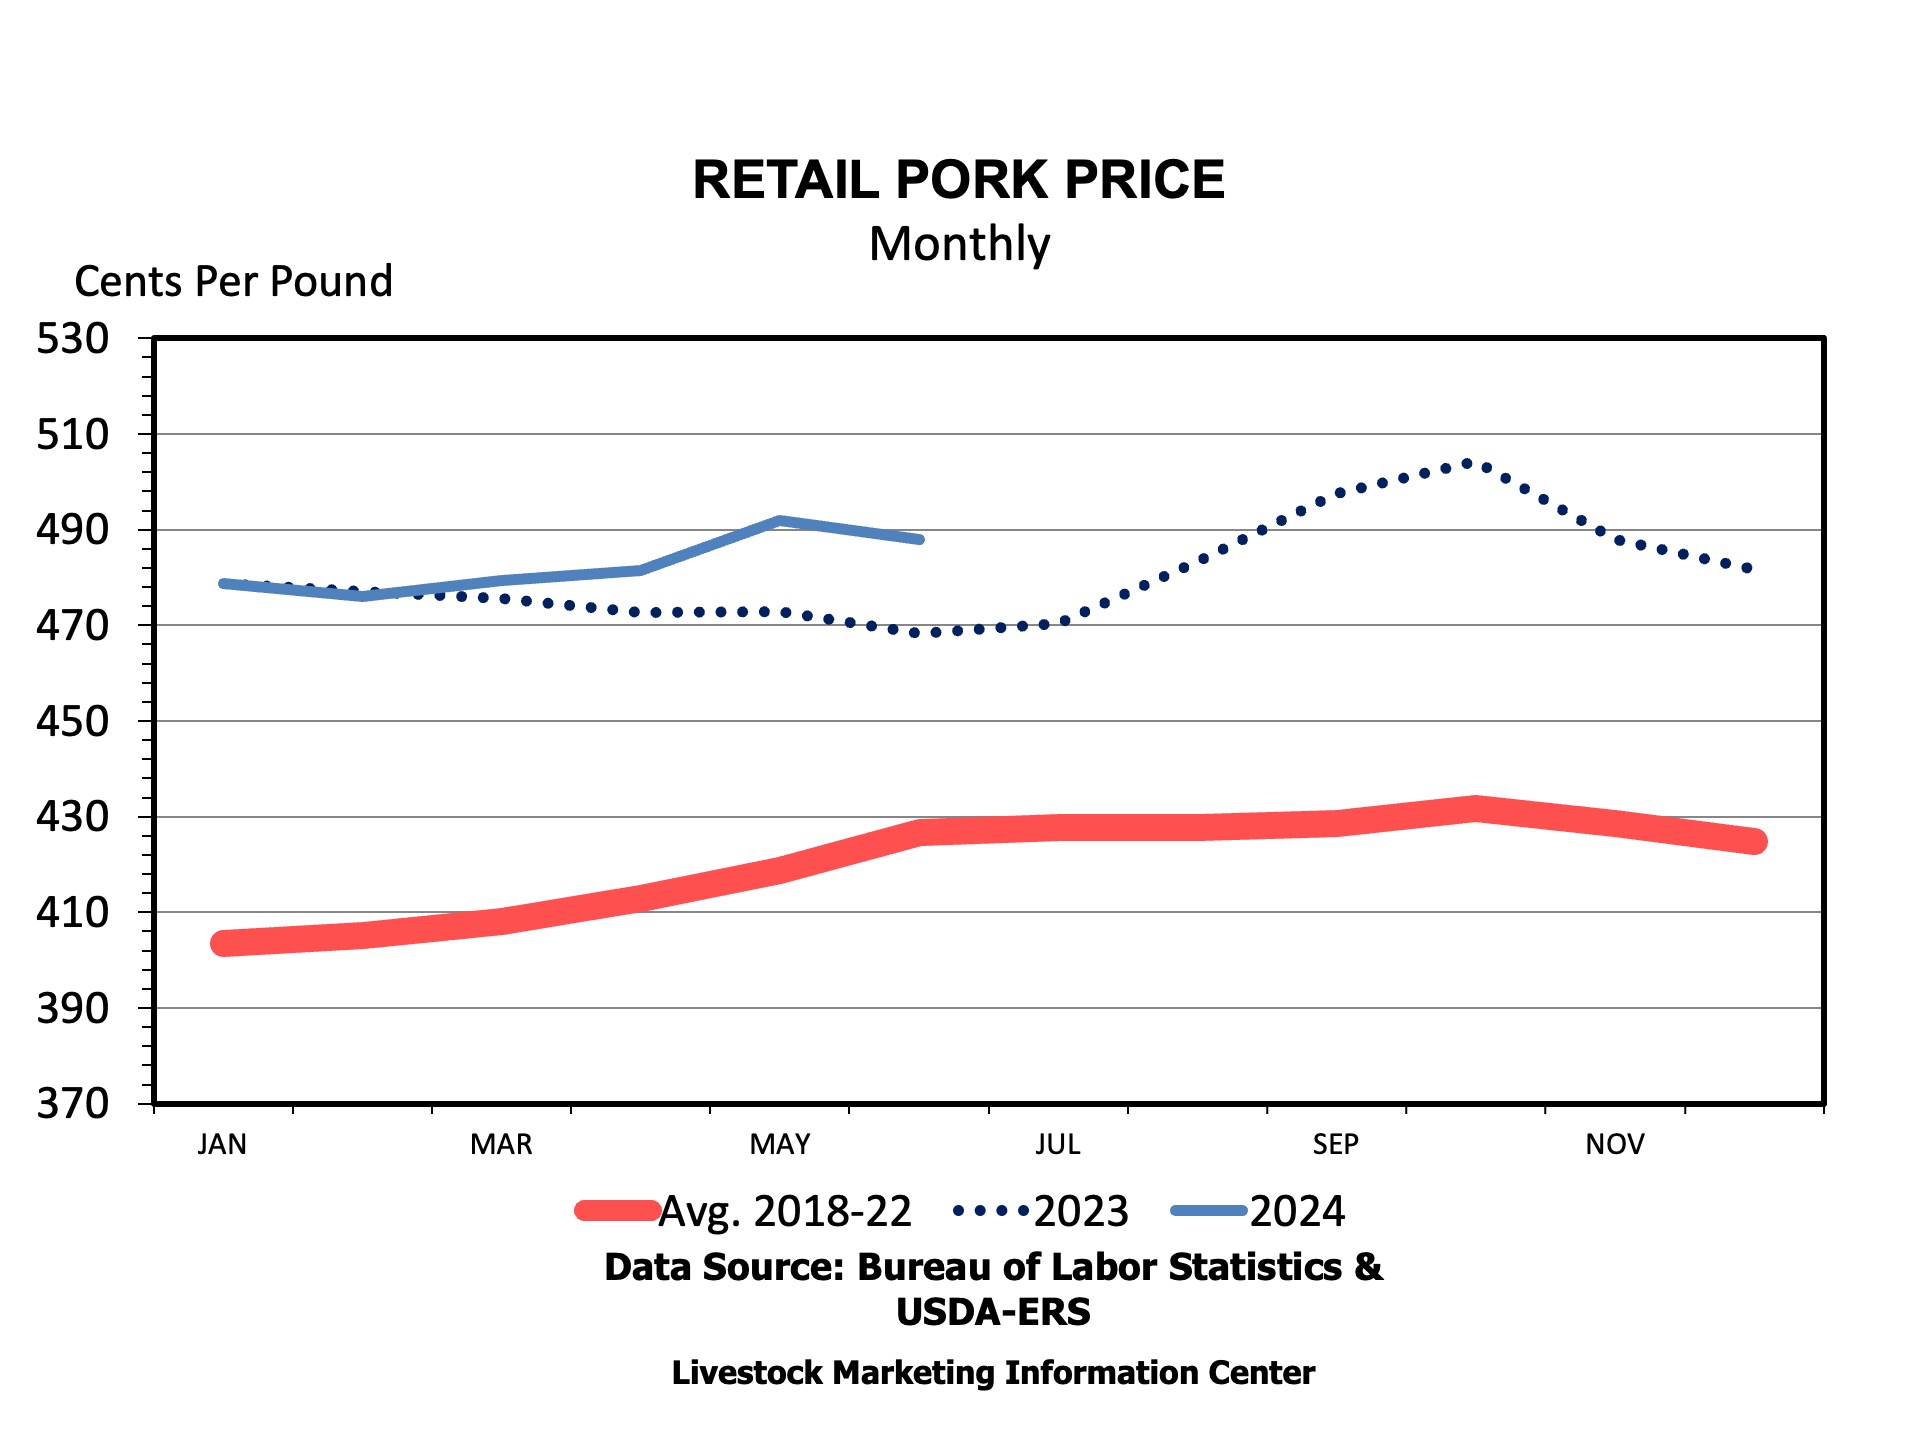
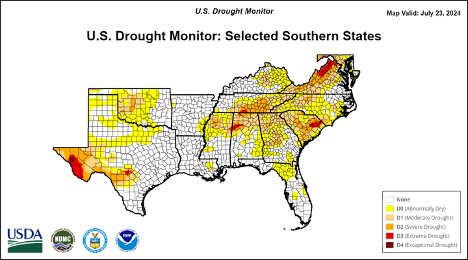
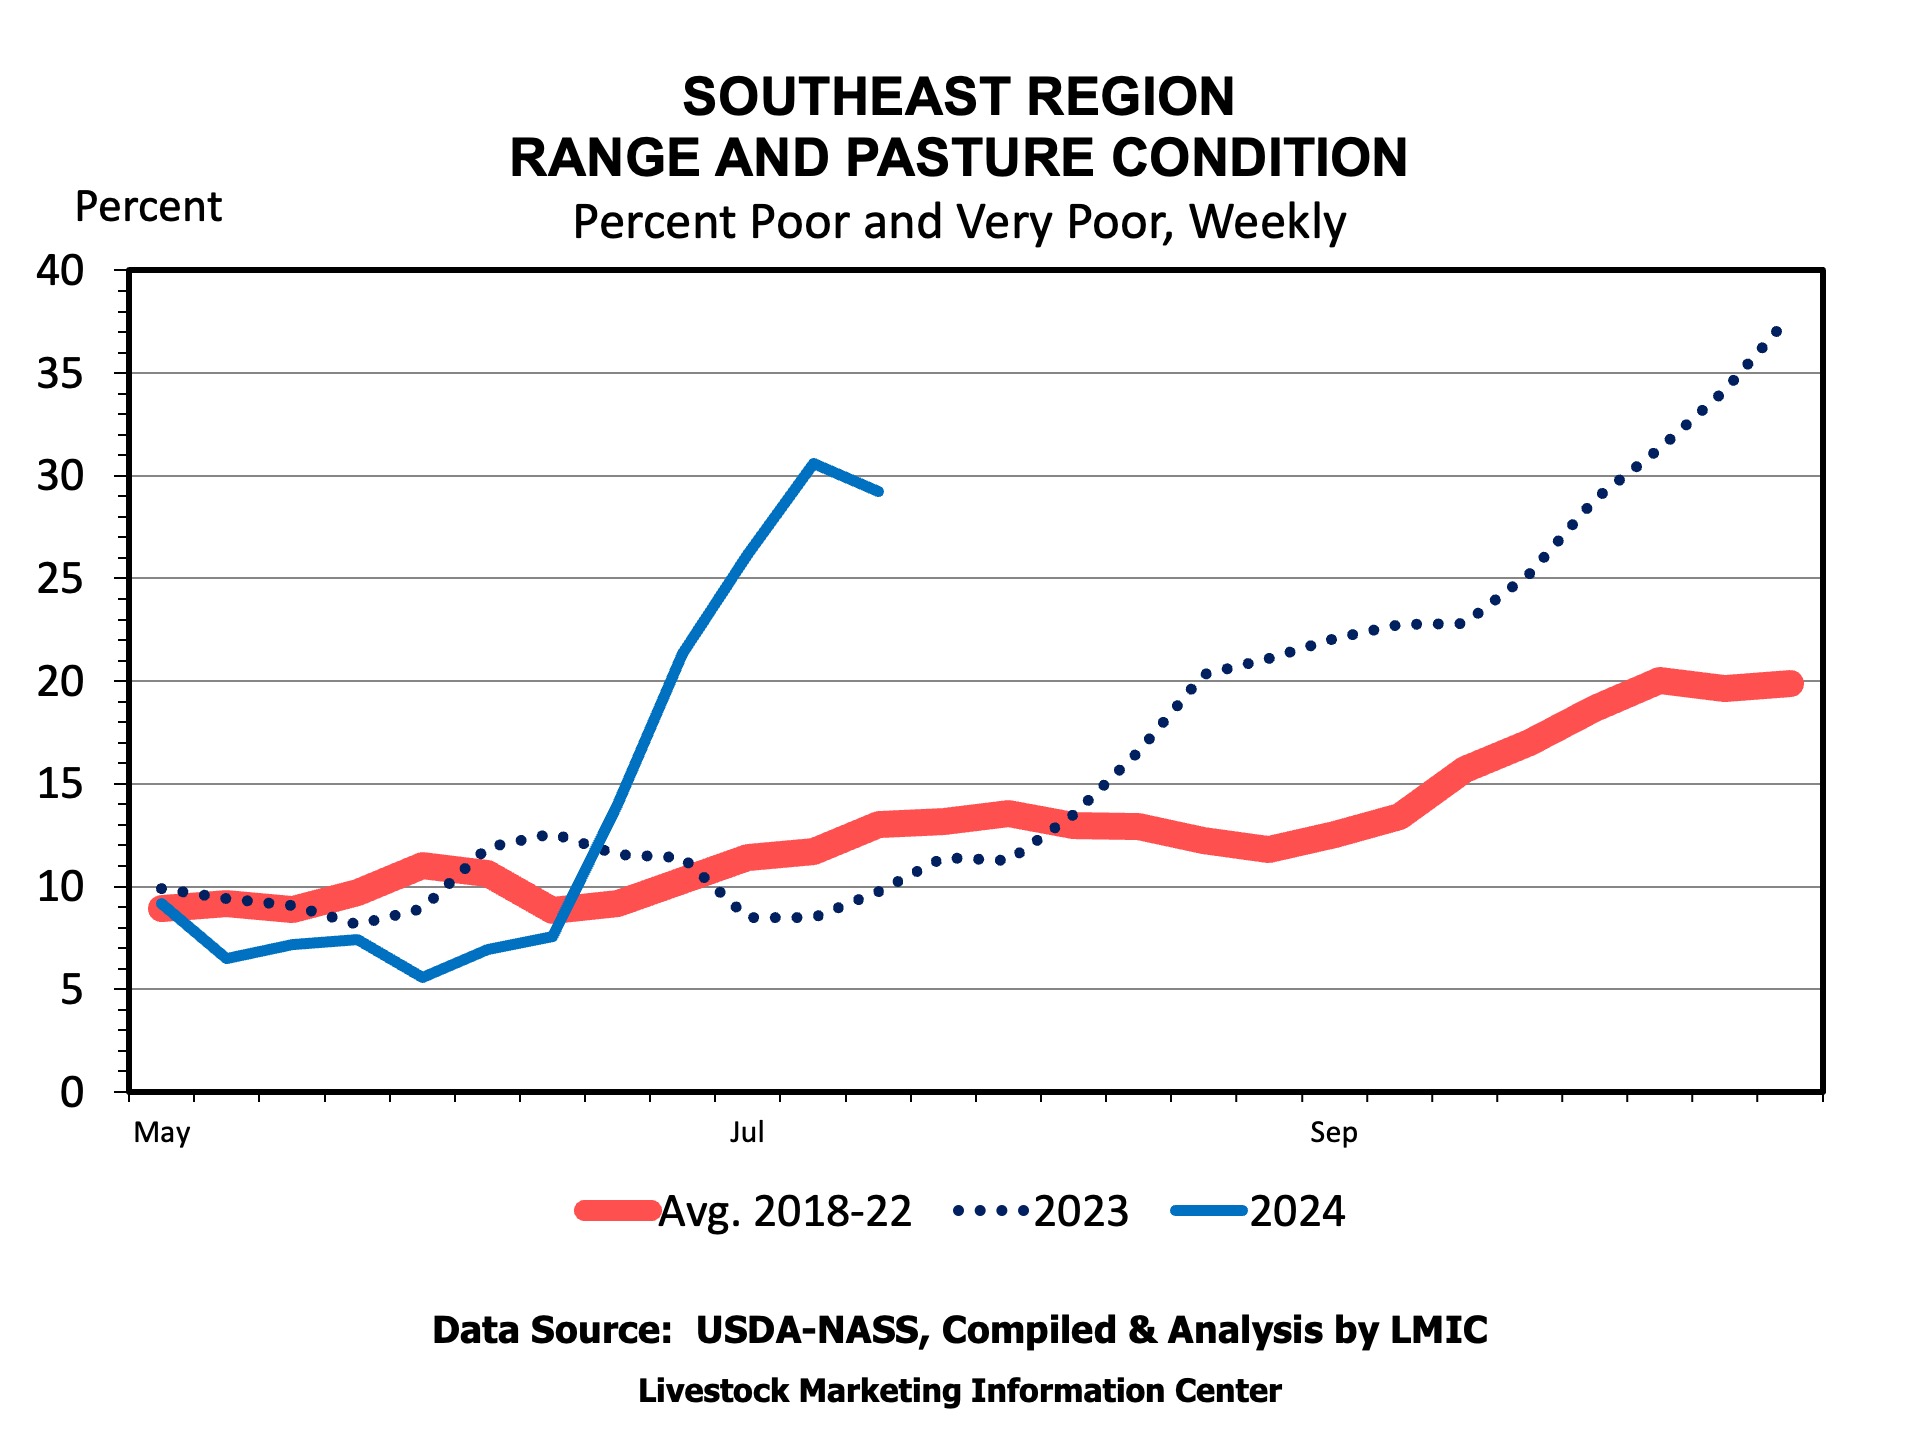
Category: Livestock Marketing

  • New Commercial Poultry Breeder Housing Under Economic Stress

    New Commercial Poultry Breeder Housing Under Economic Stress

    While the overall demand for chicken remains strong, a couple of production trends caught my attention last year that have continued into 2023. It seems there could be a new “normal” in the broiler industry – fewer chicks hatched per broiler-breeder hen placed. Breeder hens produce the fertile eggs that will be hatched to produce the broilers that are eventually slaughtered for chicken products. Figure 1 shows roughly a 6% drop from the long-term average in chicks hatched per hen per month. Multiplied across the industry’s breeder farms, that could result in millions fewer chicks per year. This could be caused by any number of factors. Whatever the cause, the industry needs the chicks to keep up with demand for chicken. To offset this loss, figure 2 shows that about 8% more hens are currently in the field than in the past. One could argue that this is the easy solution to make up the difference. However, that solution eventually requires additional breeder housing. That leads to a difficult economic situation for commercial poultry companies and their contract growers. 

    In my last article for SAT, I discussed the increasing cost of broiler housing and its impact on growers’ ability to build new farms or expand existing farms. Breeder growers are facing similar challenges. A typical breeder farm today consists of four to eight 40’ x 500’ houses with enclosed concrete hallways between the houses and cooled egg storage facilities. In addition to the normal environmental control systems, these farms have specialized equipment like nesting boxes, egg conveyors and split feeding / drinking areas for hens and roosters. The structures are also specialized for the task of keeping large hens and roosters comfortable and producing fertile eggs for 40+ weeks. To contend with labor shortages, growers and integrators have had to adopt labor saving equipment for egg collection and crating. All such specialized housing and equipment comes at a premium. Add the general increase in building materials and labor costs over the last few years and the resulting cost of a new four-house breeder farm in the southeast today is $32.50 per square foot or approximately $2.6 million or more. This does not include the cost of the land itself, extensive land prep, or any cost for ancillary equipment. 

    For example, if we assume a USDA Farm Services Agency guaranteed loan that reduces equity requirements down to 10% and include estimated additional costs and fees, a grower will need to borrow approximately $2,795,000 to get a new four house breeder farm up and running on land they already own. The corresponding annual payment (20-year loan, 8% APR) would be approximately $284,677. At an average annual income of $4.60 per square foot for new breeder farms (ref 2), the annual gross revenue would be $368,000. Annual operating expenses have been shown to cost approximately 25% of gross revenue on new breeder farms, or in this case, $92,000 per year. This leads to a shortfall in net revenue of ($8,677) per year for the grower. Integrators have recognized this is an untenable situation for growers and a barrier to obtaining additional breeder housing. In response, some have offered direct cash incentives that lower the effective cost of the new houses while others include additional pay per dozen eggs for new housing. These direct cash incentives must decrease loan amounts and increase net revenue to meet the typical bank requirement of a 1.30 debt service ratio if new loans are to be made. In the scenario depicted in table 1, a cash incentive of $7.00 per square foot combined with a revenue equal to $4.82 per square foot would result in a positive net return, meet debt service requirements, and allow for new farms to be built. It remains to be seen whether such incentives would support enough new housing to overcome what could become a serious challenge for some companies.  

    Figure 1:

    Figure 2.

    Table 1.

    Four New 40′ x 500′ Breeder HousesNo IncentiveIncentive
    Incentive Payment $7.00 per Square Foot$0 $560,000
    New Farm Loan 20-year, 8% APR, 10% Eq.$2,795,000 $2,215,400
    Interest Paid Over Loan Period $2,898,538 $2,297,468 
    Gross Revenue per Square Foot $4.60 $4.82 
    Annual Gross Revenue $368,000 $385,336 
    Annual Loan Payment ($284,677)($225,643)
    Annual Operating Expenses25% of Gross Revenue($92,000)($92,000)
    Annual Net Return($8,677)$41,923 
    Debt Service Ratio0.971.30

    Ref: 

    1. Livestock Marketing Information Center: www.lmic.info
    2. New Farmer’s Guide to the Commercial Broiler Industry: Farm Types & Estimated Business Returns: www.aces.edu/blog/topics/farming/new-farmers-guide-to-the-commercial-broiler-industry-farm-types-estimated-business-returns/

    Brothers, Dennis. “New Commercial Poultry Breeder Housing Under Economic Stress.Southern Ag Today 3(40.2). October 3, 2023. Permalink

  • All Markets are Local

    All Markets are Local

    What’s the price of hay? An adage that I often hear is that all markets are local. This is especially true for the hay market.  Numerous factors influence the local price of hay including but not limited to supply and demand, weather, quality, storage, age, variety, and delivery costs. In other words, the answer to what’s the price of hay is “it depends!”

    Figure 1, Monthly Hay Price Received (excluding Alfalfa) from January 2021 through July of 2023 shows the average price of hay for selected states and the U.S. average. Hay prices for the states of Kentucky, Missouri, Oklahoma, and Texas are included. These are the states that have monthly hay prices reported by USDA NASS Quick Stats. 

    Keep in mind the adage that all markets are local, especially the hay market.  Hay is trucked from where it is plentiful and cheaper to where it’s in short supply.  Shipping and arbitrage makes hay prices move together.  The Missouri and Oklahoma hay prices, on average, are 40% and 46% respectively, lower than the U.S. average hay price. The Kentucky and Texas prices trend very close to the U.S. average price.  The effect of summer drought in Texas and the Southwestern areas of the U.S. is reflected by the increased hay prices across all the states and the U.S. at the beginning of the summer of 2022.

    These monthly prices from USDA NASS can be useful in looking at season and/or long-term trends. For more timely prices check weekly hay prices at:

    https://www.ams.usda.gov/market-news/hay-reports

    Runge, Max. “All Markets are Local.Southern Ag Today 3(39.2). September 26, 2023. Permalink

  • Proposition 12 Preliminary Price Impacts

    Proposition 12 Preliminary Price Impacts

    On July 1st, 2023, California’s Proposition 12, which sets production standards for pork sold in California, officially came into effect. This animal welfare law requires that all uncooked pork sold in California comes from the offspring of sows that are kept in pens with at least 24 square ft. of space.  California accounts for approximately 14% of U.S. pork consumption but less than 2% of pork production, leaving producers and processors in major hog producing states, such as those in the Plains, Corn Belt, and North Carolina, to decide if it is economically viable to meet Prop 12 requirements and continue to supply the California market. A Sacramento County court order extended the time for non-compliant pork that was in the supply chain before July 1st to continue to be sold in the California market until December 31st, 2023. This modification was expected to help mitigate any supply chain disruptions or price spikes. 

    Nevertheless, early indications from Circana retail-level scanner data reveal signs of strain in California markets after July 1st. Pork prices have surged, expenditures are down—a classic symptom of a supply shock.  For example, pork ribs and pork loin, the top two consumed fresh pork* products in California, have witnessed substantial price hikes by the end of July. The average sales price of pork ribs and loins were 25% and 43% higher, respectively, in California, in August, compared to June. In comparison, pork rib and loin average sales prices for the rest of the U.S. were 6.4% higher and 5.4% lower over the same period. 

    Concurrently with the price increase, there has been a notable decline in the volume of pork purchased in California. The total volume of fresh pork purchased in California decreased by 23% from June 2023 to August 2023. This volume represents 37% less than the average volume sold in California in August from 2020-2022. As depicted in the graph below, the volume in California generally follows the rest of the U.S. volume patterns up until the large deviation in July 2023. California is the first and largest state to implement this type of law, but it is worth noting that Massachusetts also recently enacted a similar law. These developments are likely to have far-reaching implications for consumers in affected states and livestock producers throughout the United States, including many in the South.

    *Fresh pork products reported in the scanner level data include AO pork, ground pork, leg (fresh ham), pork ingredient cuts, pork loin, pork offal, pork ribs, and pork shoulder.

    Figure 1: Pork Rib and Loin Average Sales Price

    Source: Authors calculations using Circana Retail Sales Data

    Figure 2: Fresh Pork Sales, by Volume

    Source: Authors calculations using Circana Retail Sales Data

    Hawkins, Hannah. “Proposition 12 Preliminary Price Impacts.Southern Ag Today 3(38.2). September 19, 2023. Permalink

  • Are You Buying Hay For The Winter?

    Are You Buying Hay For The Winter?

    As the 2023 hay season comes to an end for much of the South, the last cuttings are being baled and balers are being parked for the year.  Loader tractors will have some rest before it’s time to start feeding out hay.  In some parts of the South, feeding has been going on for some weeks and drought stopped hay production.  When purchasing hay here are some questions to consider:  How much hay do I need to make it through the winter?  How much can I spend on hay?  These questions can be answered by planning.  Working through a budget for the operation will show the potential cost incurred by various situations, whether it is a change in cost or a change in the amount needed.

    Hay Quantity.

    Hay is measured primarily by two methods: by the bale or by the ton. Most commonly hay marketing occurs by the bale. When planning on hay needs for the winter or working through a budget, focus on the tonnage required.  Accounting for hay needs by the ton will allow for pricing comparison across various bale sizes, assuming constant moisture levels.  Table 1 provides a standard bale weight estimate based on bale size.  Using tons as a measurement will allow for livestock consumption based on pounds consumed per day.  This method does require some pencil work but will provide more efficient use of hay resources.

    Source: D. Hancock, Bale Weight Estimation Table July 2011

    Hay Quality:

    Here is the most common hay quality test: “It’s got good color and smells good, must be good.”  While I’m not going to disagree with long-standing tradition, there is value in the marginal investment of requesting fertilization records/soil sample data, herbicide records, and a forage sample.  Is this worth the trouble?  It will depend on the willingness to minimize risk.

    Fertilization and soil sampling records will illustrate that the forage grown had fertility management applied correctly.  The presence of weed load in hay can be a problem.  To safeguard against this, herbicide records will show that unwanted seeds/plant matter were managed.  A forage sample provides the best picture of the quality of the purchased hay.  The sample results will also provide insight into additional nutritional requirements.  Knowing the quality can also help fine-tune feeding to meet the nutritional needs of the cows.

    In closing, feeding livestock during low/no grazing periods adds to the cost of the operation.  More information can allow for the efficient use of operation dollars and decreased cost in herd health/losses. Lastly, to give some “cud to chew on,” consider the choices typically made when purchasing a commodity blend supplement feed.  Would you purchase a load of commodity blend feed based on a guess of how much it weighs?  Or would you request a weigh ticket to verify amount purchased?  How about the quality of the feed?  It helps to know what the nutritional value is to make the best decision.  All of this takes extra work; however, management of input cost is a great tool to ensure profit potential.  

  • A Check in on Boxed Beef Cutout Value

    A Check in on Boxed Beef Cutout Value

    At conferences, field days, and producer meetings throughout the Spring and Summer, many producers have often asked, “When will this market bust, and start a downward trend?” Answering this one question isn’t simple. There are various factors that impact the prices across the beef supply chain. One indicator of future price trends throughout the beef supply chain is the Boxed Beef Cutout Value. The boxed beef cutout represents the estimated gross value of a beef carcass based on prices paid for individual beef items (primal cuts) derived from a beef carcass. Essentially, as consumers pay for beef items derived primal cuts (i.e. steaks from the rib primal) in conjunction with expected seasonal demand, retailers, and food service entities purchase primals or boxes of specific cuts that translate into the price and value seen in the boxed beef value.  

    Figure 1 displays the weekly Choice boxed beef cutout value. The red line denotes the 5-year average from 2017-2021, the dotted blue line is last year’s (2022) weekly values, and the orange dashed line this year’s weekly values up through 8/25/2023. Through 2023, the cutout value has been above last year and the 5-year average. The low of $265.82/cwt was in early February. Since then, the weekly value trended up and peaked at $339.93/cwt in mid-June. Through the rest of the summer, the cutout decreased in value from the peak but has remained between $300-$320/cwt. The 5-year trend and 2022 cutout values remained relatively steady during the remaining months of the calendar year. If 2023 follows trend, then the value is expected to remain above the previous year and the 5-year average. 

    Other factors impact this value, such as fed cattle supply, which are currently tight given the most recent cattle on feed report. The amount of beef grading Prime, Choice, and Select affects relative supplies of each grade even though total beef supplies are tighter.  Given that the national herd is still currently in liquidation mode, fed cattle supply is going to get even tighter over the next couple of years. When looking at the boxed beef value, there are few market signals indicating that it will be decreasing anytime soon, so when answering the question at the beginning of this article, my answer is, “not any time soon”. 

    Figure 1. Weekly Boxed Beef Cutout Value

    Data Source: USDA-AMS, Livestock Marketing Information Center

    Martinez, Charley. “A Check-in on Boxed Beef Cutout Value.” Southern Ag Today 3(36.2). September 5, 2023. Permalink