For some of us, Christmas means tamales! To stick with the traditional tamale, this means pork. Yes, some people do make other kinds, and a wide variety are traditional in other countries and the Delta, but we will stick with pork for today’s article because it’s a good reminder to check on recent pork prices.
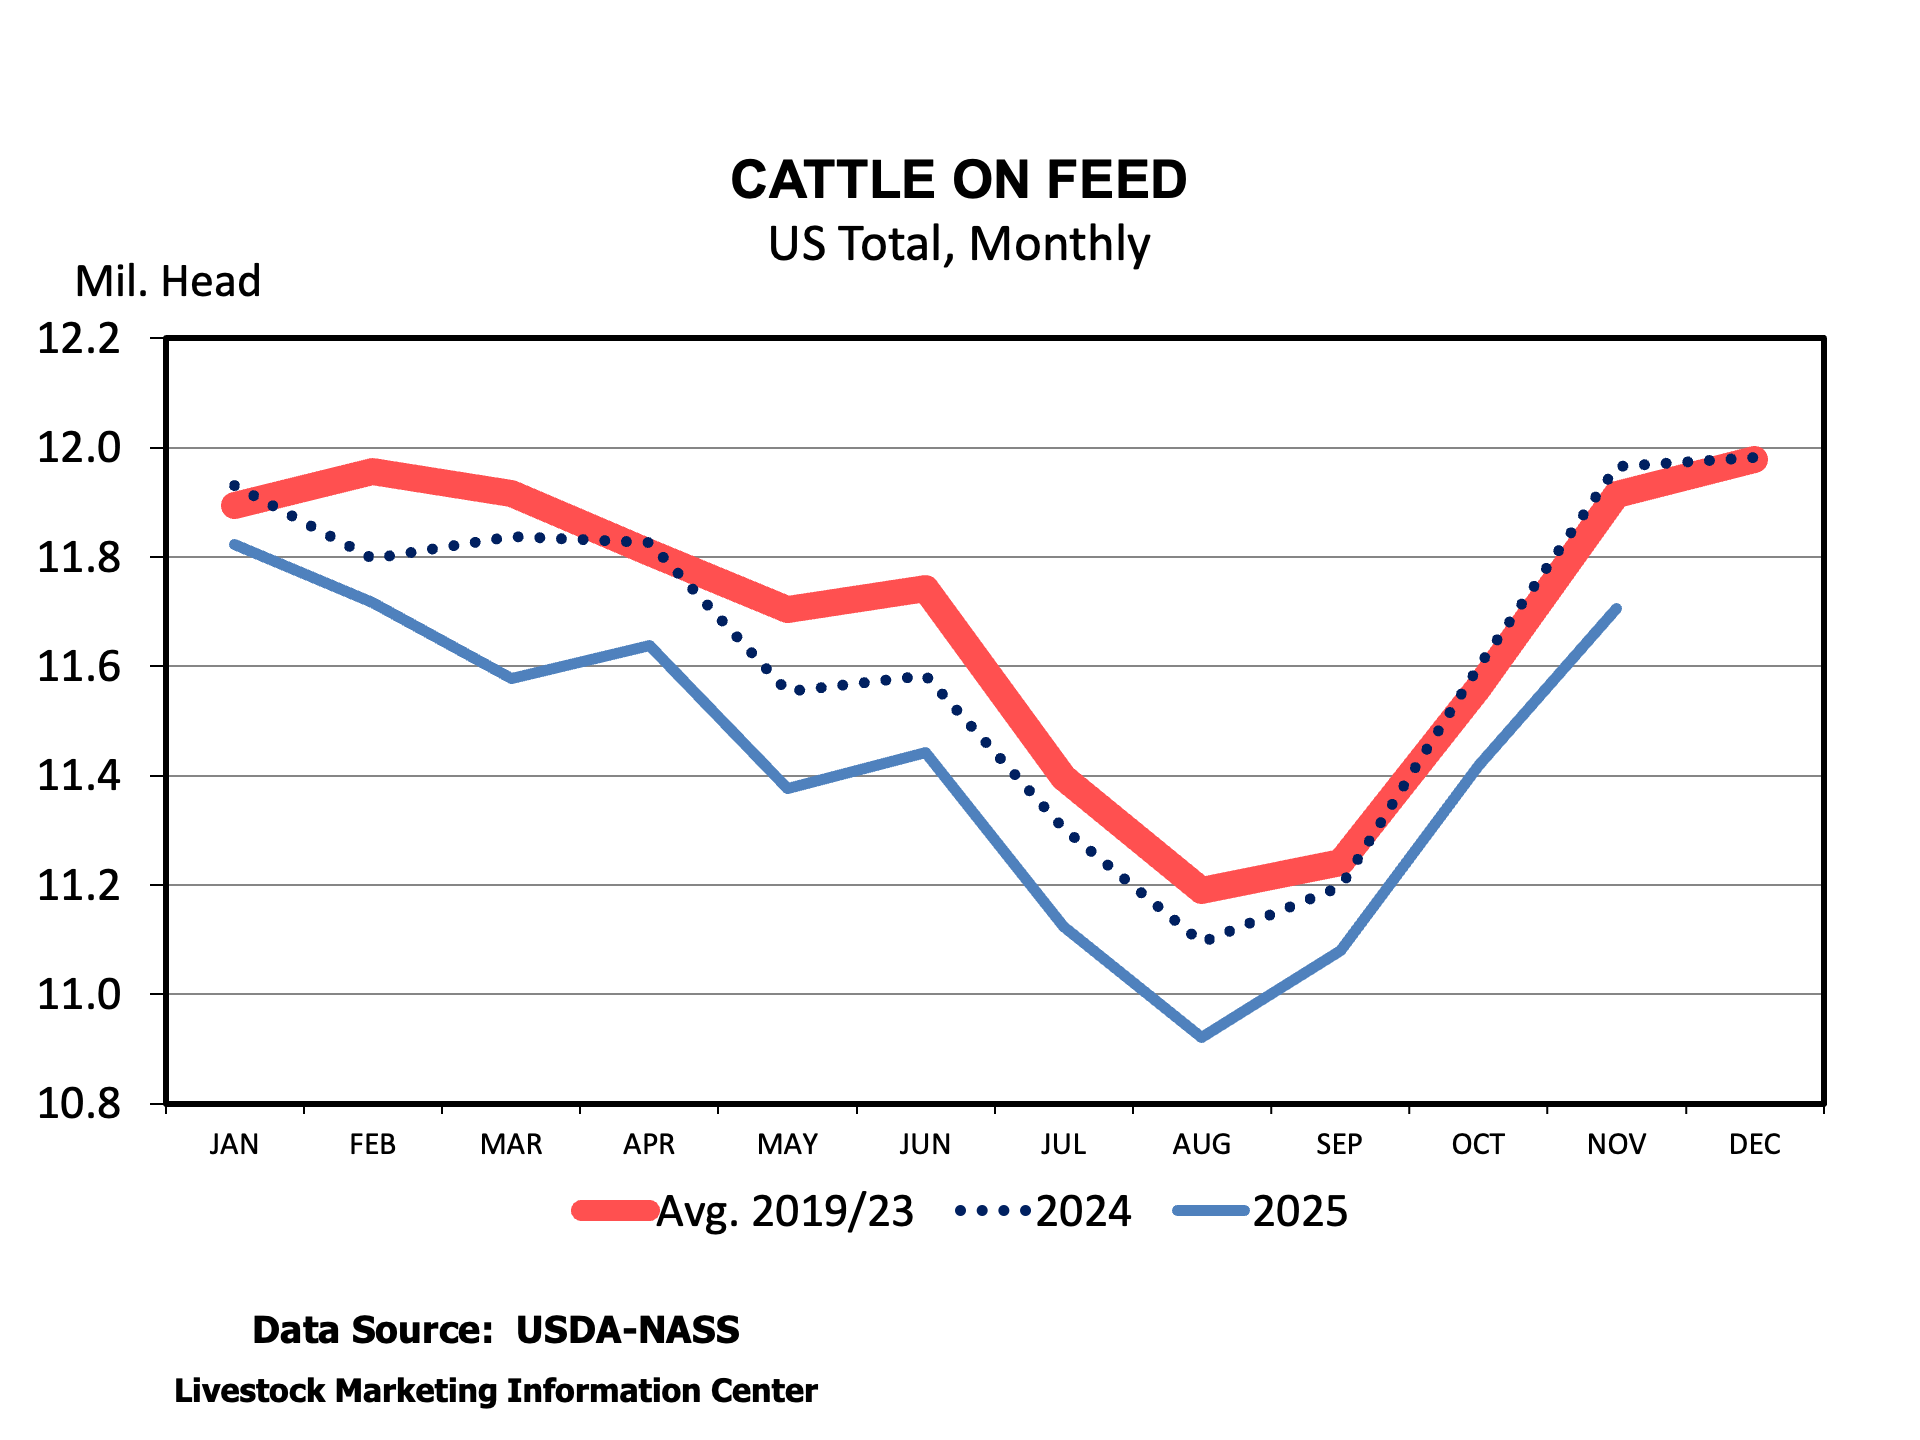
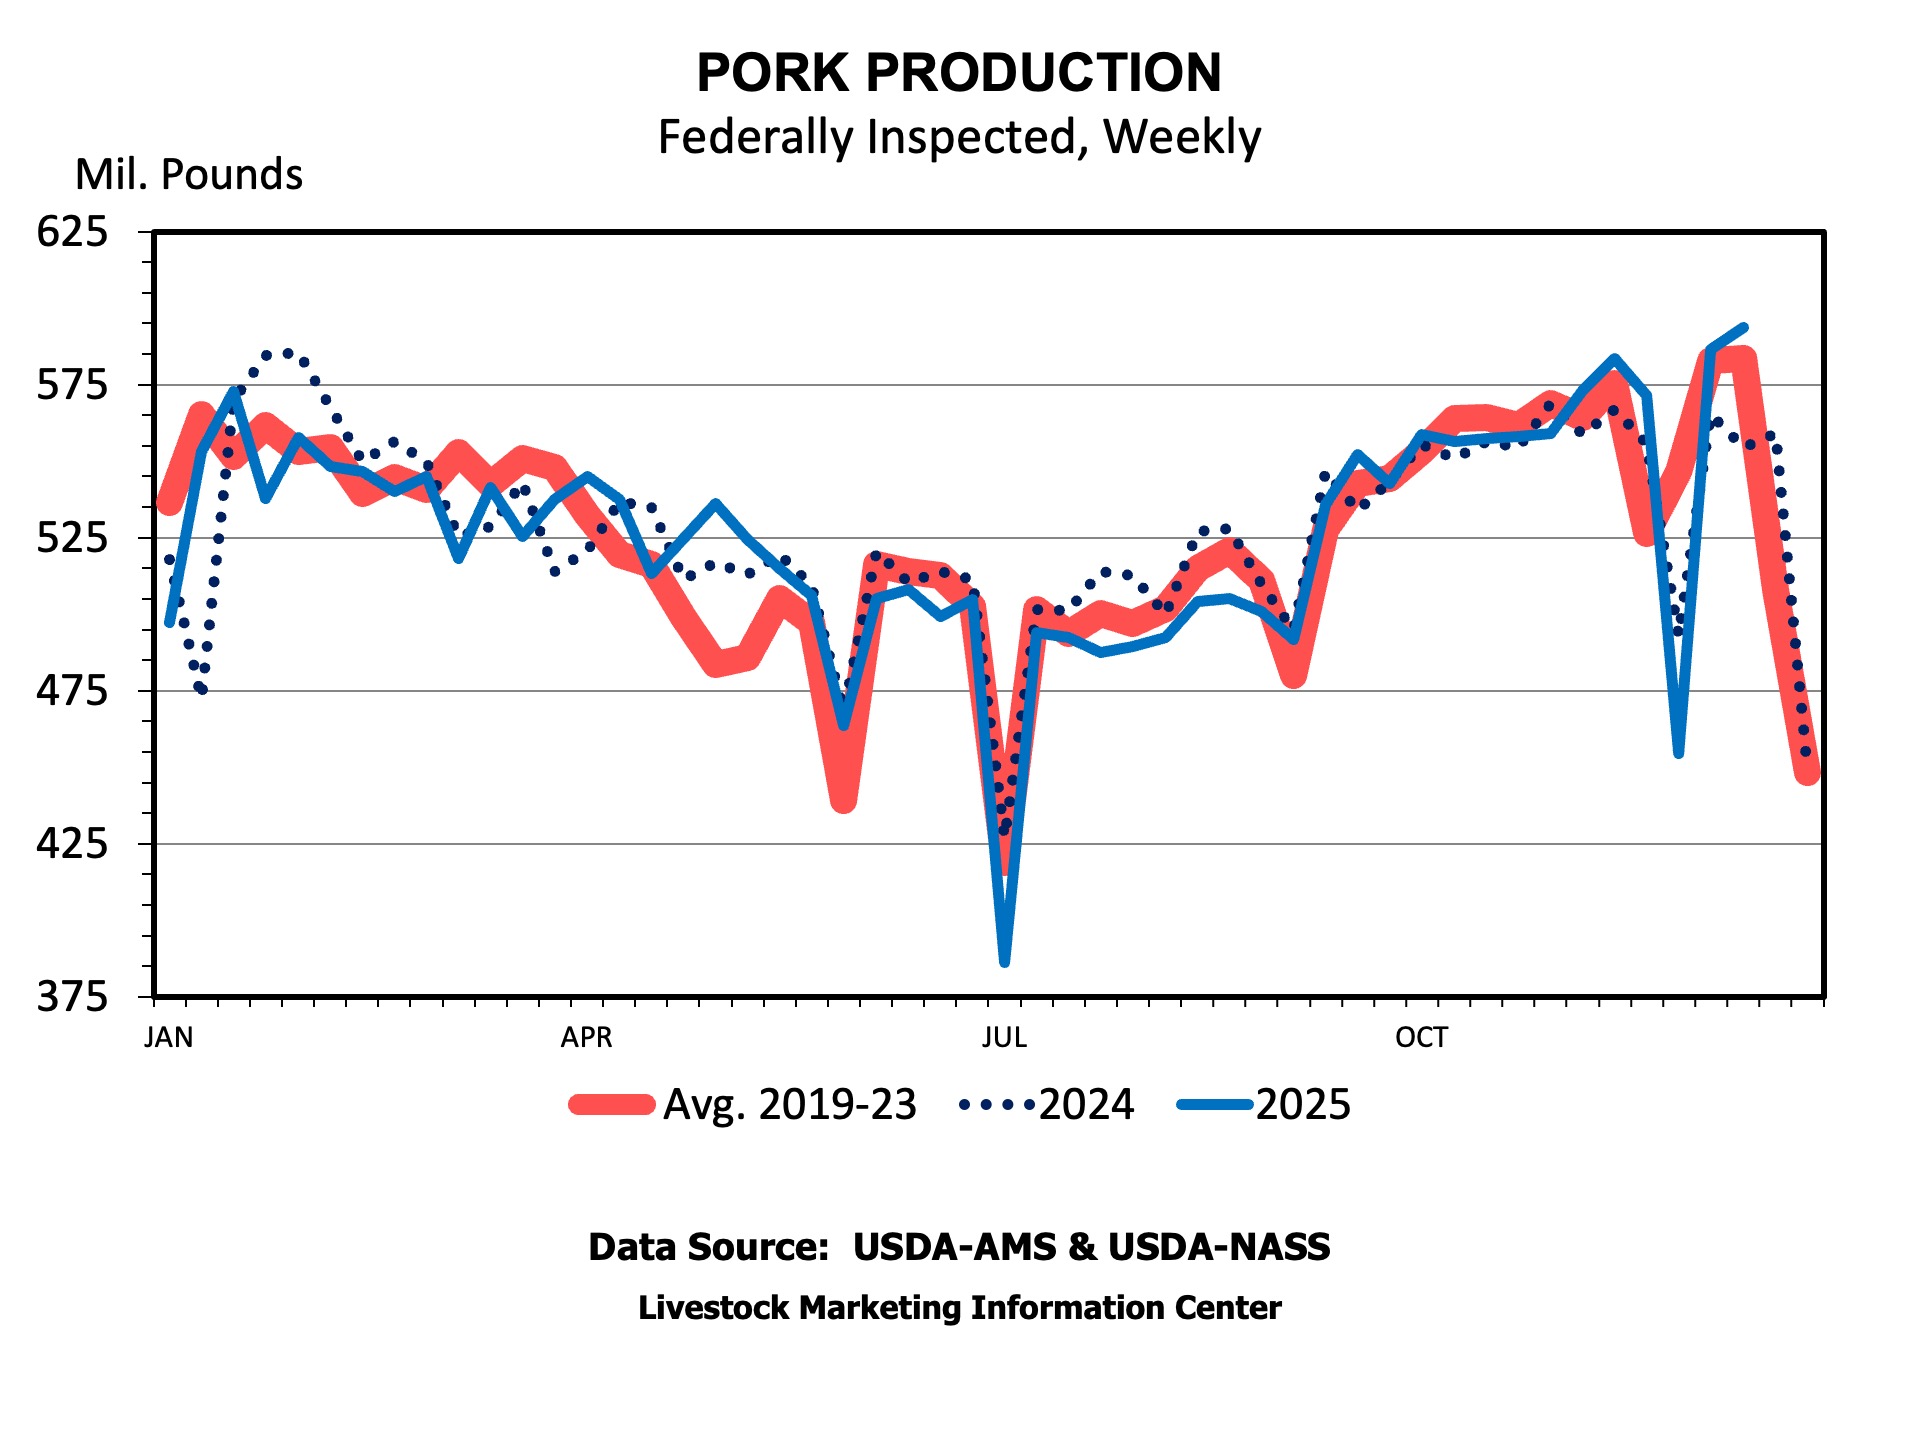
Hog and pork prices tend to have a highly seasonal pattern that, generally, peaks mid-year. That price seasonality is related to production seasonality. Hog slaughter is the lowest during the summer and tends to peak in the fall. Dressed weights per carcass are usually the lowest in the heat of summer. Following slaughter and weights, pork production bottoms are the lowest in the summer and peaks in the fall.
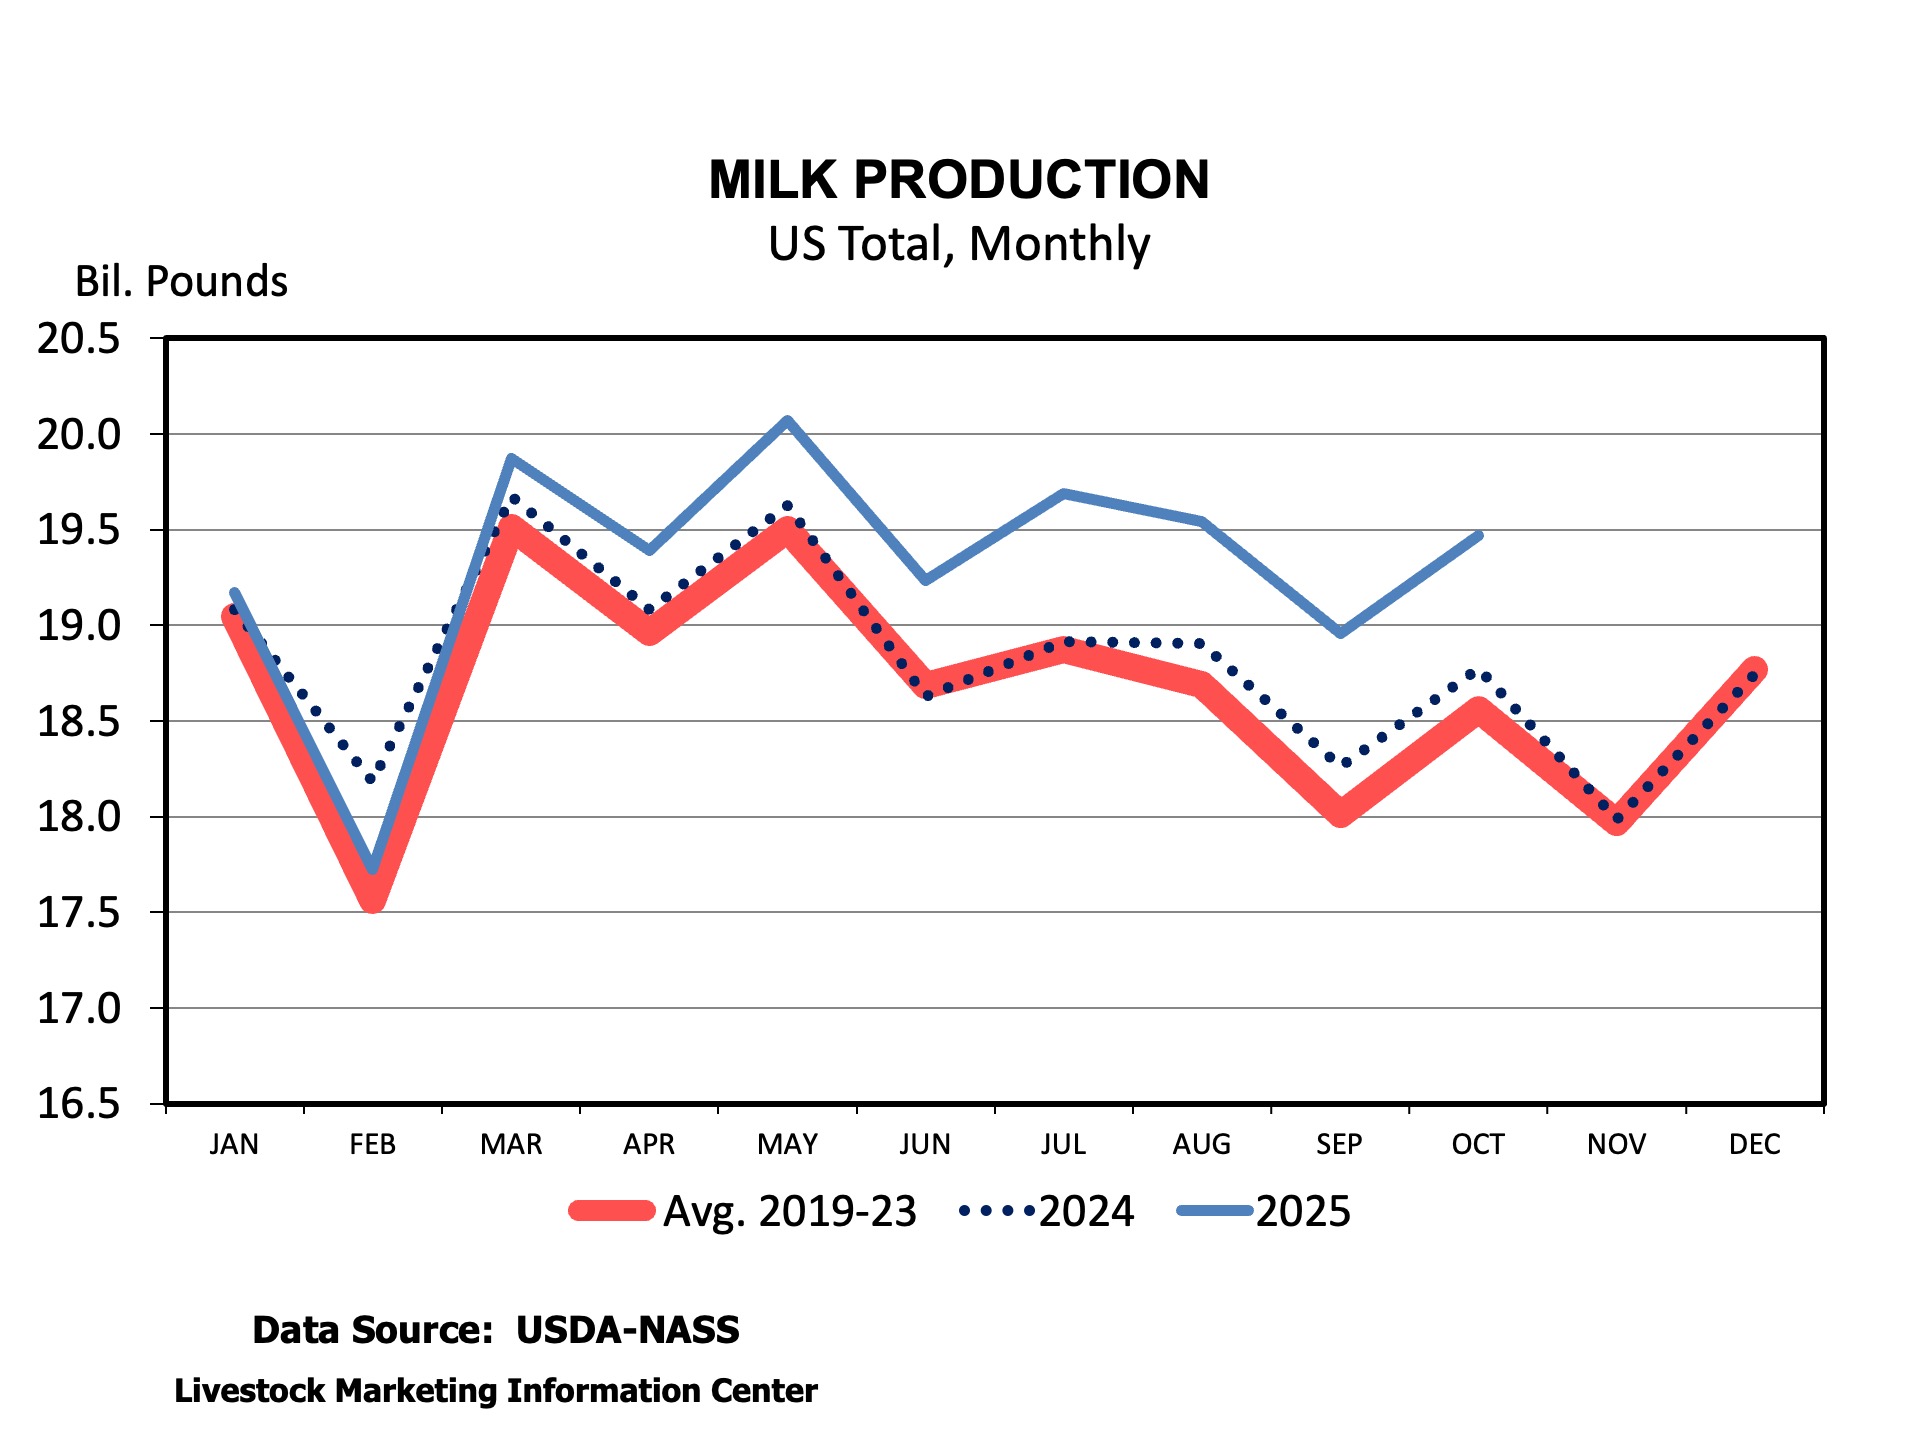
Pork production during June-August 2025 was 3.2 percent lower this year than last year. However, since August, pork production has been 1 percent more than last year. Production during the second week of December hit 593.6 million pounds, which was the largest weekly production in more than two years.
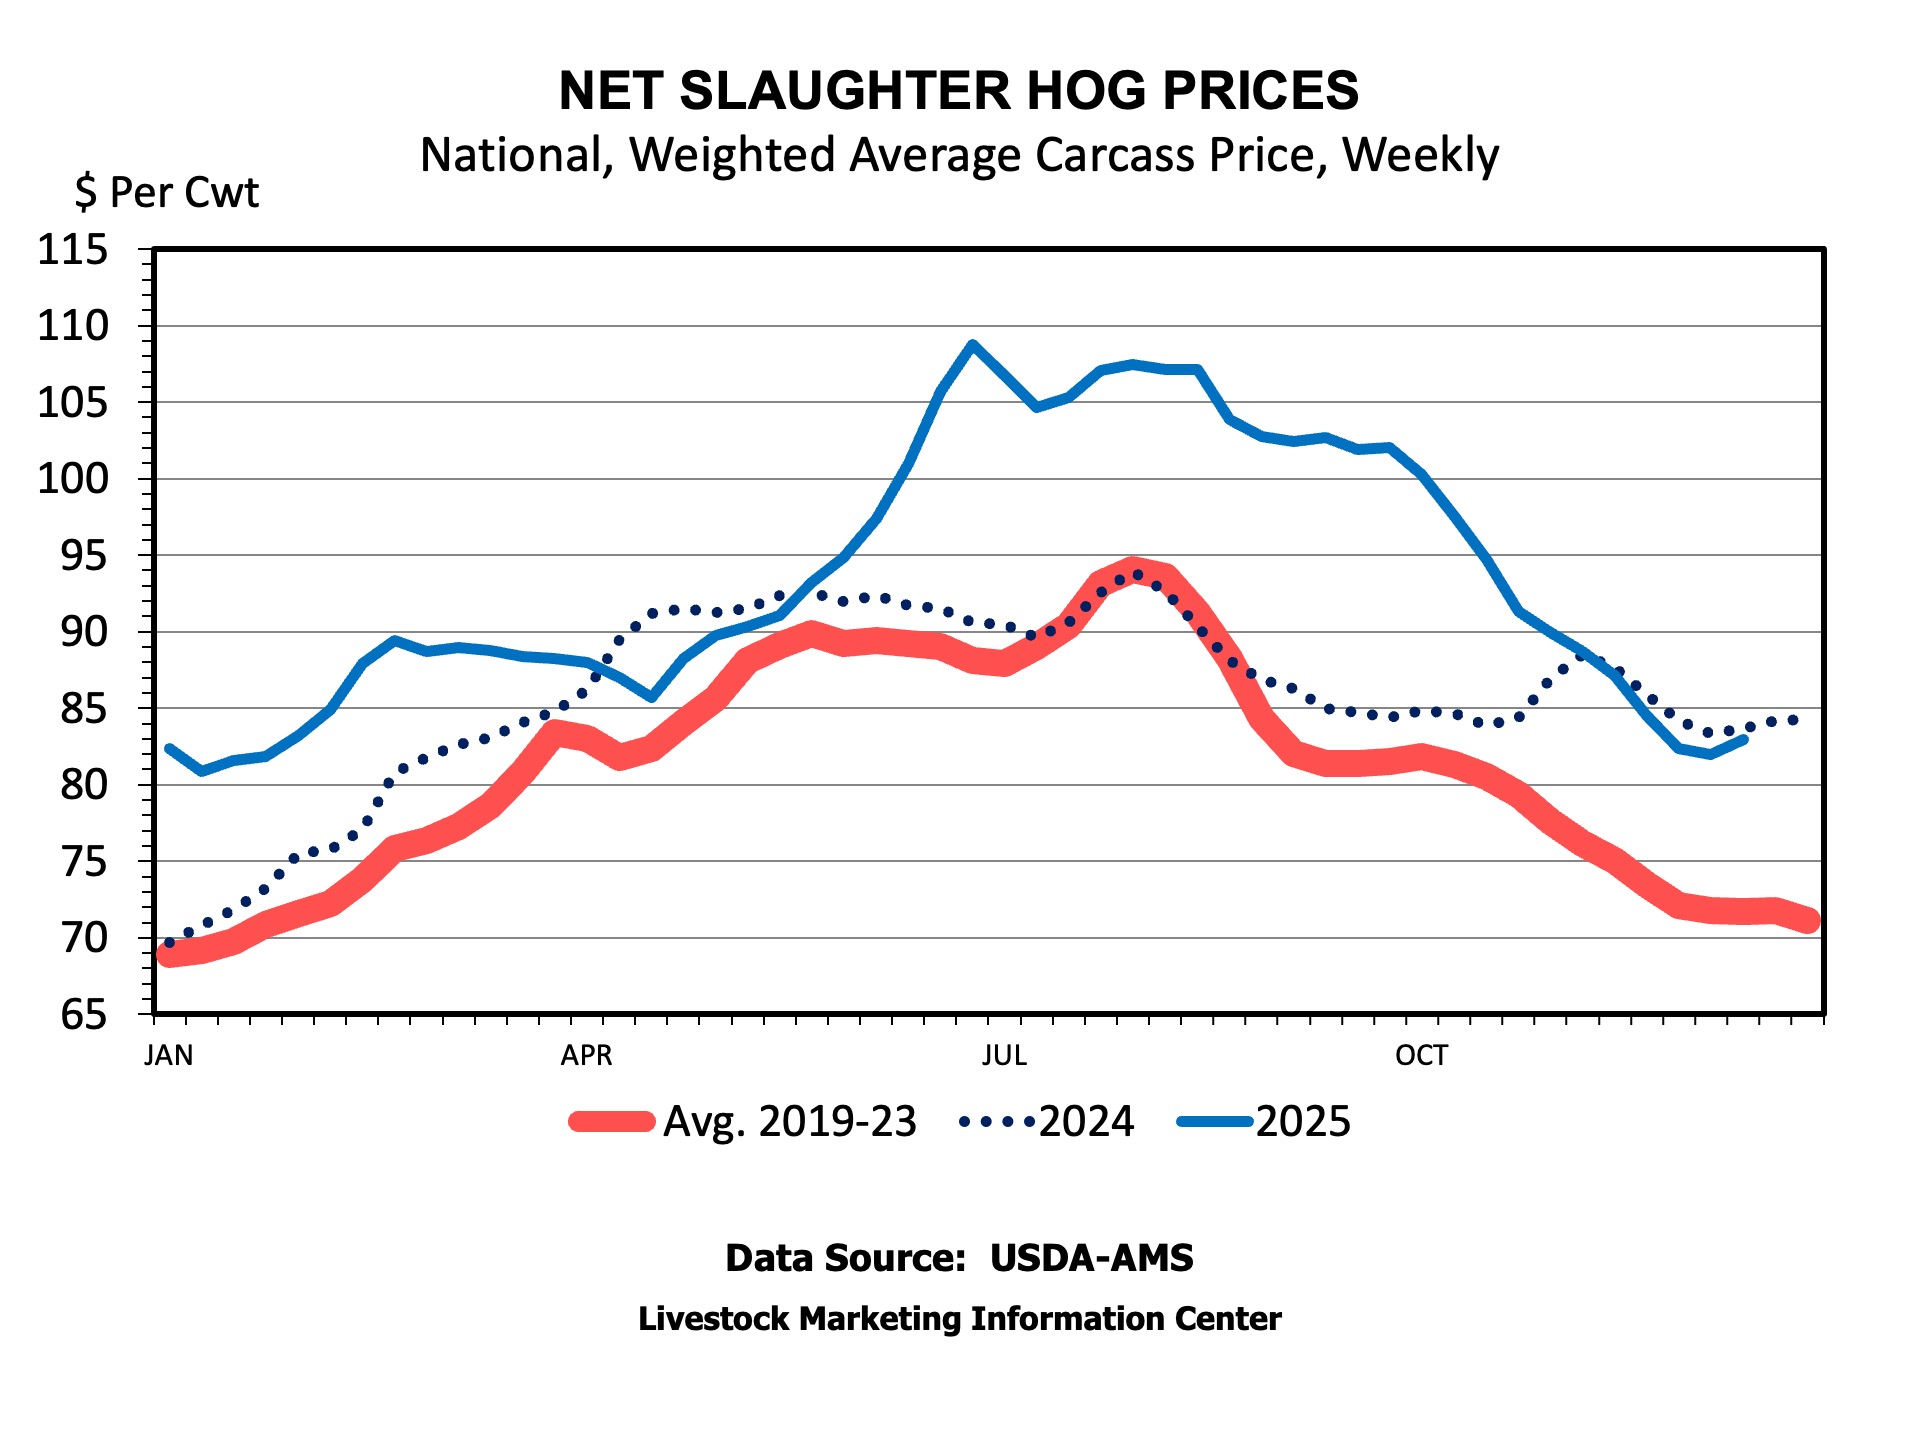
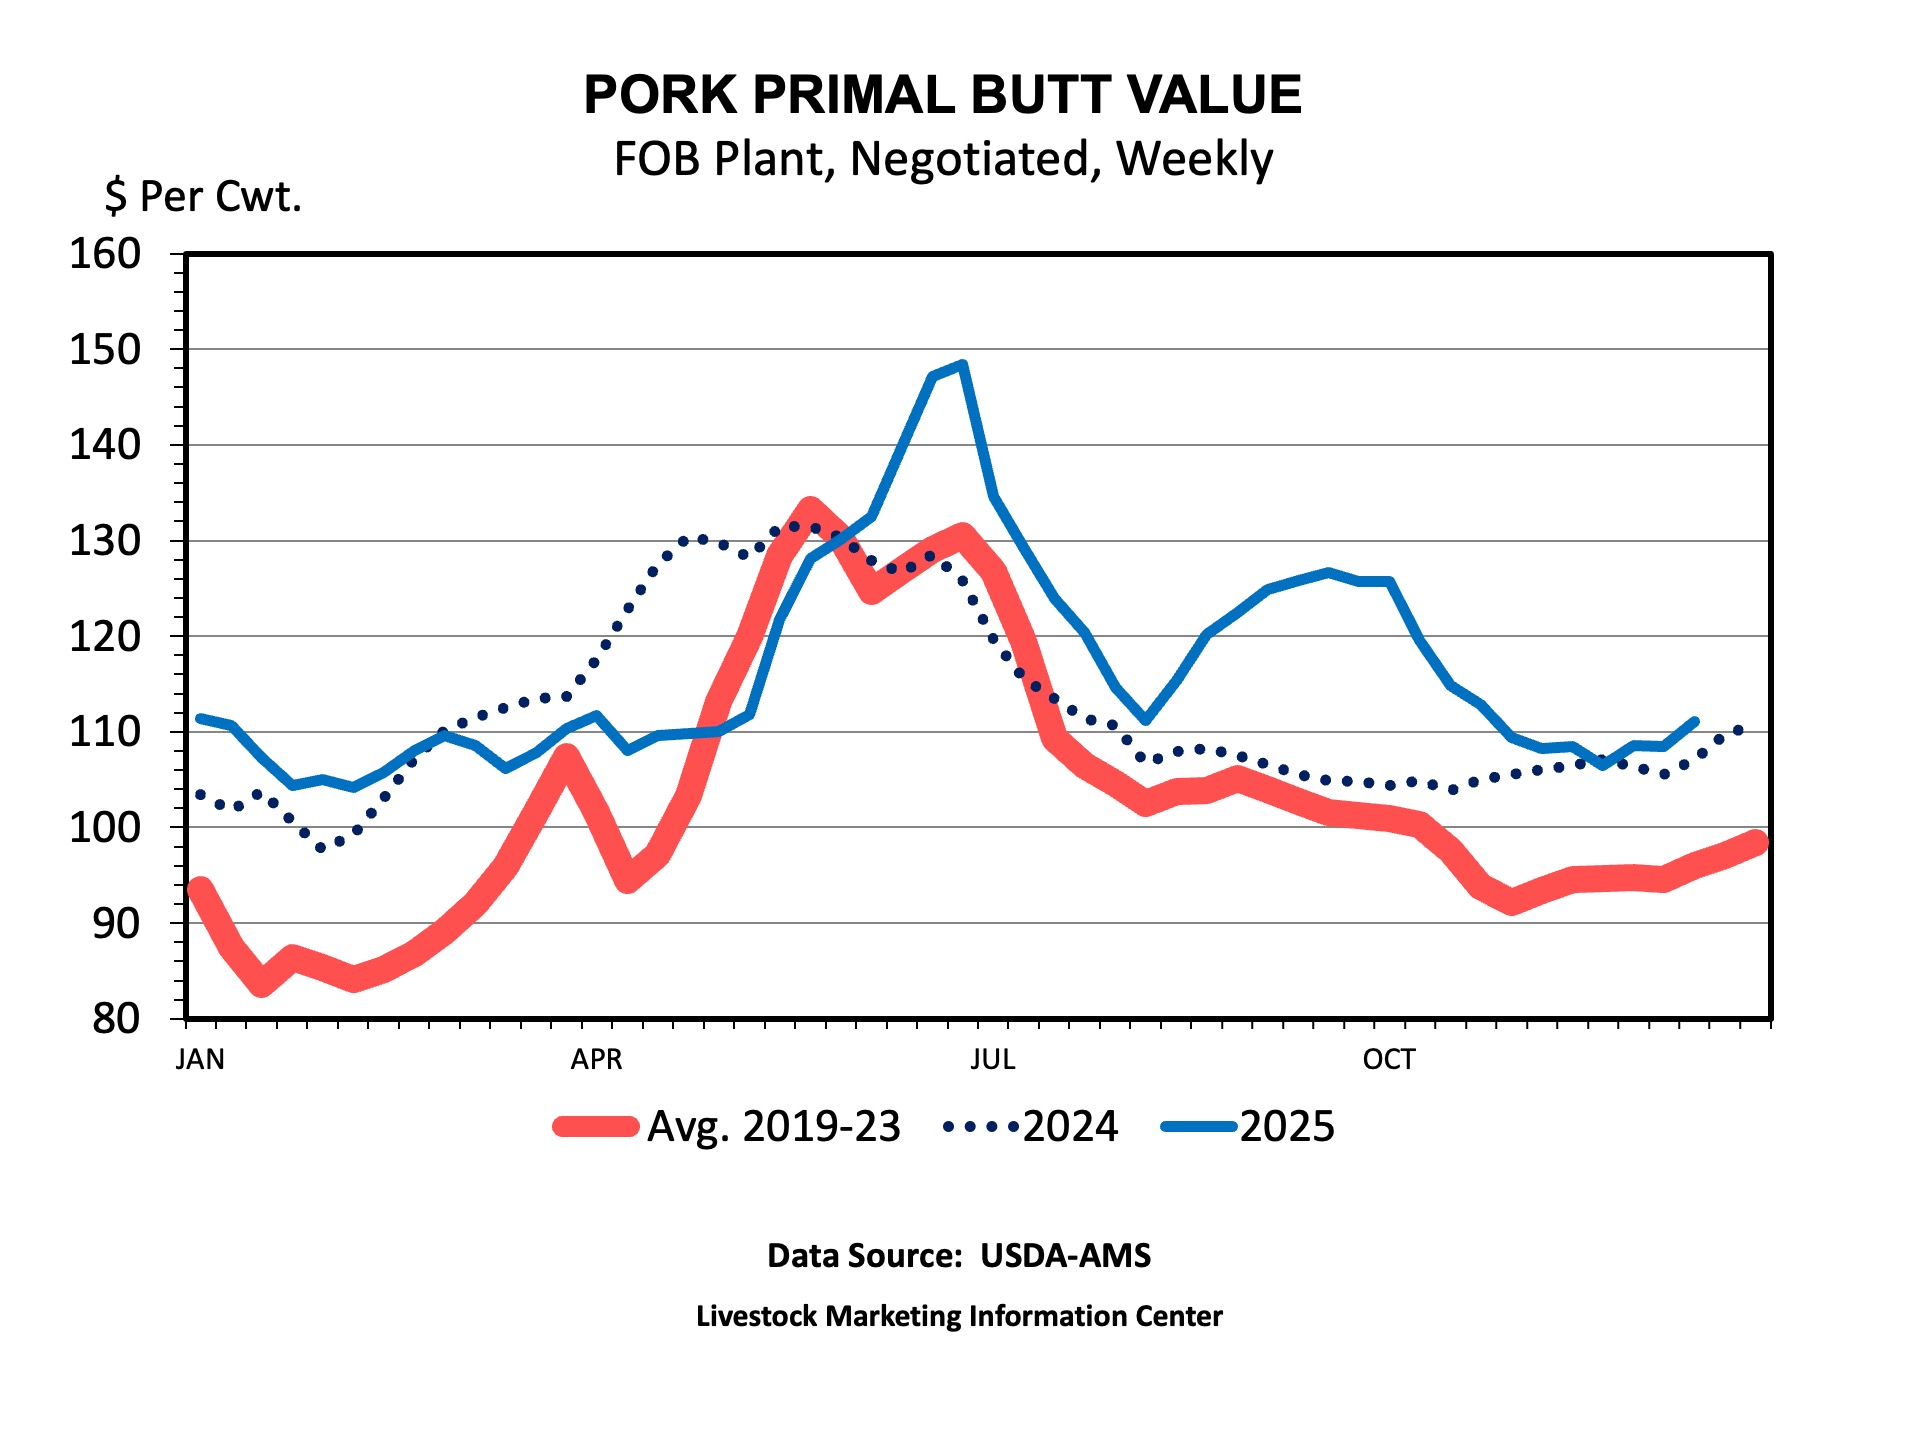
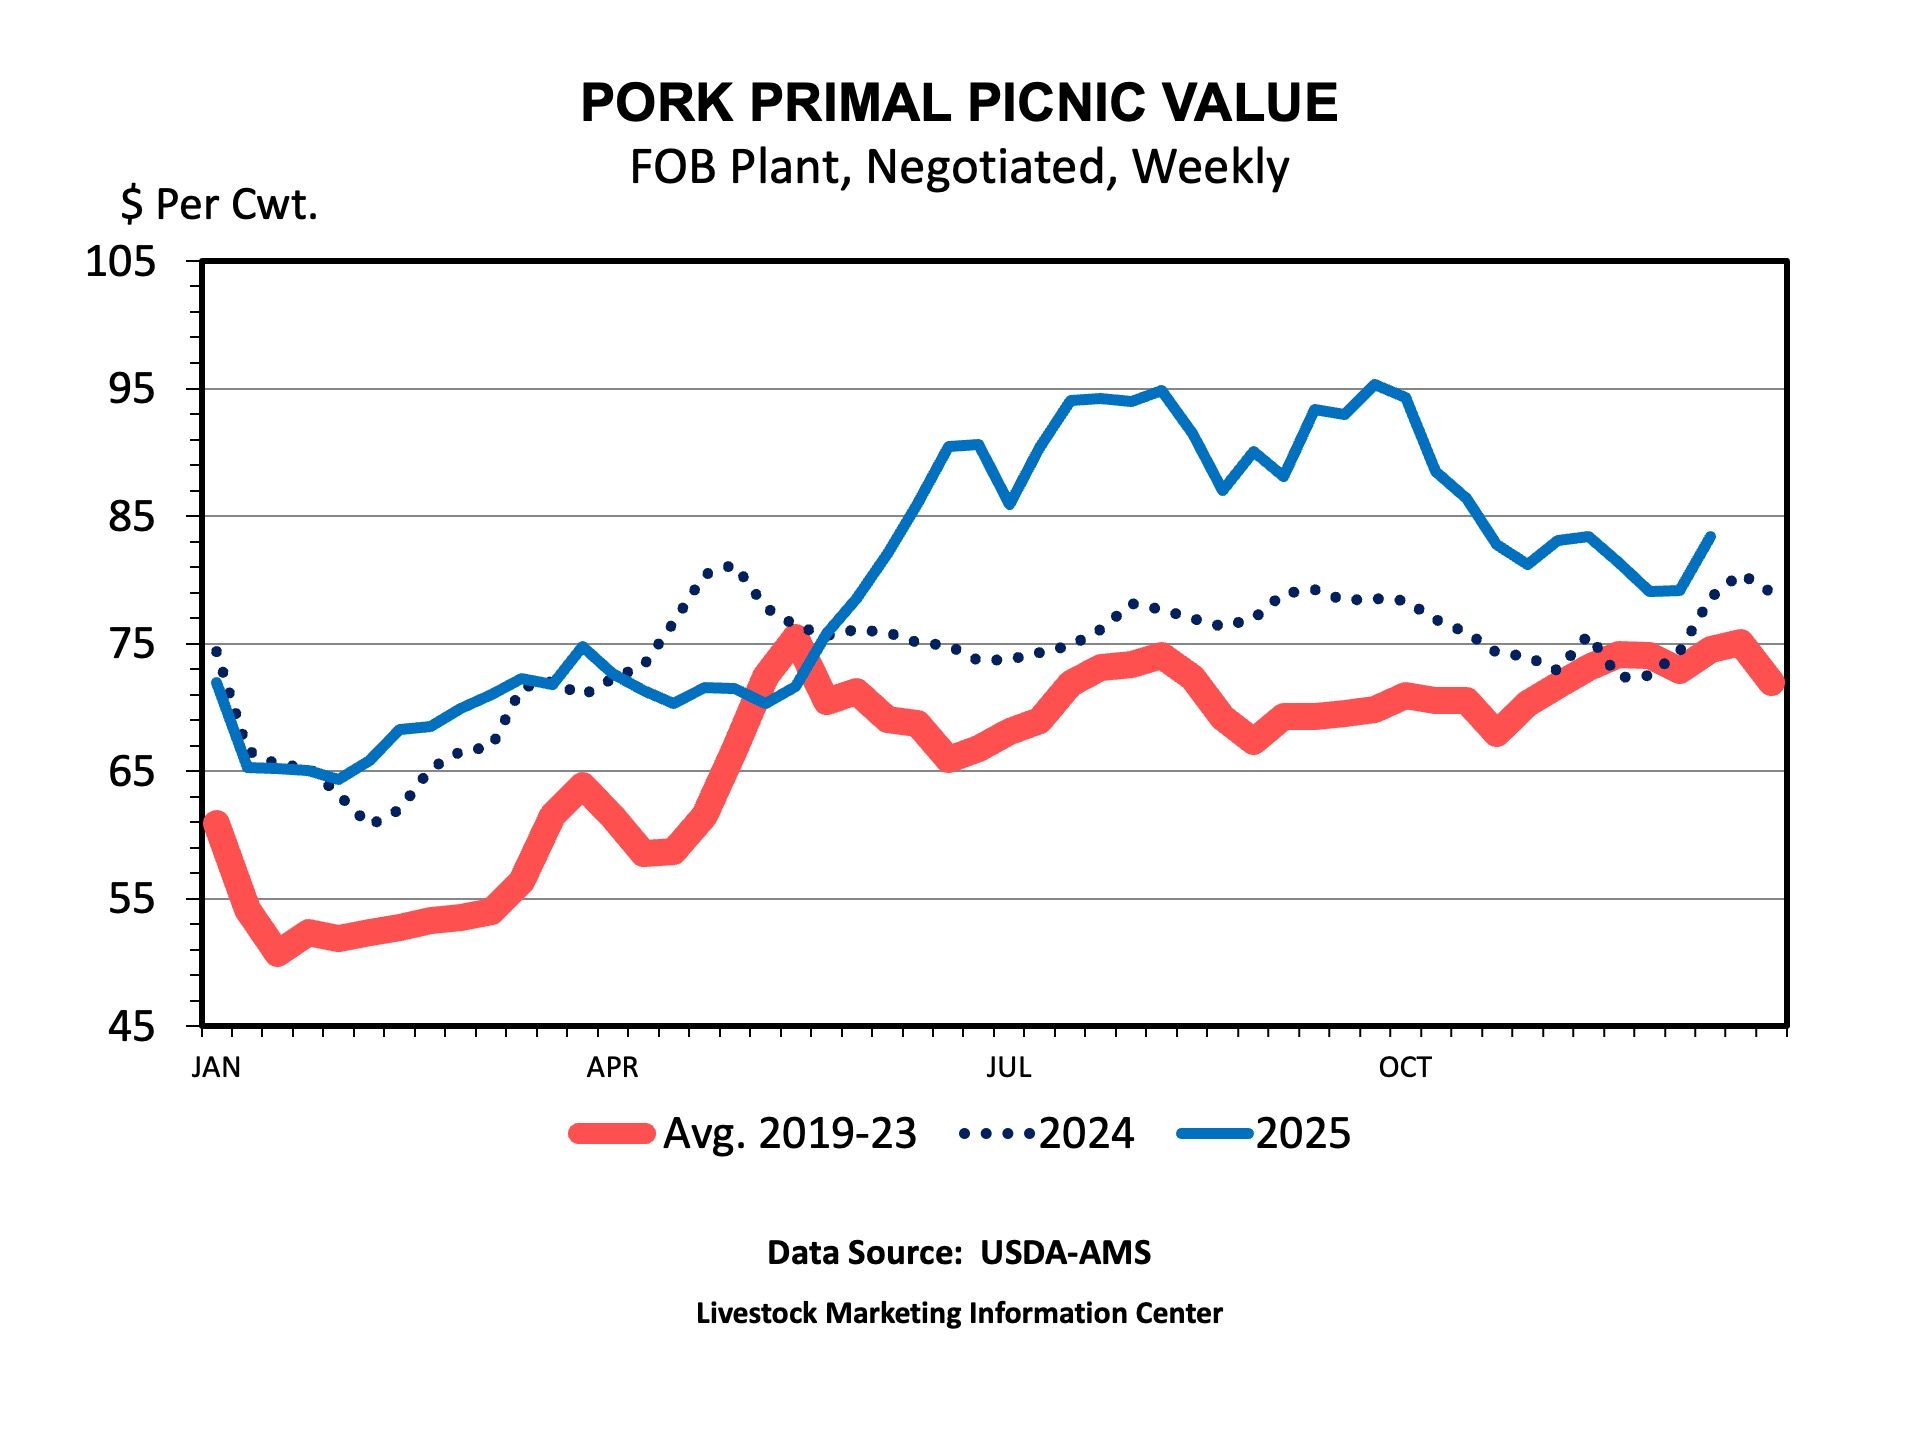
Hog and wholesale pork prices have declined sharply as production has increased. National, weighted average, hog carcass prices net of any carcass premiums and discounts were $82.96 per cwt in mid-December, down from a peak of $108.79 earlier in the summer. The shoulder cuts, butts, and picnics are often used in pork tamales. Pork butt and picnic primal values were $111.03 and $83.39 per cwt, respectively, in mid-December. Both were a little above the values for the same week in 2024 and well below their summer peak.
Hogs and Pigs report
USDA will release the December Hogs and Pigs report in the afternoon of December 23rd (today, if you’re reading this early Tuesday morning). Market analysts expect the breeding herd to be about 1 percent smaller than December 2024. The number of market hogs should be about the same as a year ago. The report will have an estimate of expected sow farrowings during the first 6 months of 2026. Analysts expect farrowings to be slightly larger than during the first half of 2025. The report will be an interesting one because producers have struggled over the last several years. Falling feed costs and this past Summer’s high prices returned some profits to producers. High fertilizer prices have made the manure much more valuable, helping the overall farm operation. But, falling prices late this year brought profits down to about break even again.
Tamale Day
My friends and I have our tamale-making day scheduled for December 21st, so by the time you read this, we’ll be relaxing for Christmas. All of us livestock economists at Southern Ag Today wish you the Merriest of Christmases!
Anderson, David. “Tamale Time!“ Southern Ag Today 5(52.2). December 23, 2025. Permalink