All the talk of relaxing tariffs on imported beef, knowing that the majority of our beef imports are lean beef trimmings to go into ground beef competing with cull cow beef, suggested it might be time to take a quick look at the cull cow market.
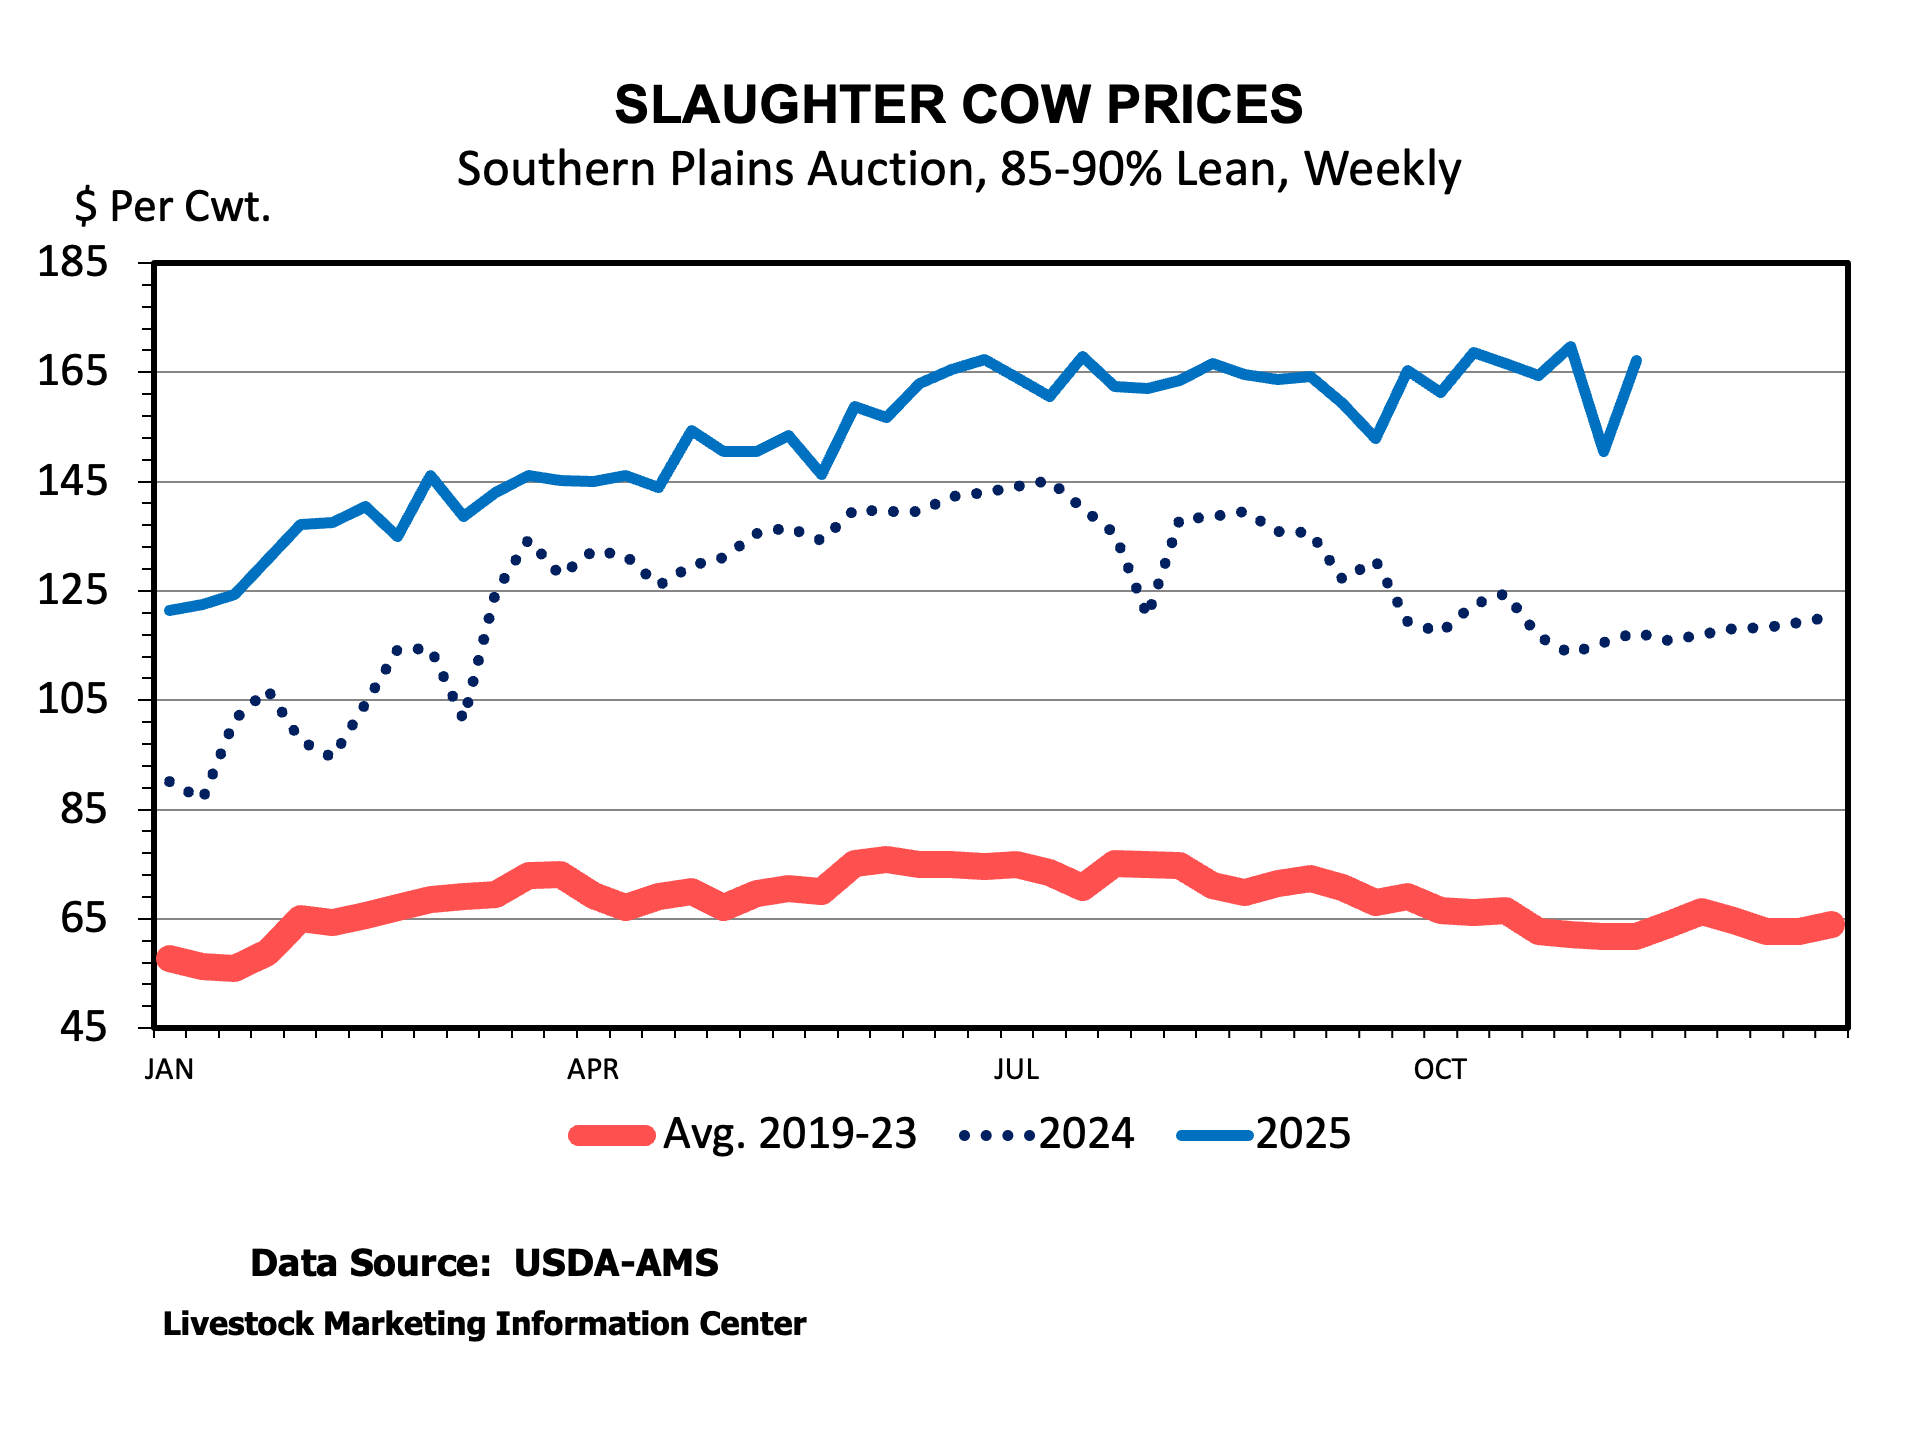
Most will remember that cull cow prices tend to hit their seasonal lows in the Fall. The most important reason for the price decline is that more cows are culled from the herd in the Fall. For beef cattle, the largest proportion of cows are culled in the Fall following calf weaning. On the dairy side, cow culling increases from summertime lows. The increase in supplies of cows for sale results in lower prices. Another contributor to lower prices is the end of grilling season, with consumers shifting over to more Fall and Winter consumption patterns.
So far this Fall, the cull cow market has defied normal seasonality. Southern Plains cull cow auction prices hit about $165 per cwt back in June and have remained there since then. A couple weeks of declines were followed by rebounds back to about $165 per cwt. National average cutter quality cows have declined recently, slipping about $9 per cwt to $126.
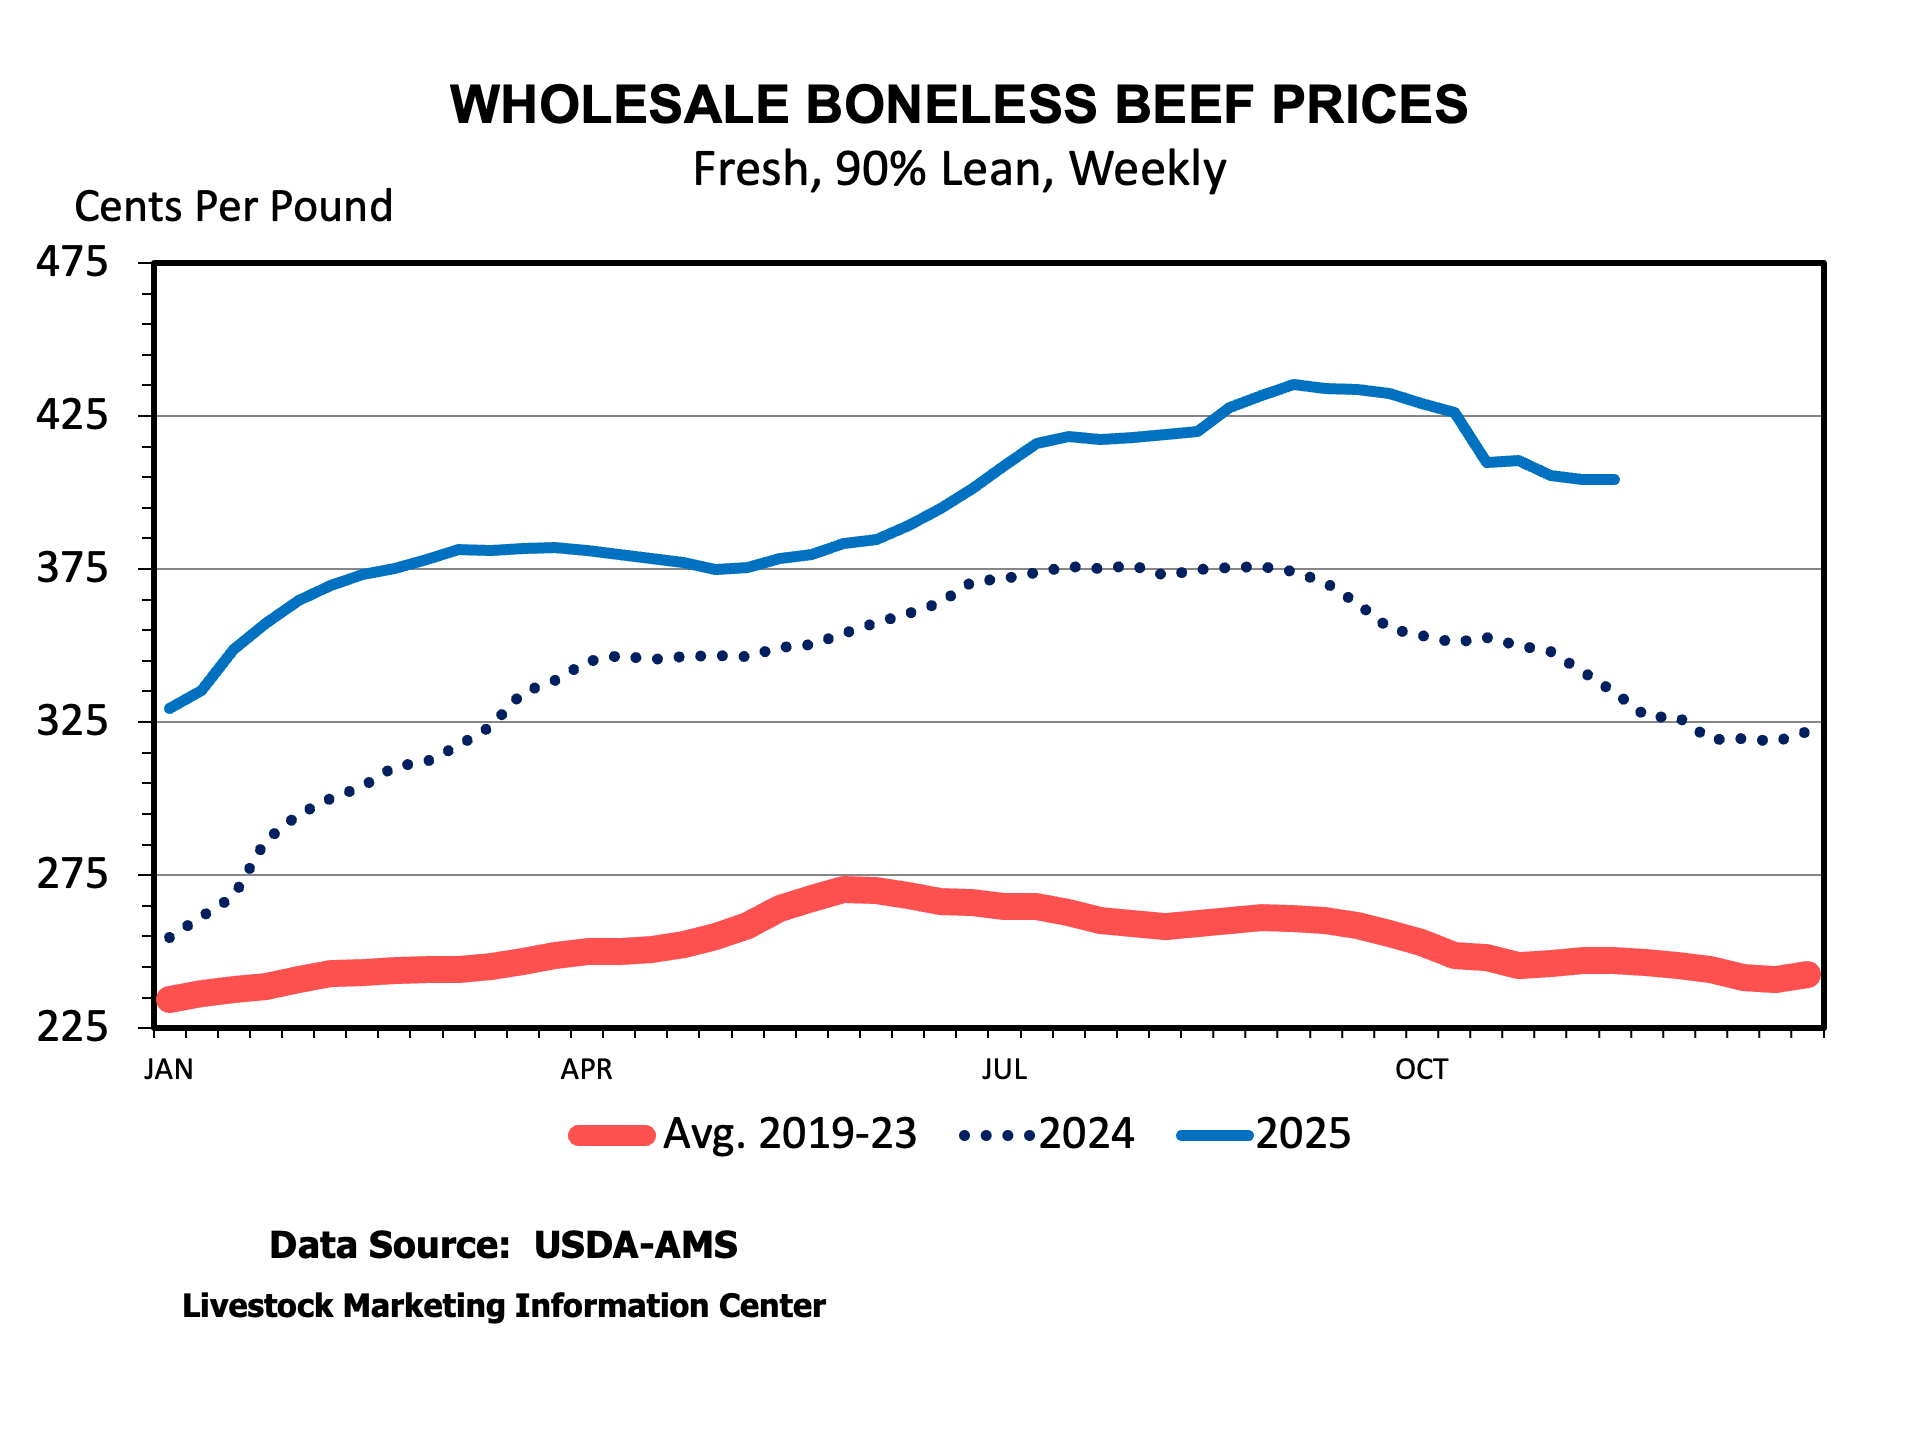
While the live cow market has not declined much, the same cannot be said for the cow beef market. The boxed cow beef cutout climbed to $340 per cwt but has declined to $317 over the last two months. Wholesale 90 percent lean beef has declined from $436 to $404 per cwt over the same period. Both the boxed beef cutout and wholesale 90 percent lean have followed the normal season pattern, declining into the Fall.
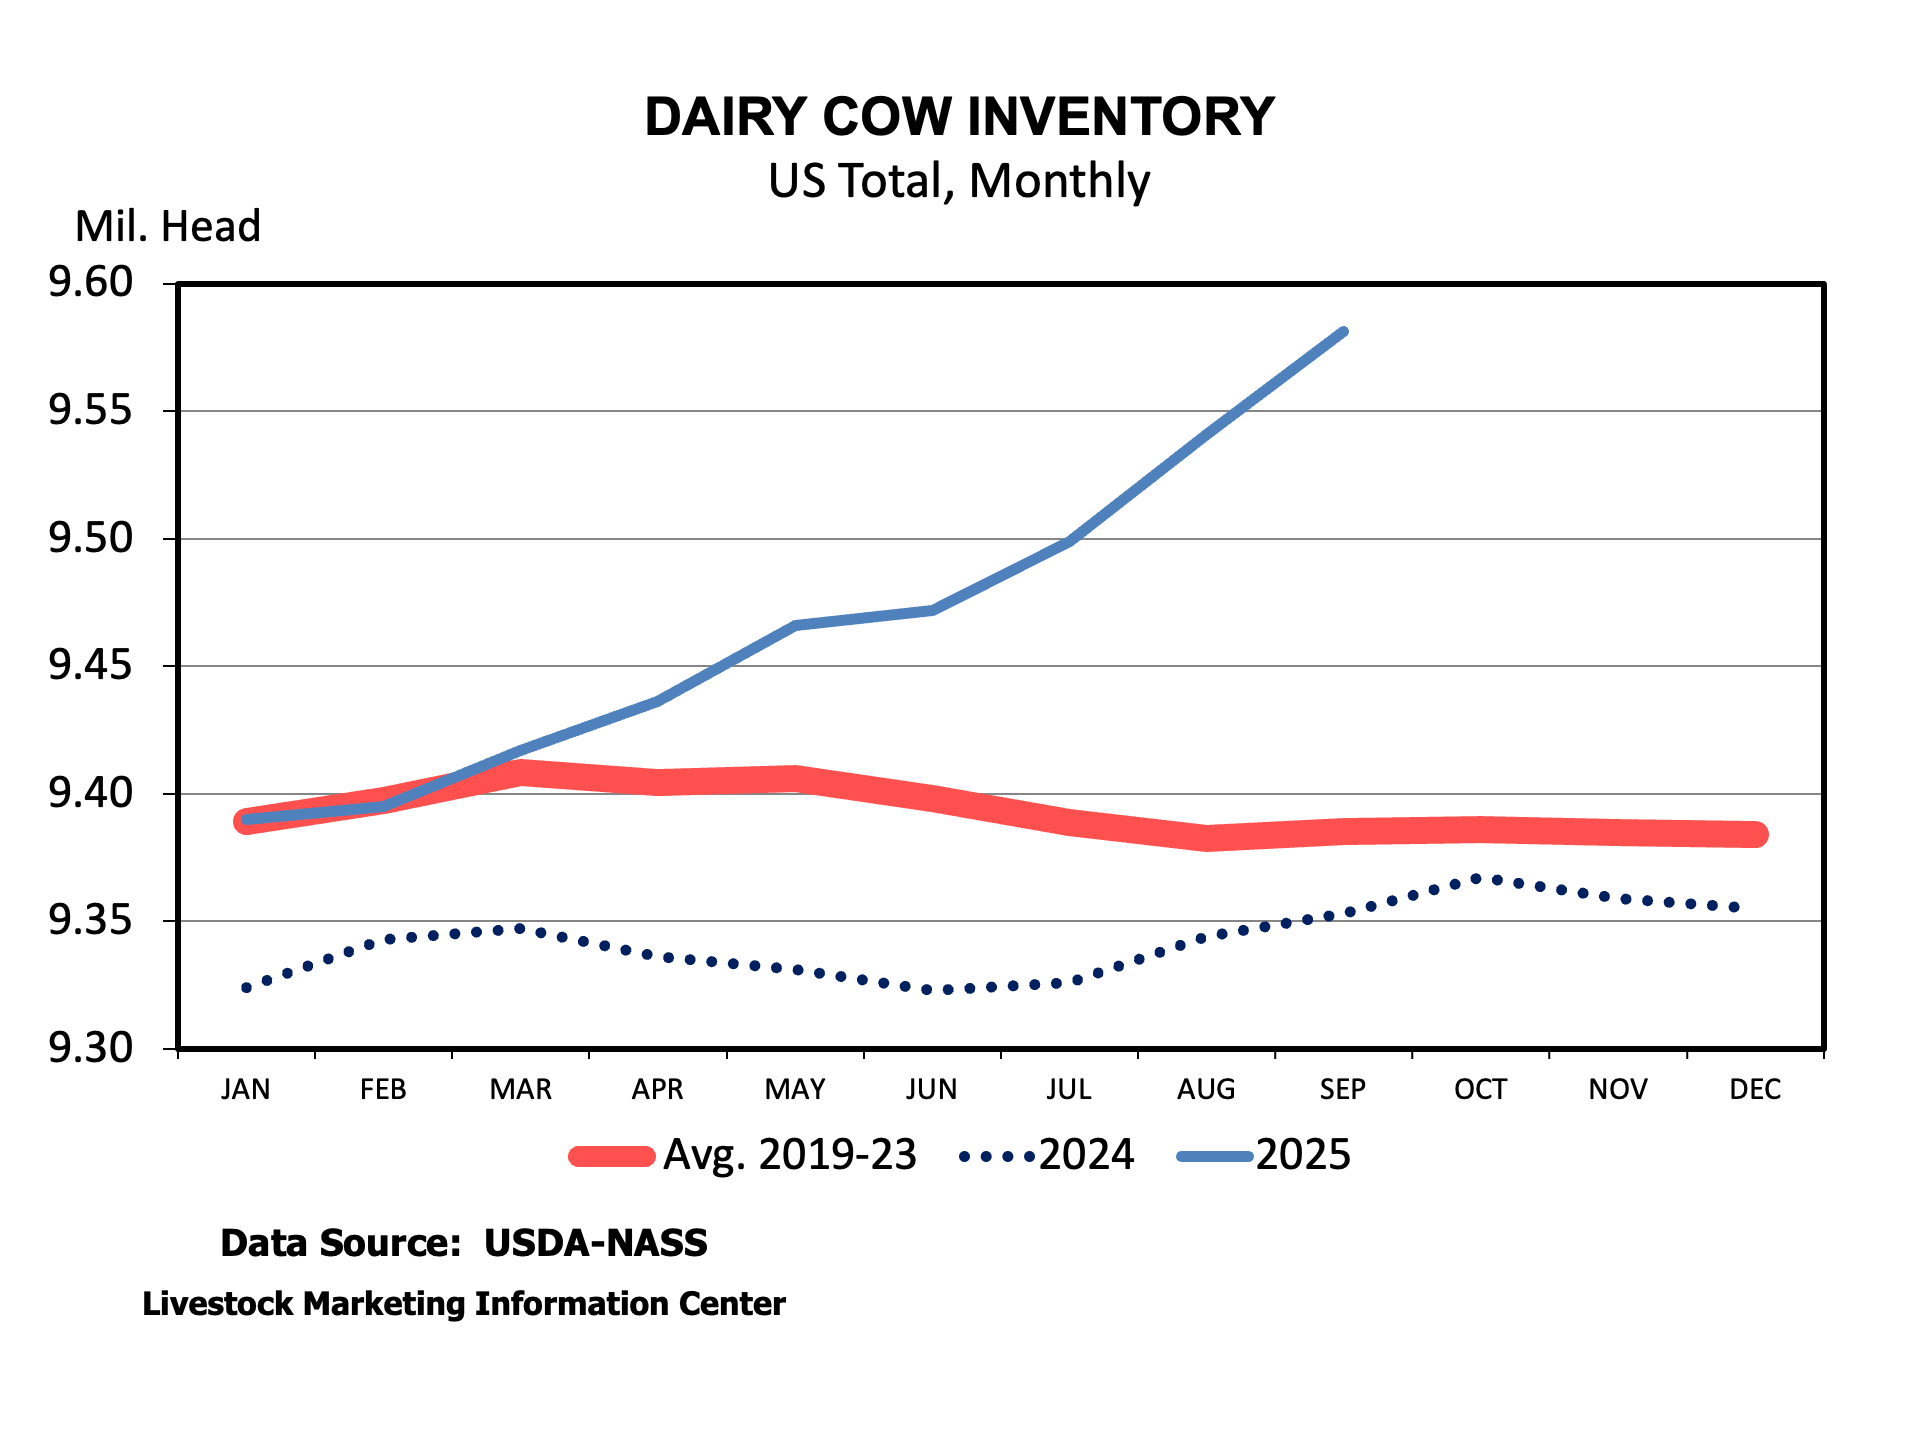
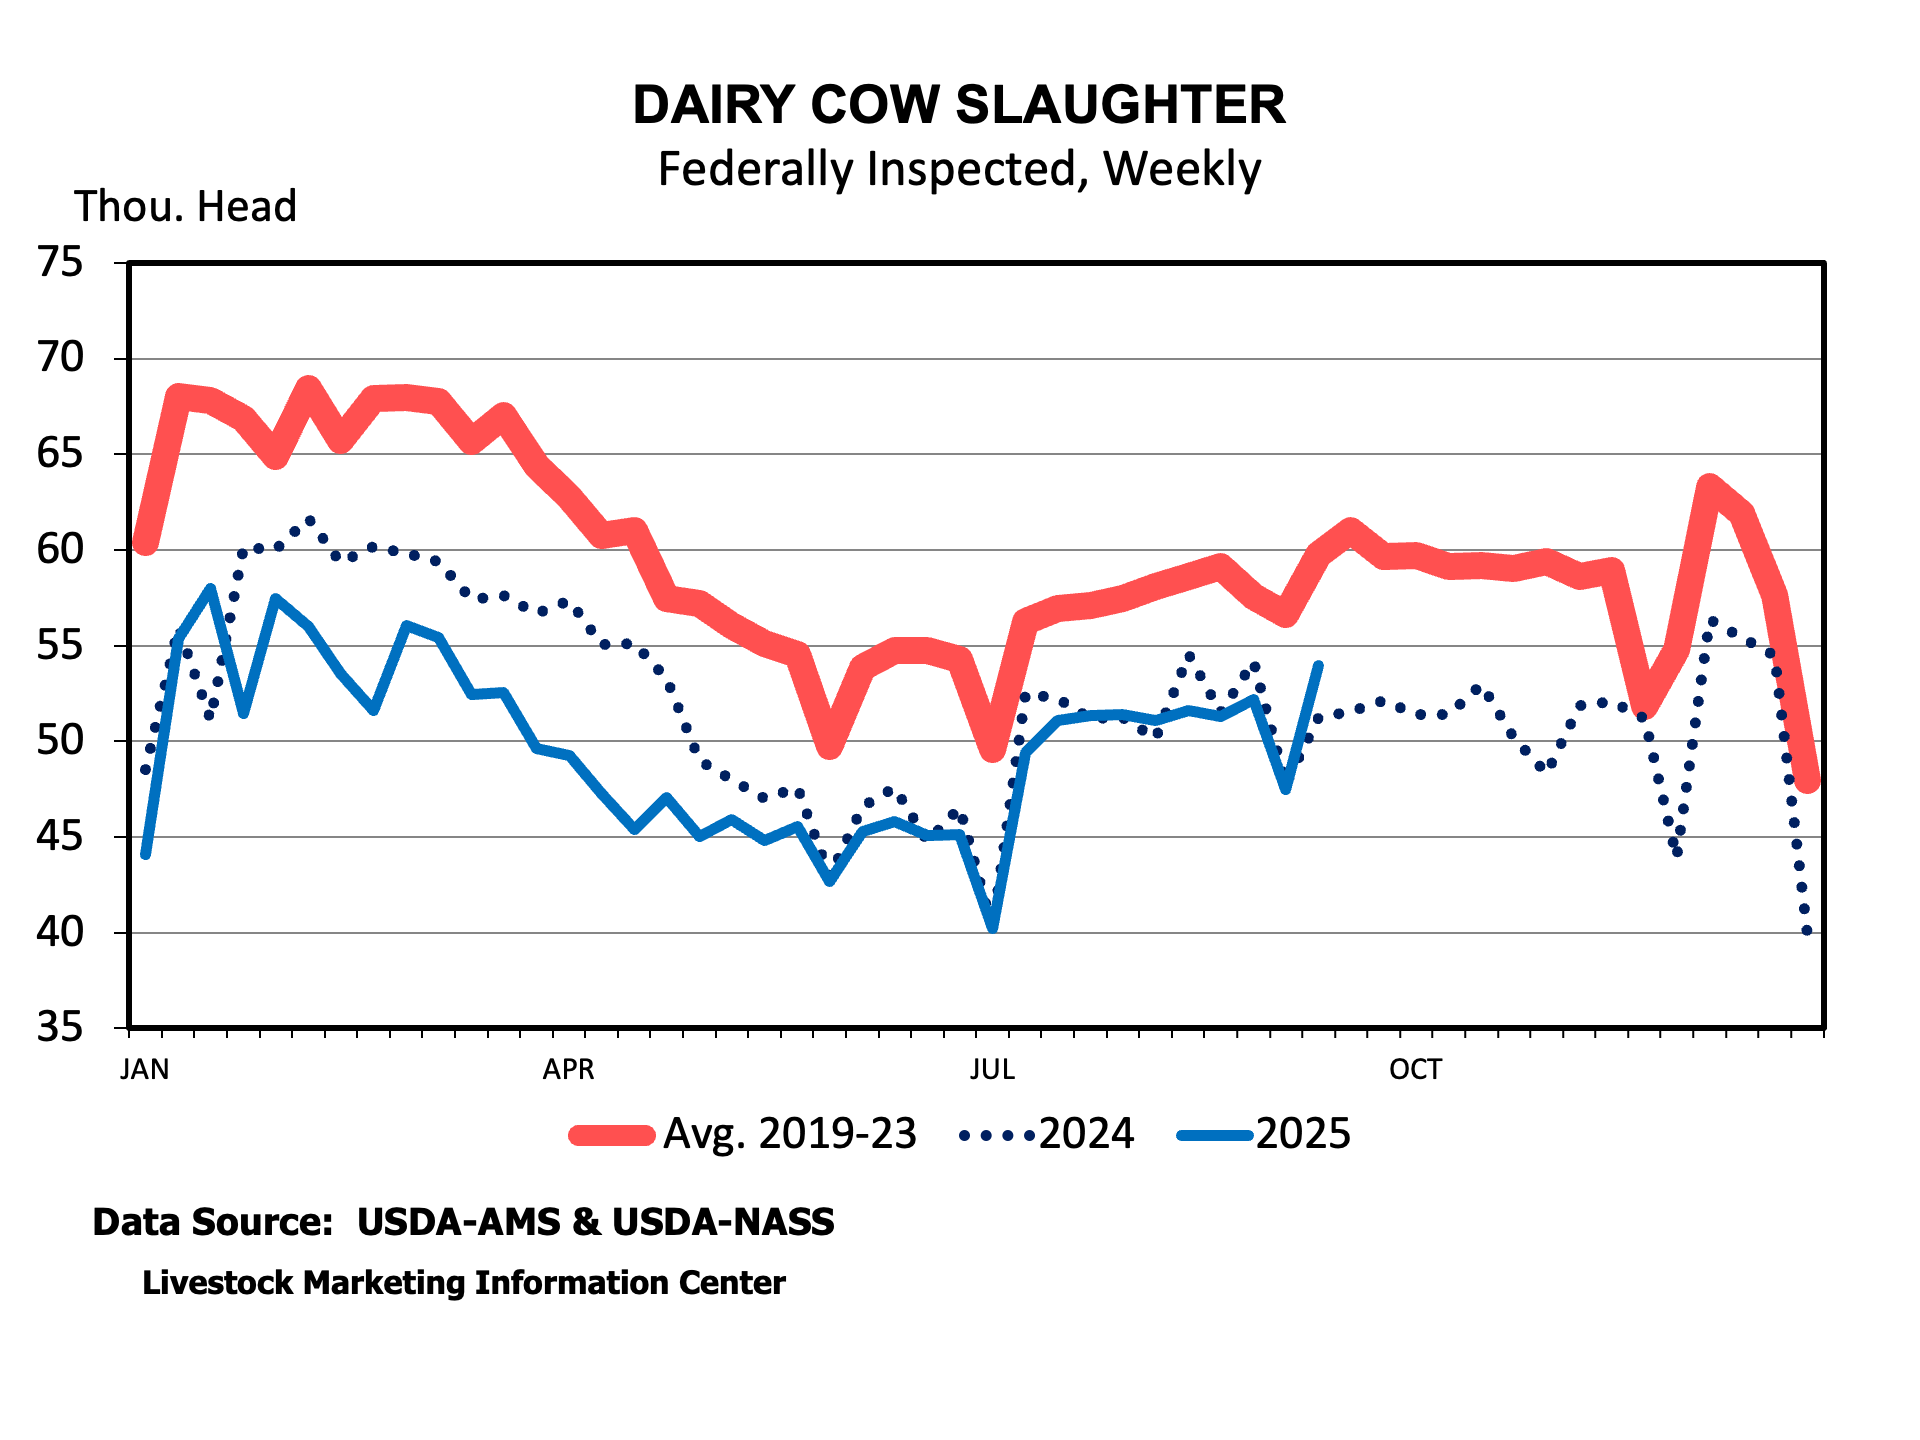
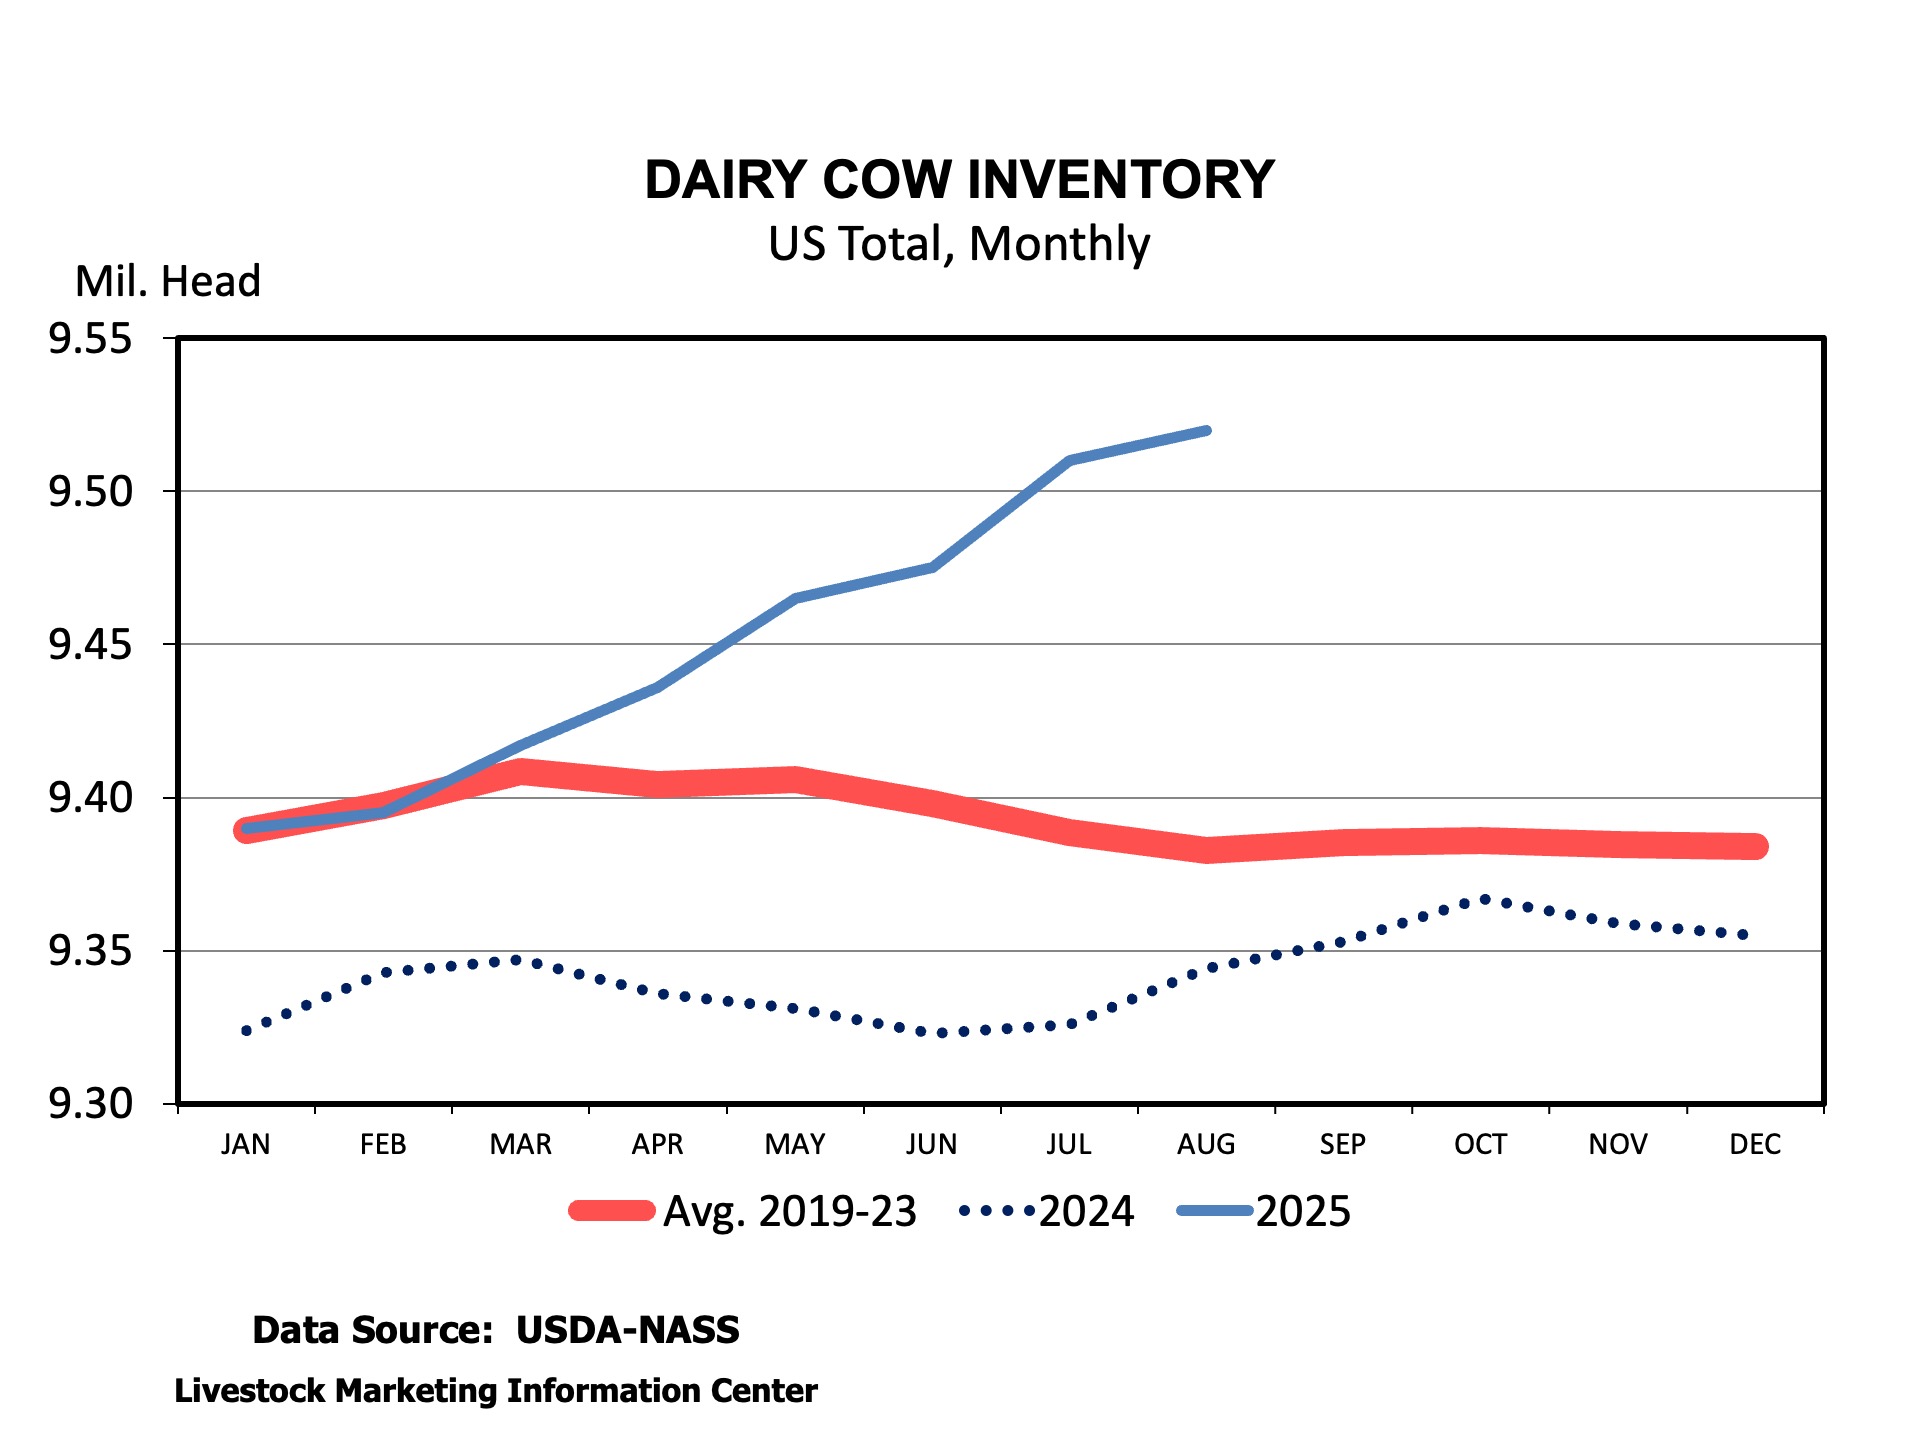
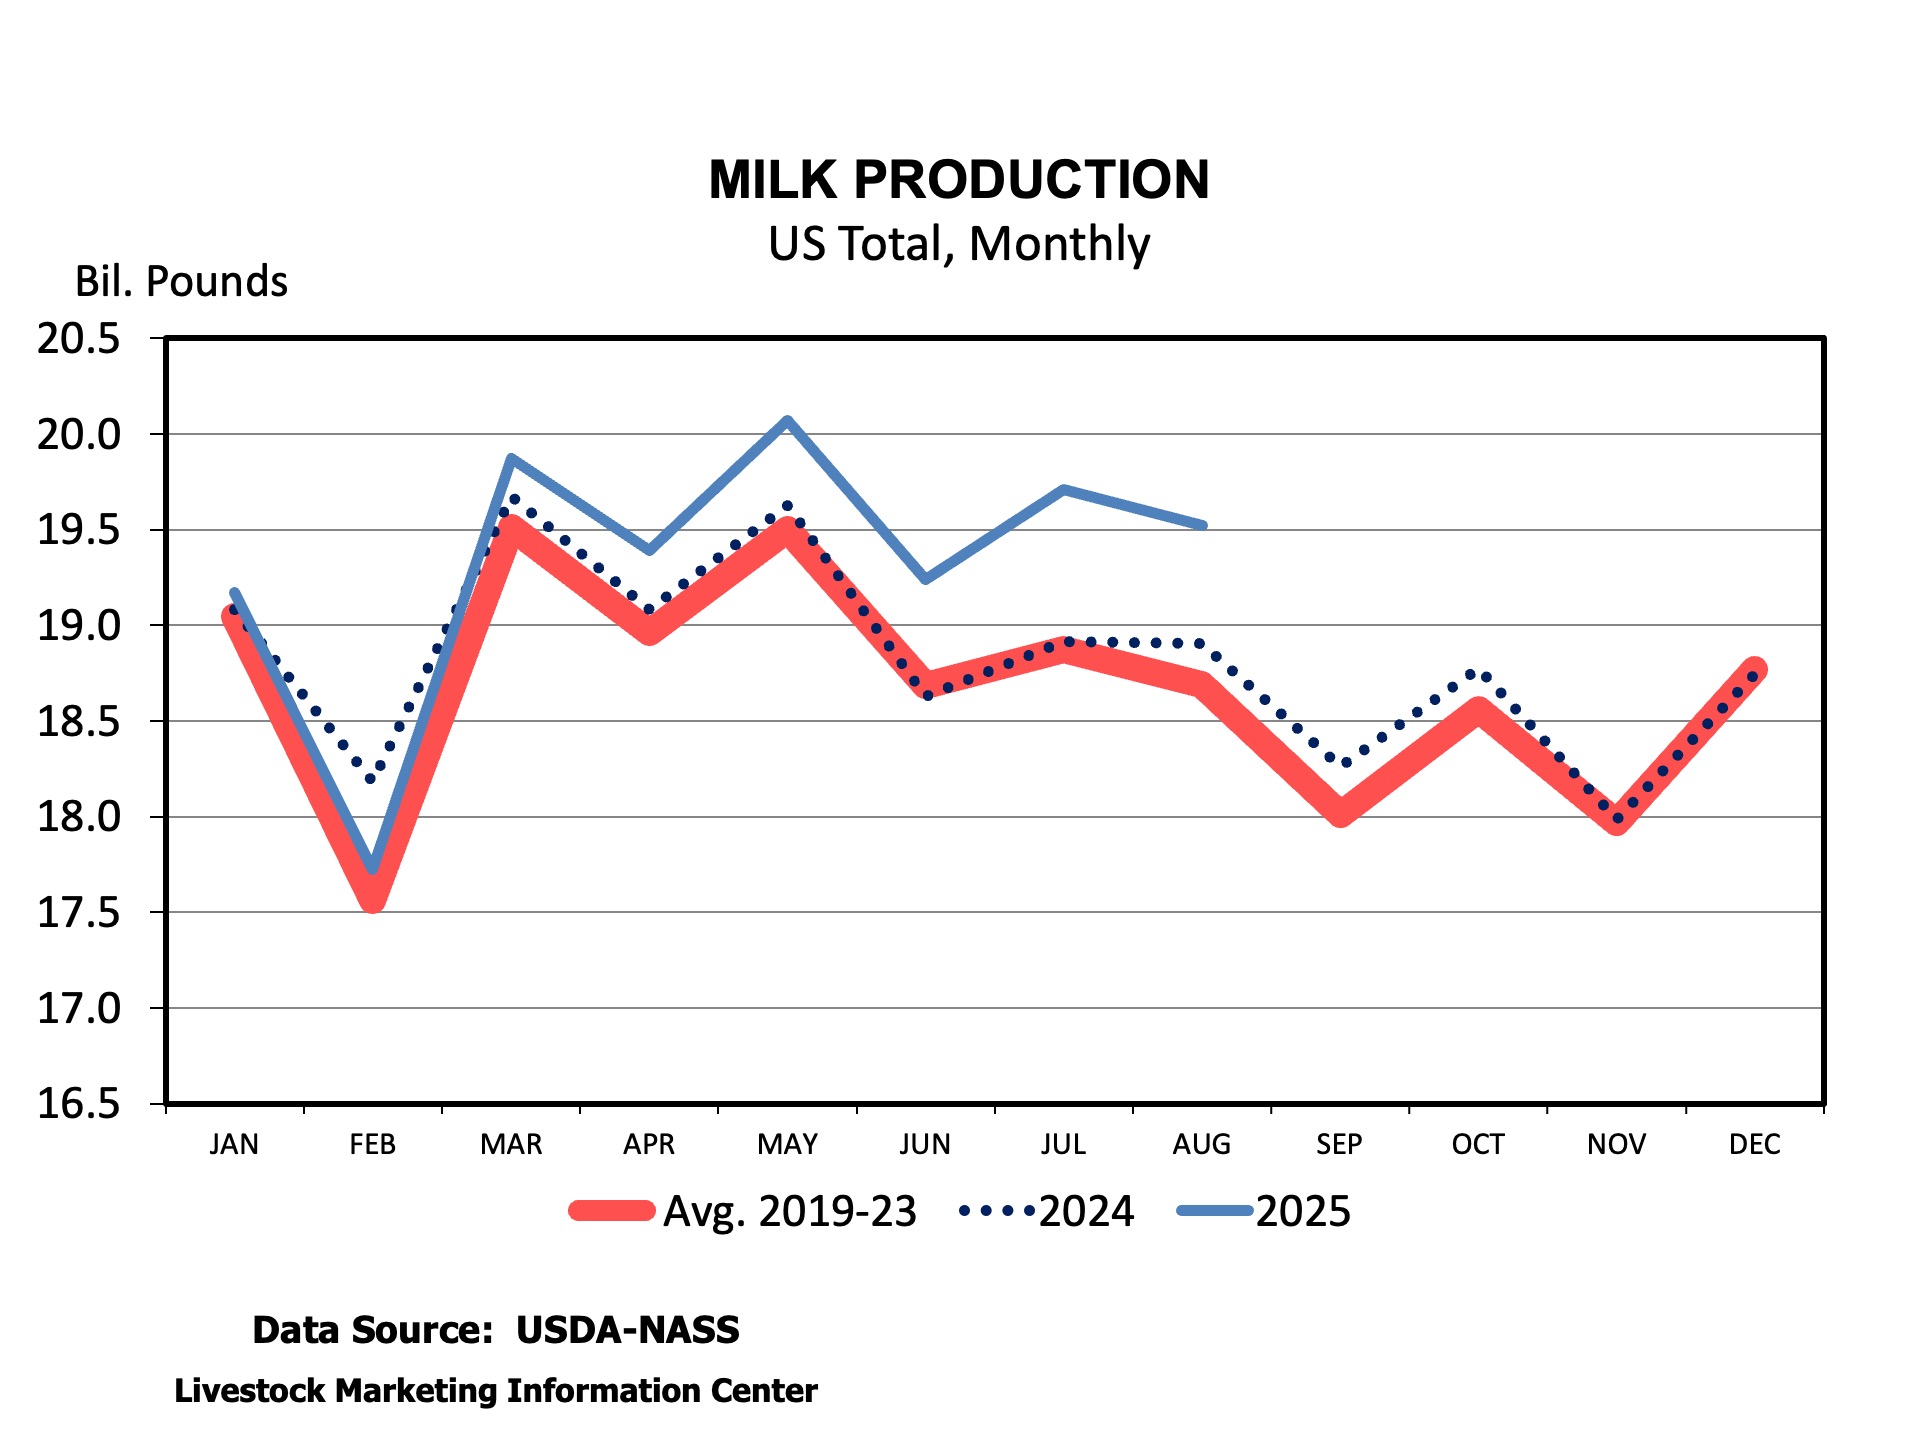
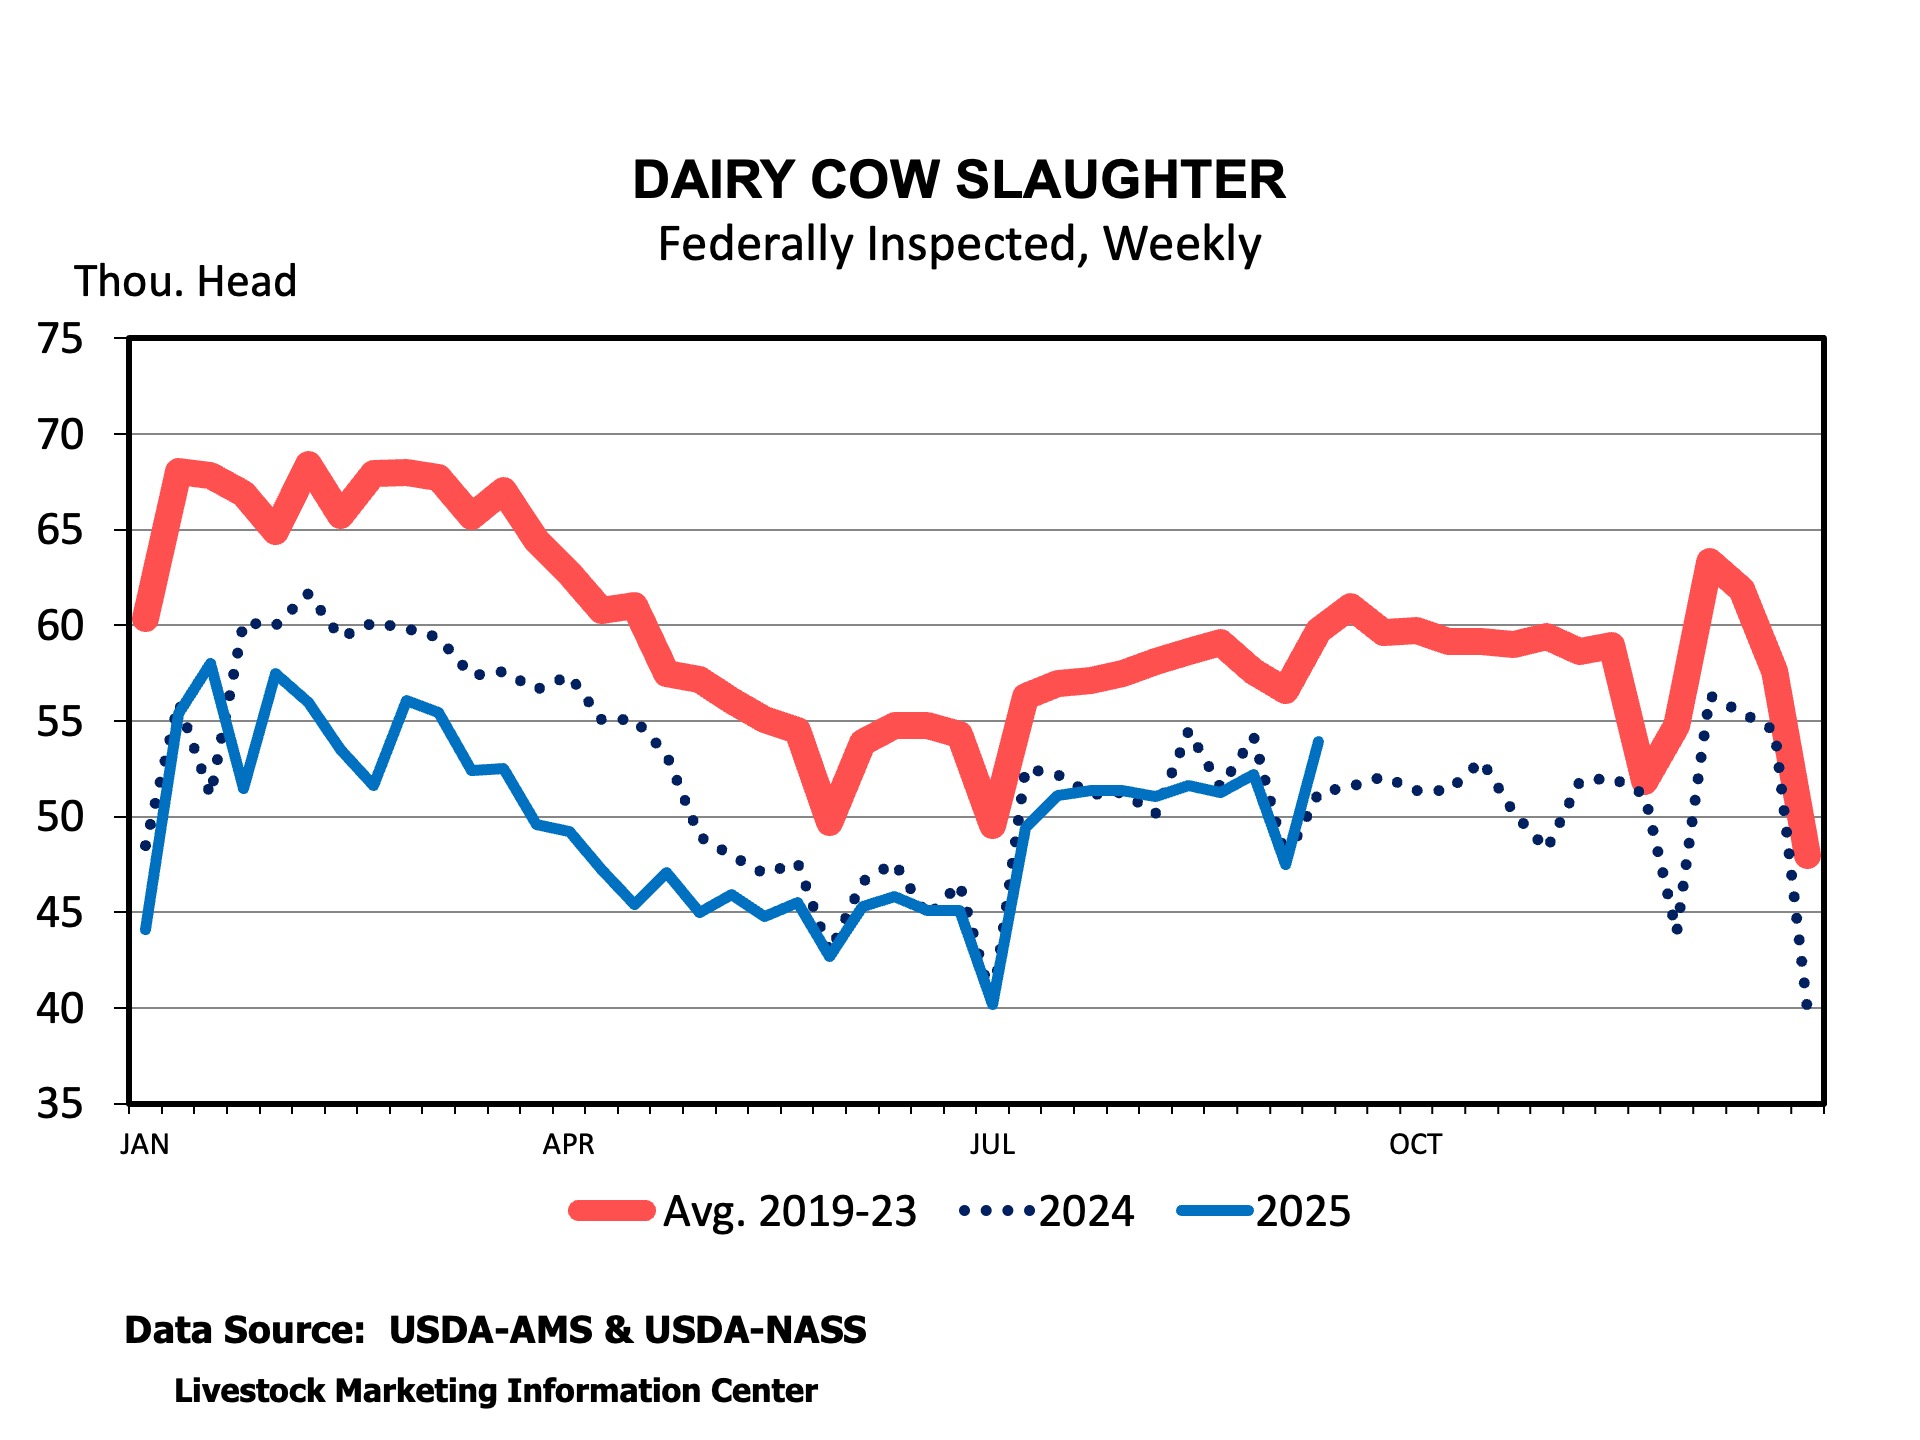
We are likely to see some increased culling from the dairy side of the beef industry in the coming months. USDA’s latest milk production report indicated the nation’s dairy cow herd at 9.85 million head. That is the largest herd since at least 1993. Milk production in September was 4 percent larger than the year before. Milk prices are beginning to decline sharply with increased production. There is no doubt that the increased returns from using beef bull instead of dairy breed semen to produce cross bred calves is boosting profits and aiding in the dairy herd expansion. Beef cow culling is likely to remain low due to the historically small cow herd and incentives to expand. More dairy cow culling and less beef cow culling will continue to leave cull cow prices high.