A few weeks ago, the current state of beef and pork prices was addressed in Southern Ag Today. Poultry, namely chicken and turkey, make up the bulk of the remainder of the American animal protein diet. Chicken is at the top of the list, with over 100 pounds per capita annually consumed. Turkey, on the other hand, is last on the consumption list.
However, Thanksgiving is Turkey’s time to shine. This seasonal demand certainly affects price, but it is also part of the turkey production schedule. Late May or early June placements of young toms are targeted to be ready to hit the fresh market for Thanksgiving. August placements would target smaller young hens. So far in 2025, poult placement is down every month leading up to August compared to last year. Also, turkey egg set was lower in most months in 2025 compared to 2024. However, July eggs set in hatcheries for August poult placement are up 1 percent over last year. Depending on the hatch, these eggs could bolster more fresh birds ready for the table in November. But overall, there have been fewer poults placed in 2025, likely meaning fewer fresh young toms and hens, which could lead to higher prices this holiday. The frozen market, while seasonally trending up, has less pounds of turkeys in cold storage compared to years past (Fig. 1), which also suggests a lower supply this holiday season.
With lower supply usually comes higher prices. In Fig. 2, we see that, for both large and small lot purchases, fresh turkey prices are higher in 2025 than in 2024. Although large quantity buyers were steady at $1.40/lb going into fall, those prices may increase over the next month as availability dwindles, and holiday inventory build begins. In fact, early September trading is trending in the $1.55/lb area. Many of these birds may be going into cold storage for Thanksgiving sales.
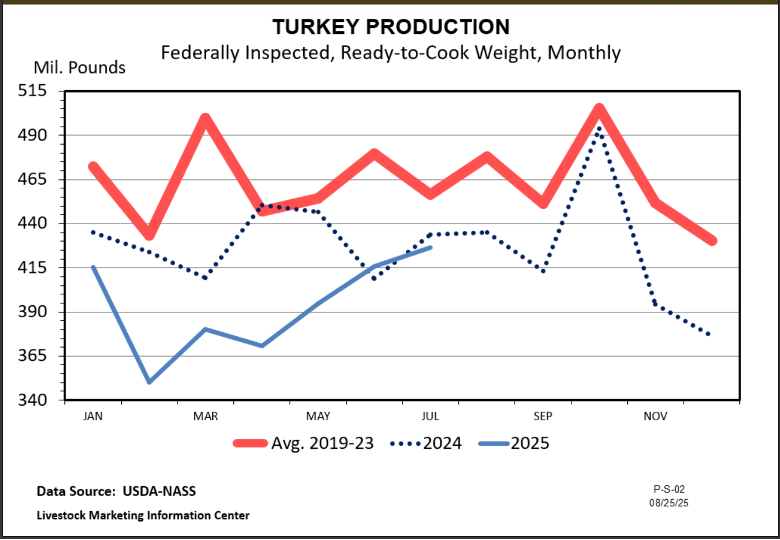
While current turkey prices are looking positive for producers, turkey growers have had a difficult time these past few years dealing with the loss of over 18 million birds to Highly Pathogenic Avian Influenza (HPAI). Overall production has been below historical averages in the past two years (Fig. 3). This fall has seen several cases of HPAI hit turkey operations, causing bird losses totaling 195,200 from August through early September. As wildfowl migration ramps up, more cases will likely appear this fall. Depending on the timing and severity of such outbreaks, the fresh turkey market could get hit with additional supply shrinkage, which would translate into yet higher prices for the 2025 holiday season.
(Fig. 1) Frozen turkey in storage is lower this year than the previous three years but trending upward as is usual for the season. With overall placements being down, this decreased supply may linger and be a positive leverage for prices this year.
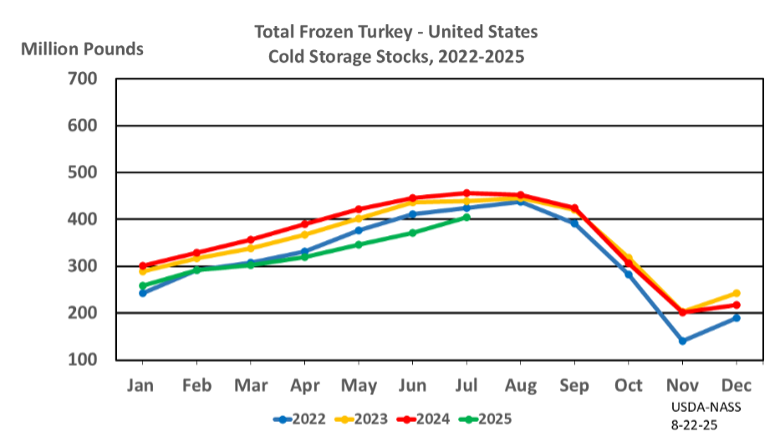
Fig. 2: Smaller turkeys, typically young hens, are where most whole birds come from, both fresh and frozen. Large truckload lot prices have been steady for these birds, perhaps reflecting contracted long-term pricing from larger buyers. However, as can be seen in the small lot pricing, as holiday demand starts to build, prices are likely to increase in the next month.
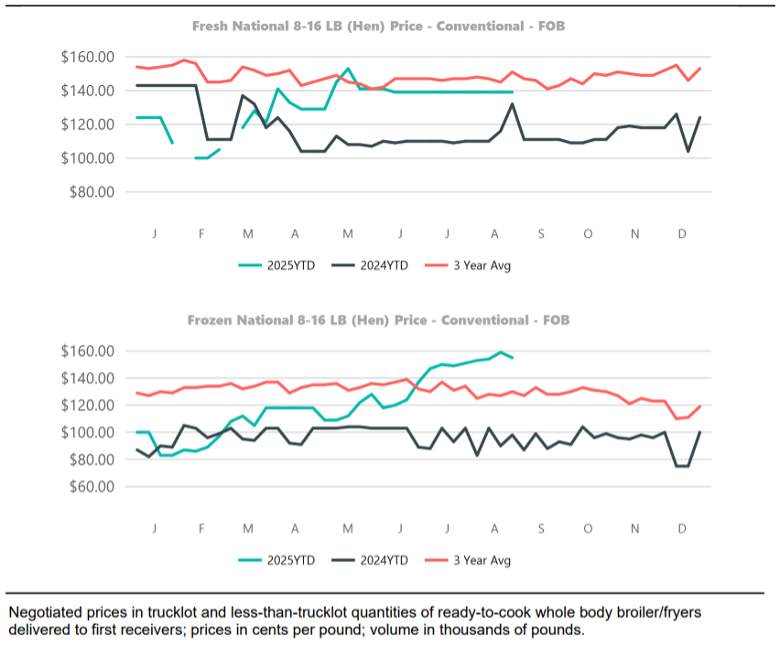
Fig. 3: Turkey production has been below historical average for the last two seasons, and looking at egg set and poult placement, this number is not expected to rebound soon.
Brothers, Dennis. “Turkeys – A 2025 Holiday Outlook.” Southern Ag Today 5(38.2). September 16, 2025. Permalink