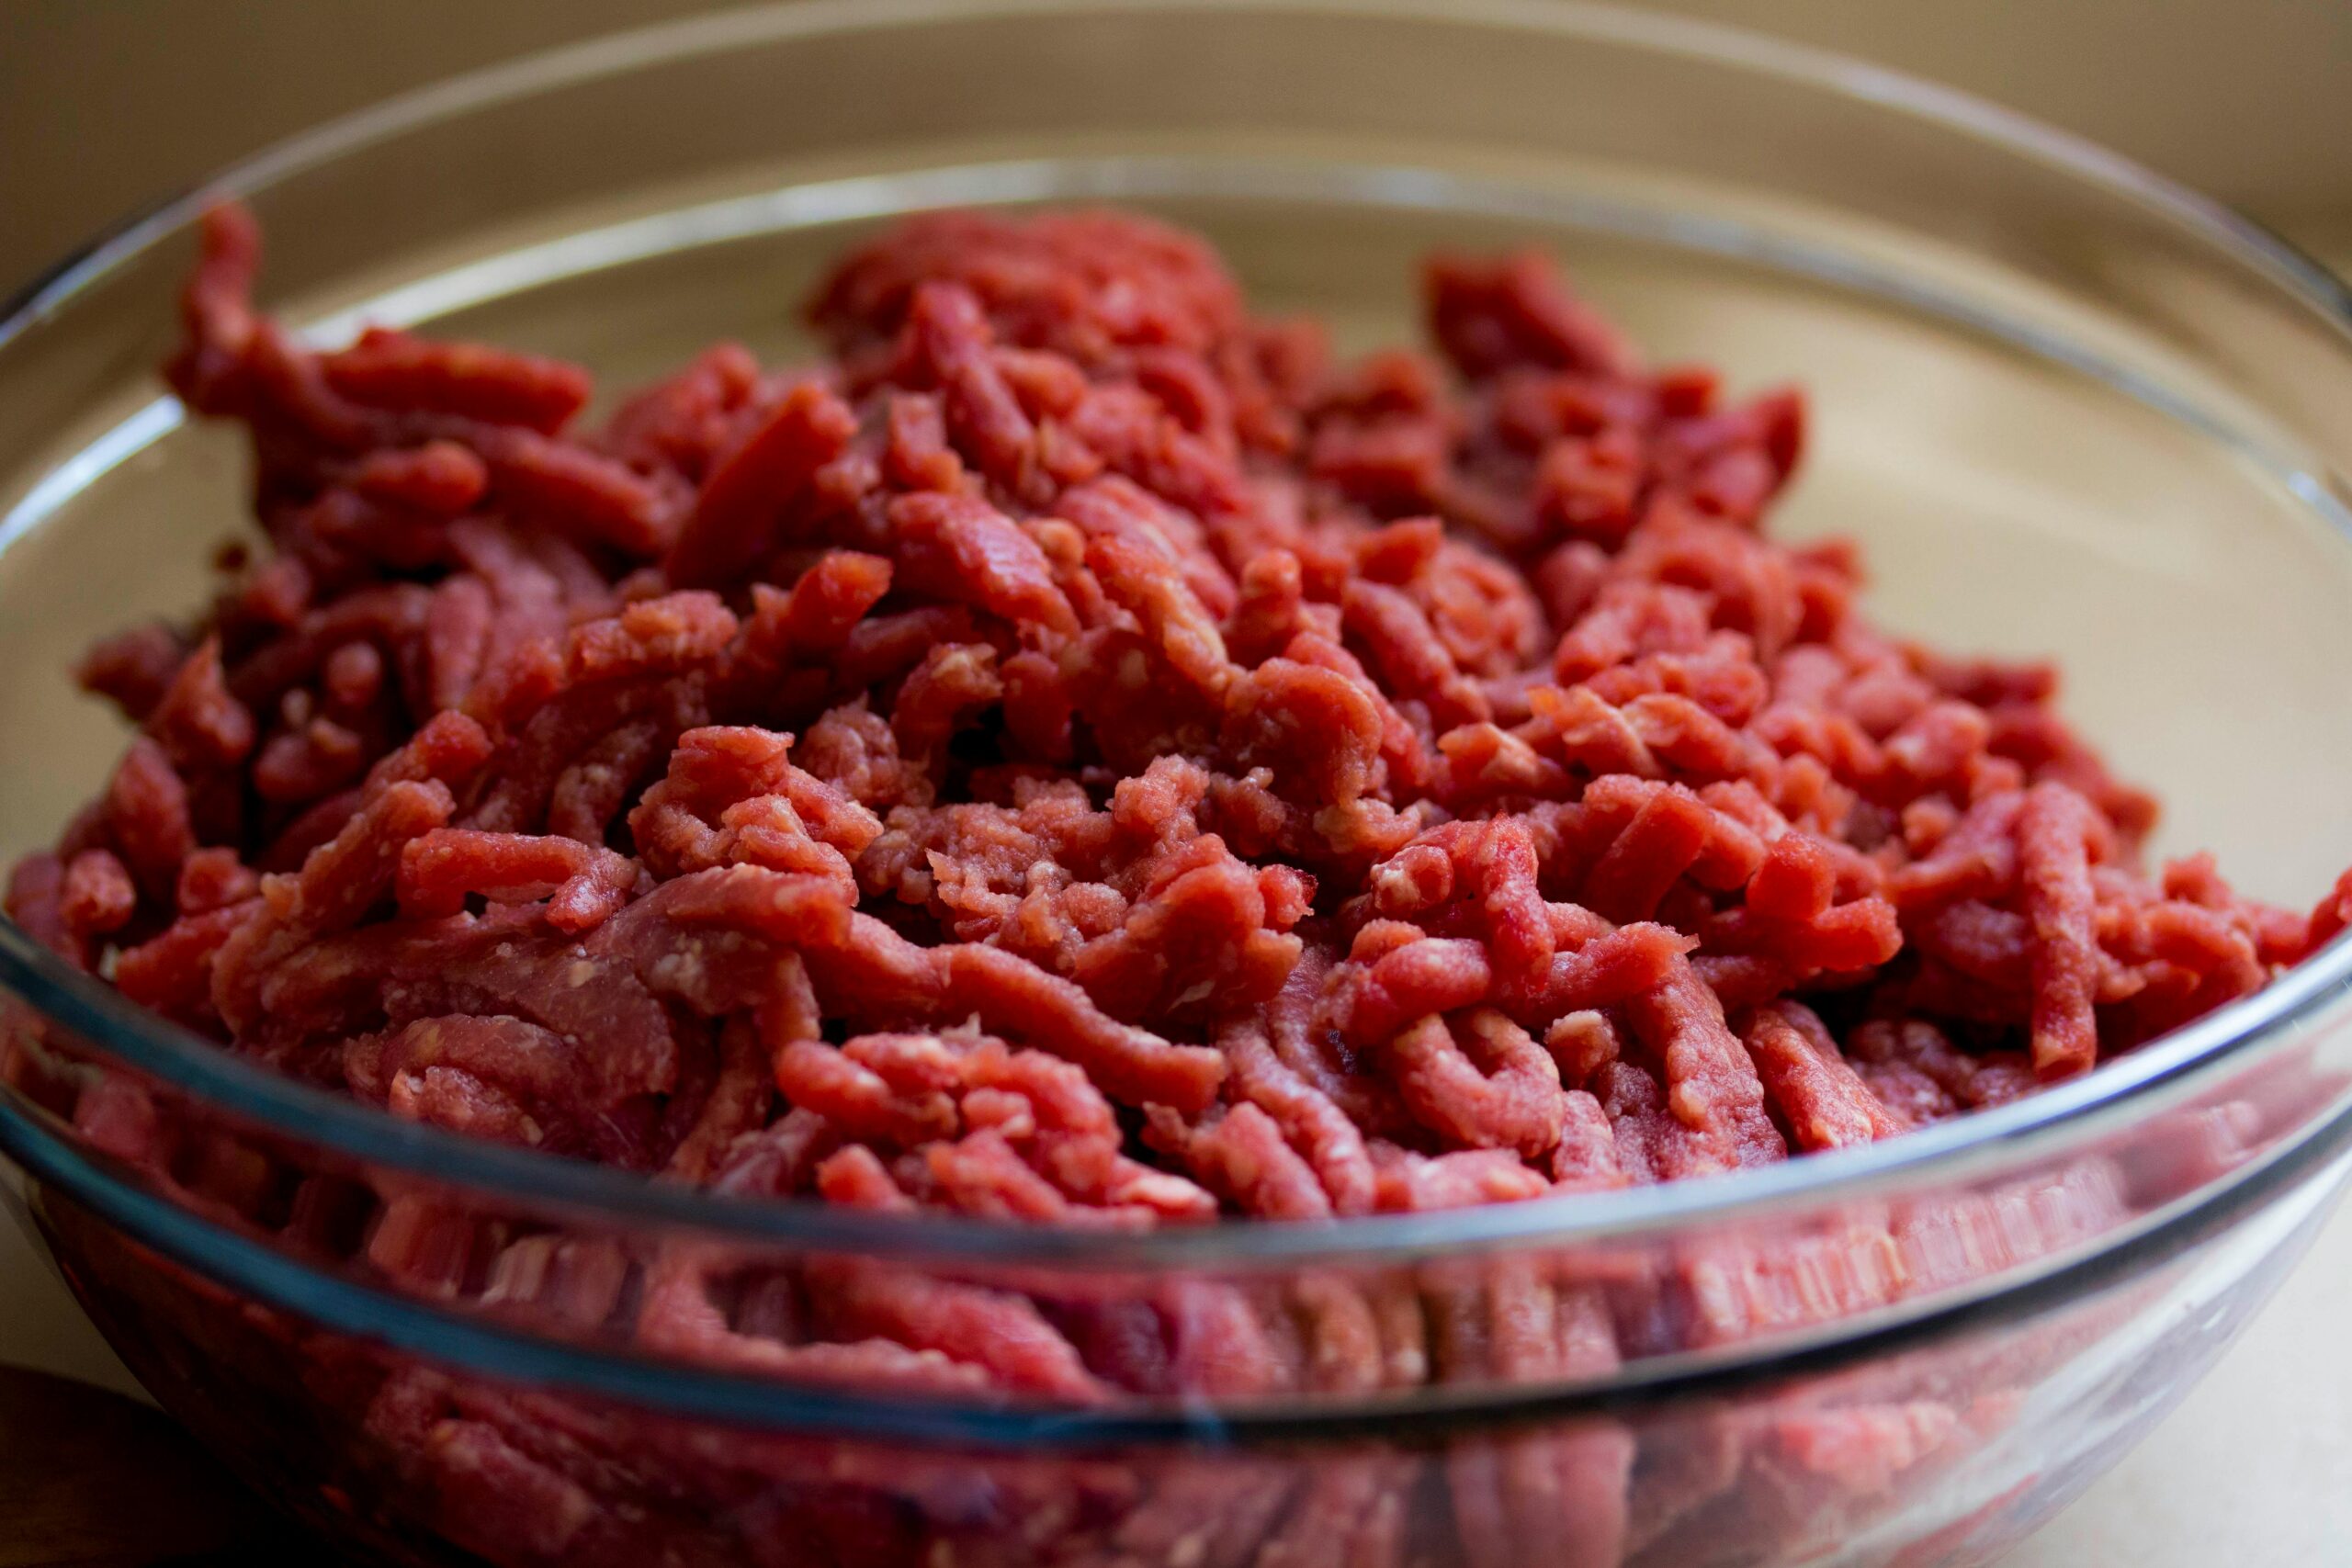
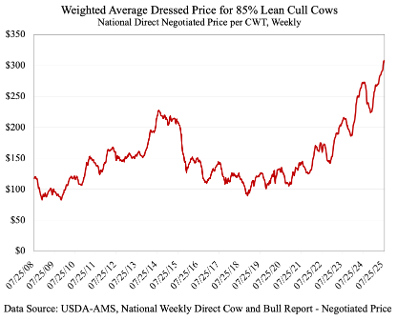
Tight supplies and strong demand are driving all types of cattle to record price levels, including cull cows. The national direct dressed price for 85 percent lean (boner cows) cull cows topped $300 per CWT last week for the first time in history. At local auctions across the southeast, cull cow prices are topping $160, $170, $180, and occasionally even $190 per cwt, depending on type. Ground beef demand has been strong and is the product most closely associated with lean trim from cull cows. Average U.S. retail ground beef prices topped $6 per pound in June for the first time ever, according to data from the Bureau of Labor Statistics.
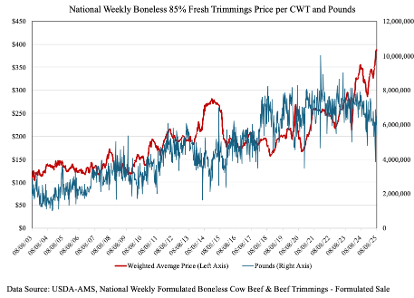
The chart below displays the price of 85 percent fresh trimmings and the pounds sold over time. This series is not comprehensive of all trims since it is just looking at formula sales for 85 percent trim and not any other percentages or sales type. However, the chart is interesting in that it highlights the inverse relationship between price and quantity. The declining availability of 85 percent trim over the past year has corresponded with sharp increases in price. This is driving the sharply higher dressed cow prices and local auction prices for cull cows.
Imports are a key piece of this puzzle. Beef imports are up sharply this year amid the high U.S. domestic prices. The majority of imports are lean trim that will be mixed with the fattier trim produced by domestic fed steers and heifers to make ground beef. Recent changes in tariffs will have impacts on lean trim. Brazil was the top import source for the first half of 2025, but the tariff on beef from Brazil jumped to 76 percent last week, which is sure to lead to significant reductions for as long as the tariff is in place. Meanwhile, the percentage of those imports that were lean trim will need to be filled by other import sources or domestic lean trim (i.e., cows and bulls). This is a good example of how tariffs and trade flows can impact domestic prices and supplies.
This all leads to an important discussion about cow herd expansion. Producers making culling decisions ahead of winter will be tasked with navigating the value of the cow as a cull cow vs their expected value in producing a calf next year. As the value of domestic lean trim increases, cull cow prices also increase. There will be some producers who would not have culled cows at $150 per CWT, but will cull cows if they are able to get $200 per CWT, if their expected value of calves in 2026 is unchanged. These decisions are all interconnected. In the absence of much heifer retention, it is possible that surging cull cow values could slow expansion efforts further.
In a recent Southern Ag Today article, the topic of beef x dairy (BxD) placements was discussed (Wyatt and Martinez, 2025). In that article, the authors highlight that the number of BxD calves has been increasing since 2016. If the number of BxD calves has been increasing over that time frame, then the breeding decision to use beef semen versus dairy semen, should have an impact on cattle semen sales.
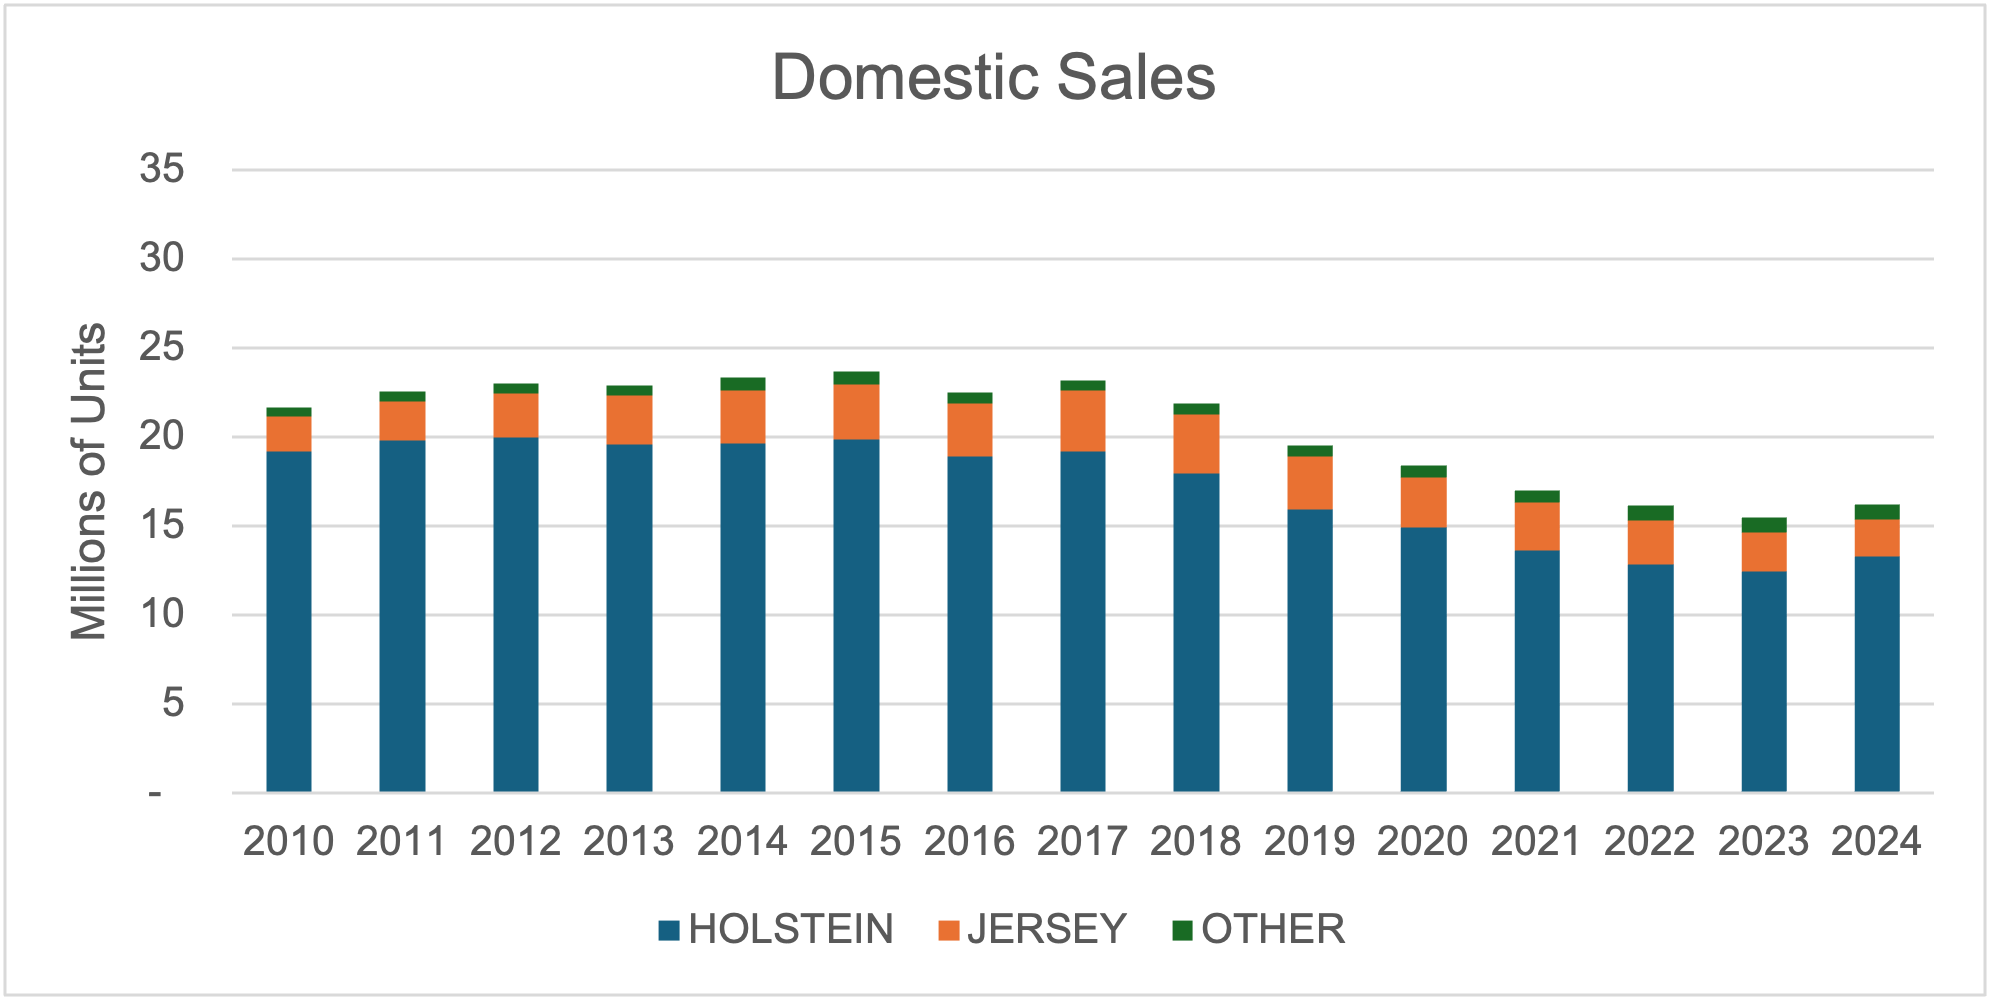
Annually, the National Association of Animal Breeders (NAAB) releases a report that includes domestic, export, and import sales for beef and dairy semen. Figure 1 displays the breed makeup of domestic US dairy semen sales from 2010-2024.
Figure 1. Domestic US Dairy Semen Sales.
Source: NAAB
In 2010, total domestic dairy semen sales were 21.6 million units and increased to 23.6 million (9.25% increase) in 2015. Since 2016, there has been a negative trend in overall units of domestic dairy semen sold. In 2024, there were approximately 16.1 million units sold, which is a 31.77% decrease since 2015. Holstien genetics make up the largest share of domestic dairy semen sales, followed by Jersey genetics. In 2010, Holstein sales made up 89% of domestic sales, while Jersey sales were 9%. In 2024, Holstein sales made up 82% of domestic sales, whereas Jersey sales were 13%.
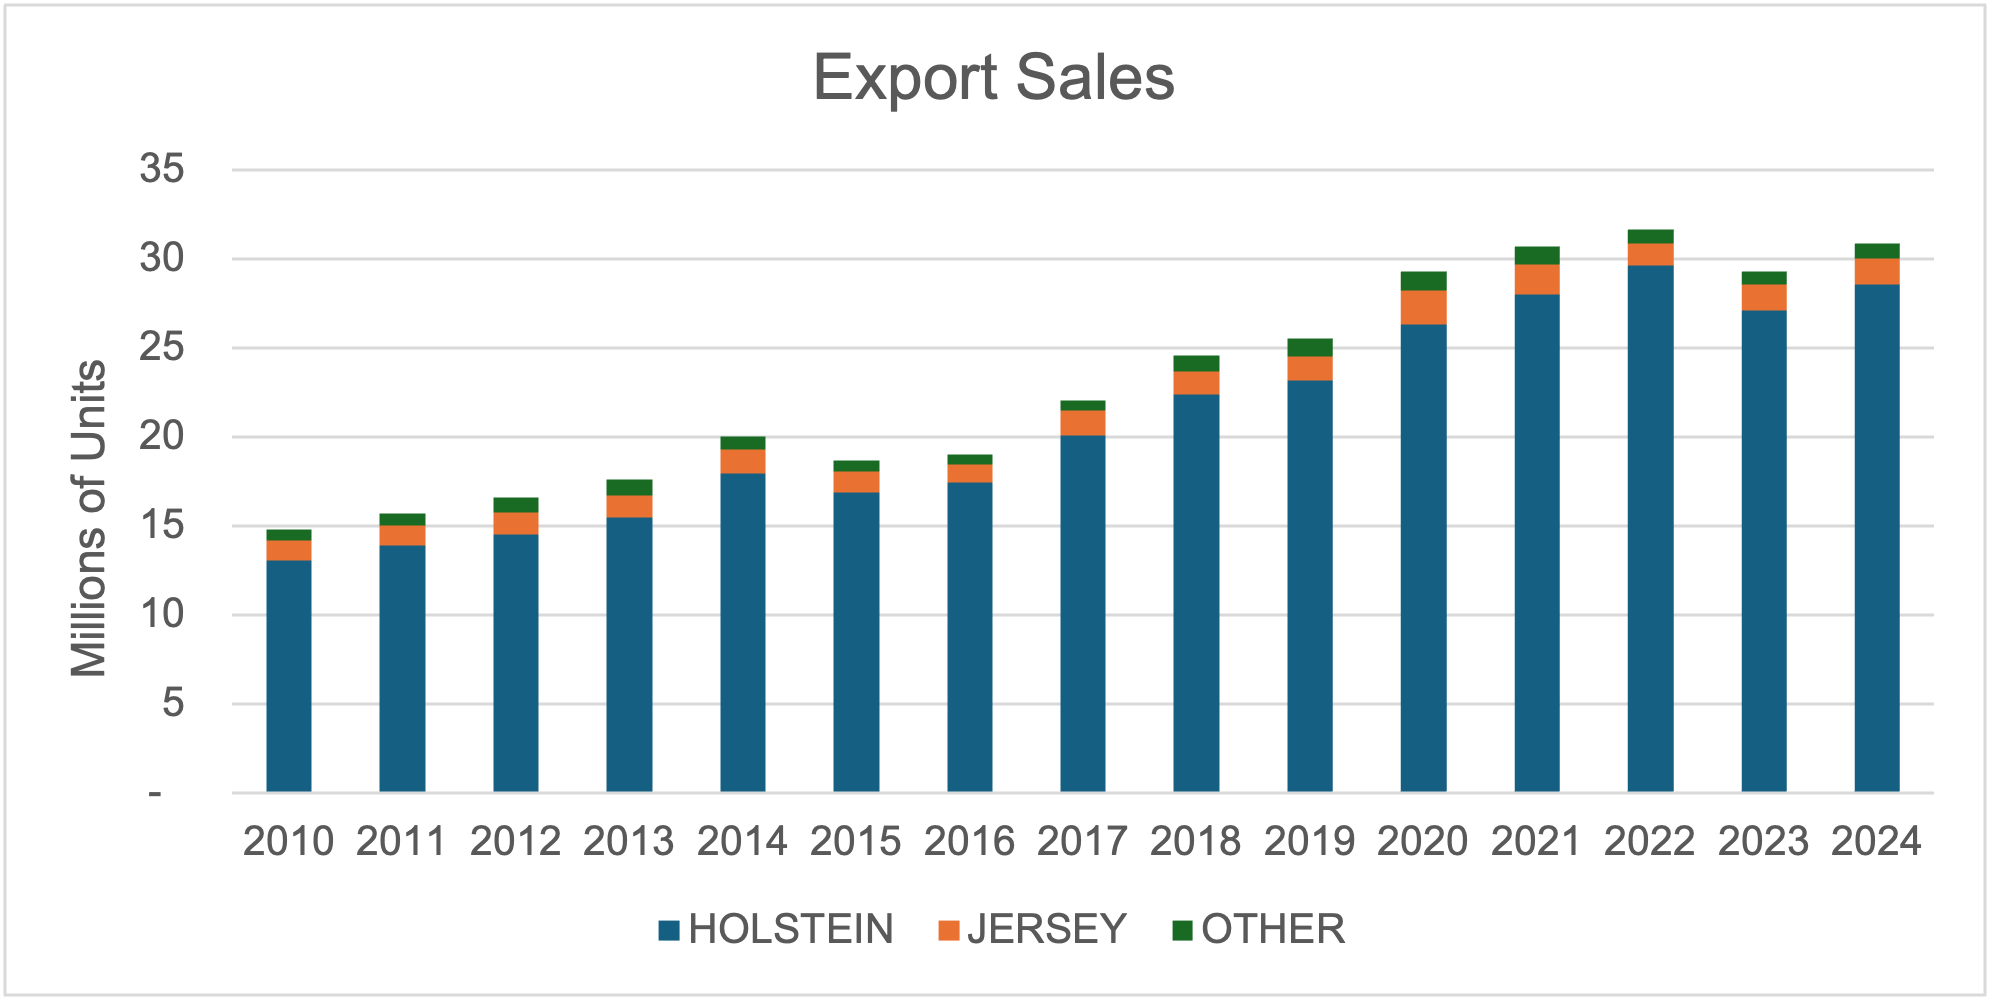
In contrast to domestic sales, there has been an increase in units of dairy semen exported. In 2010, there were approximately 14.8 million units of semen exported (Figure 2). In 2024, 30.8 million units of semen were exported, which is a 108% increase during that time frame. Holstein genetics constitute majority of these sales, and Jersey genetics are the second most. Top destinations for these sales are China, Brazil, Mexico, Argentina and the United Kingdom (United States Department of Agriculture-Foreign Agricultural Service, 2025).
Figure 2. US Dairy Semen Export Sales.
Source: NAAB
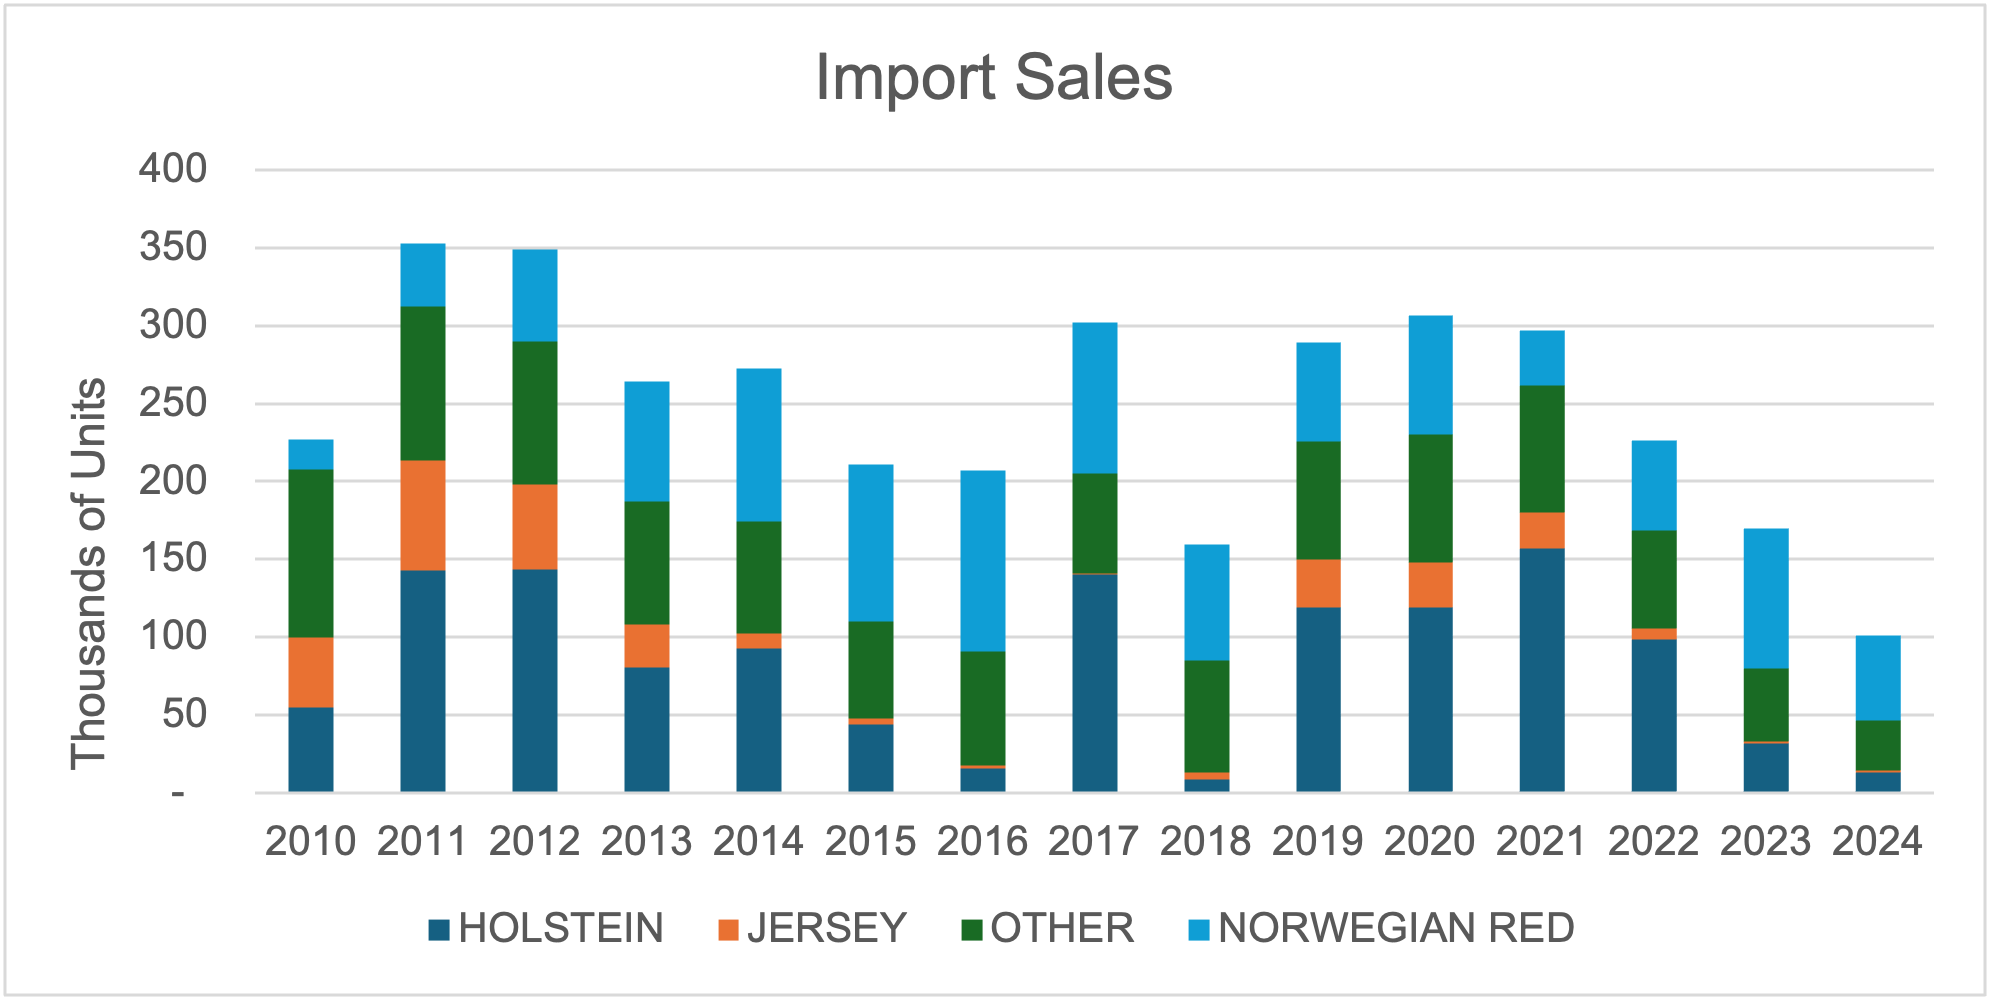
Since 2010, the market trend for imported dairy semen varies (figure 3). In 2010, there were about 220 thousand units of semen imported, 19 thousand consisting of Norwegian Red. In 2024, imports were at the lowest volume in the previous 14 years, with 101 thousand units, and over half of the imports being Norwegian Red genetics.
Figure 3. US Dairy Semen Import Sales.
Source: NAAB
The figures above highlight various trends for dairy semen sales. Domestic sales have trended lower since 2016, which is likely due to BxD production. Exports have increased over time, highlighting the value of US dairy genetics. Imports are low in volume but have increased in Norwegian Red genetics.
References
Wyatt, Parker, and Charley Martinez. “Beef x Dairy Placements.” Southern Ag Today 5(29.2). July 15, 2025. Permalink
National Association of Animal Breeders. 2025. “Semen Sales Report 2010-2024.”
United States Department of Agriculture-Foreign Agricultural Service. 2025. “Global Agricultural Trade System Database.” Internet site: https://apps.fas.usda.gov/gats/default.aspx (Accessed July 2025).
USDA released its Cattle on Feed and July Cattle inventory reports on Friday, July 25th. These reports are a good opportunity to poll some thoughts from our SAT authors across the South.
Will Secor – University of Georgia
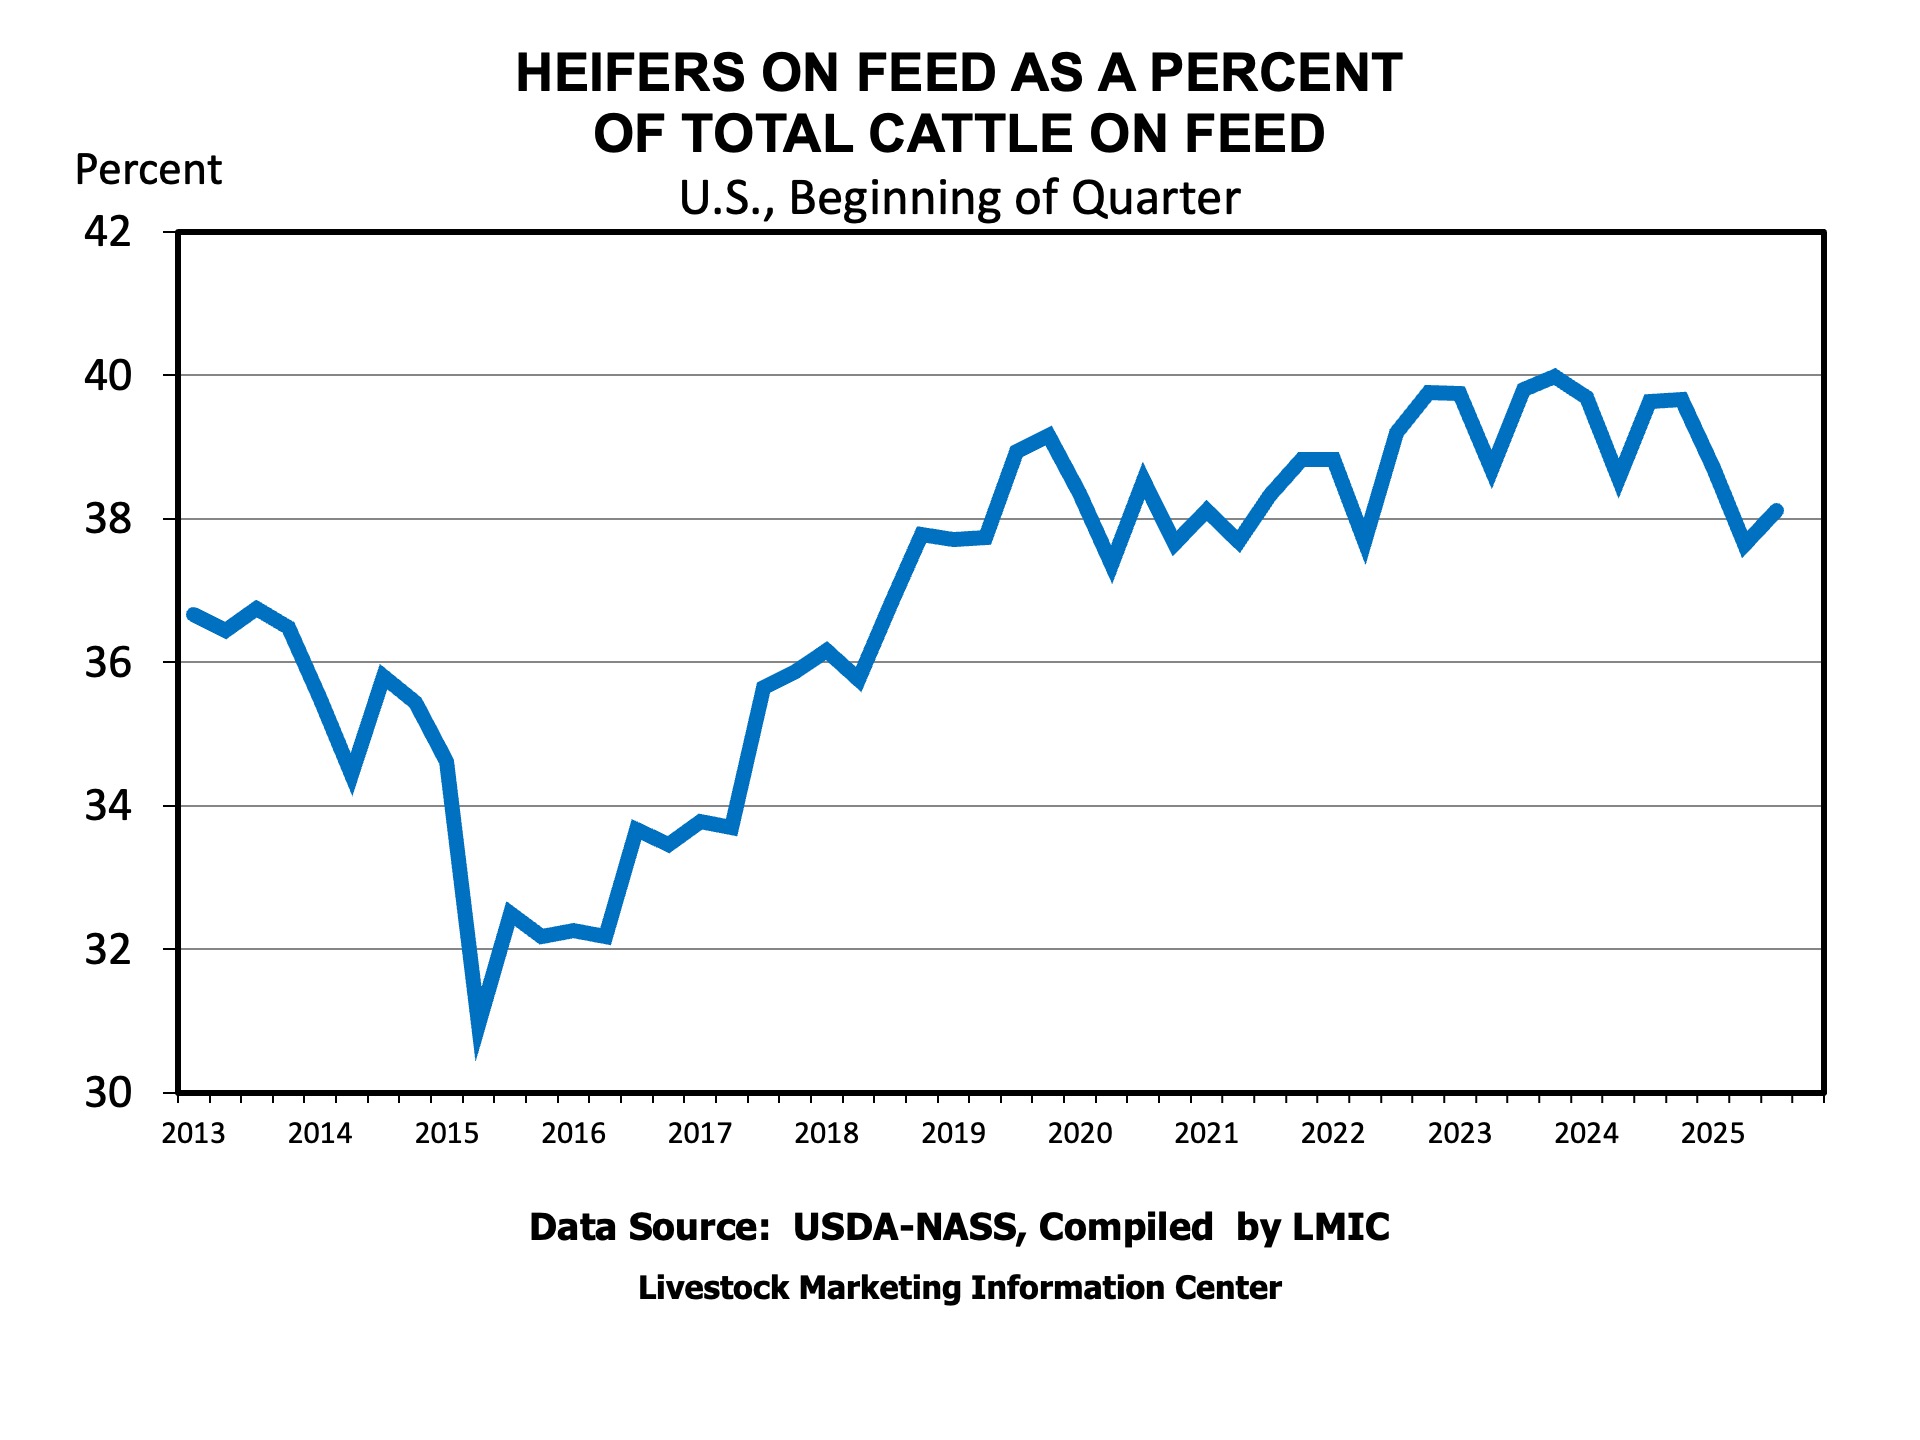
The July Cattle and Cattle on Feed reports from USDA provided indications that the cattle herd is approaching a low in inventory but may not be there just yet. The mid-year Cattle report provided a first estimate of the 2025 calf crop, which is projected to be roughly 1.3 percent smaller than the 2024 calf crop. Combined with January’s report of fewer beef cow replacement heifers, this is an indication that the cattle herd may still be smaller come January 2026. However, the Cattle on Feed report indicates that the share of cattle on feed that are heifers declined again year-over-year to its lowest July reading since 2019. Overall, these reports show a continued decline in the cattle inventory, but they also shed some light on the potential of a rebuild that may be starting soon.
Kenny Burdine – University of Kentucky
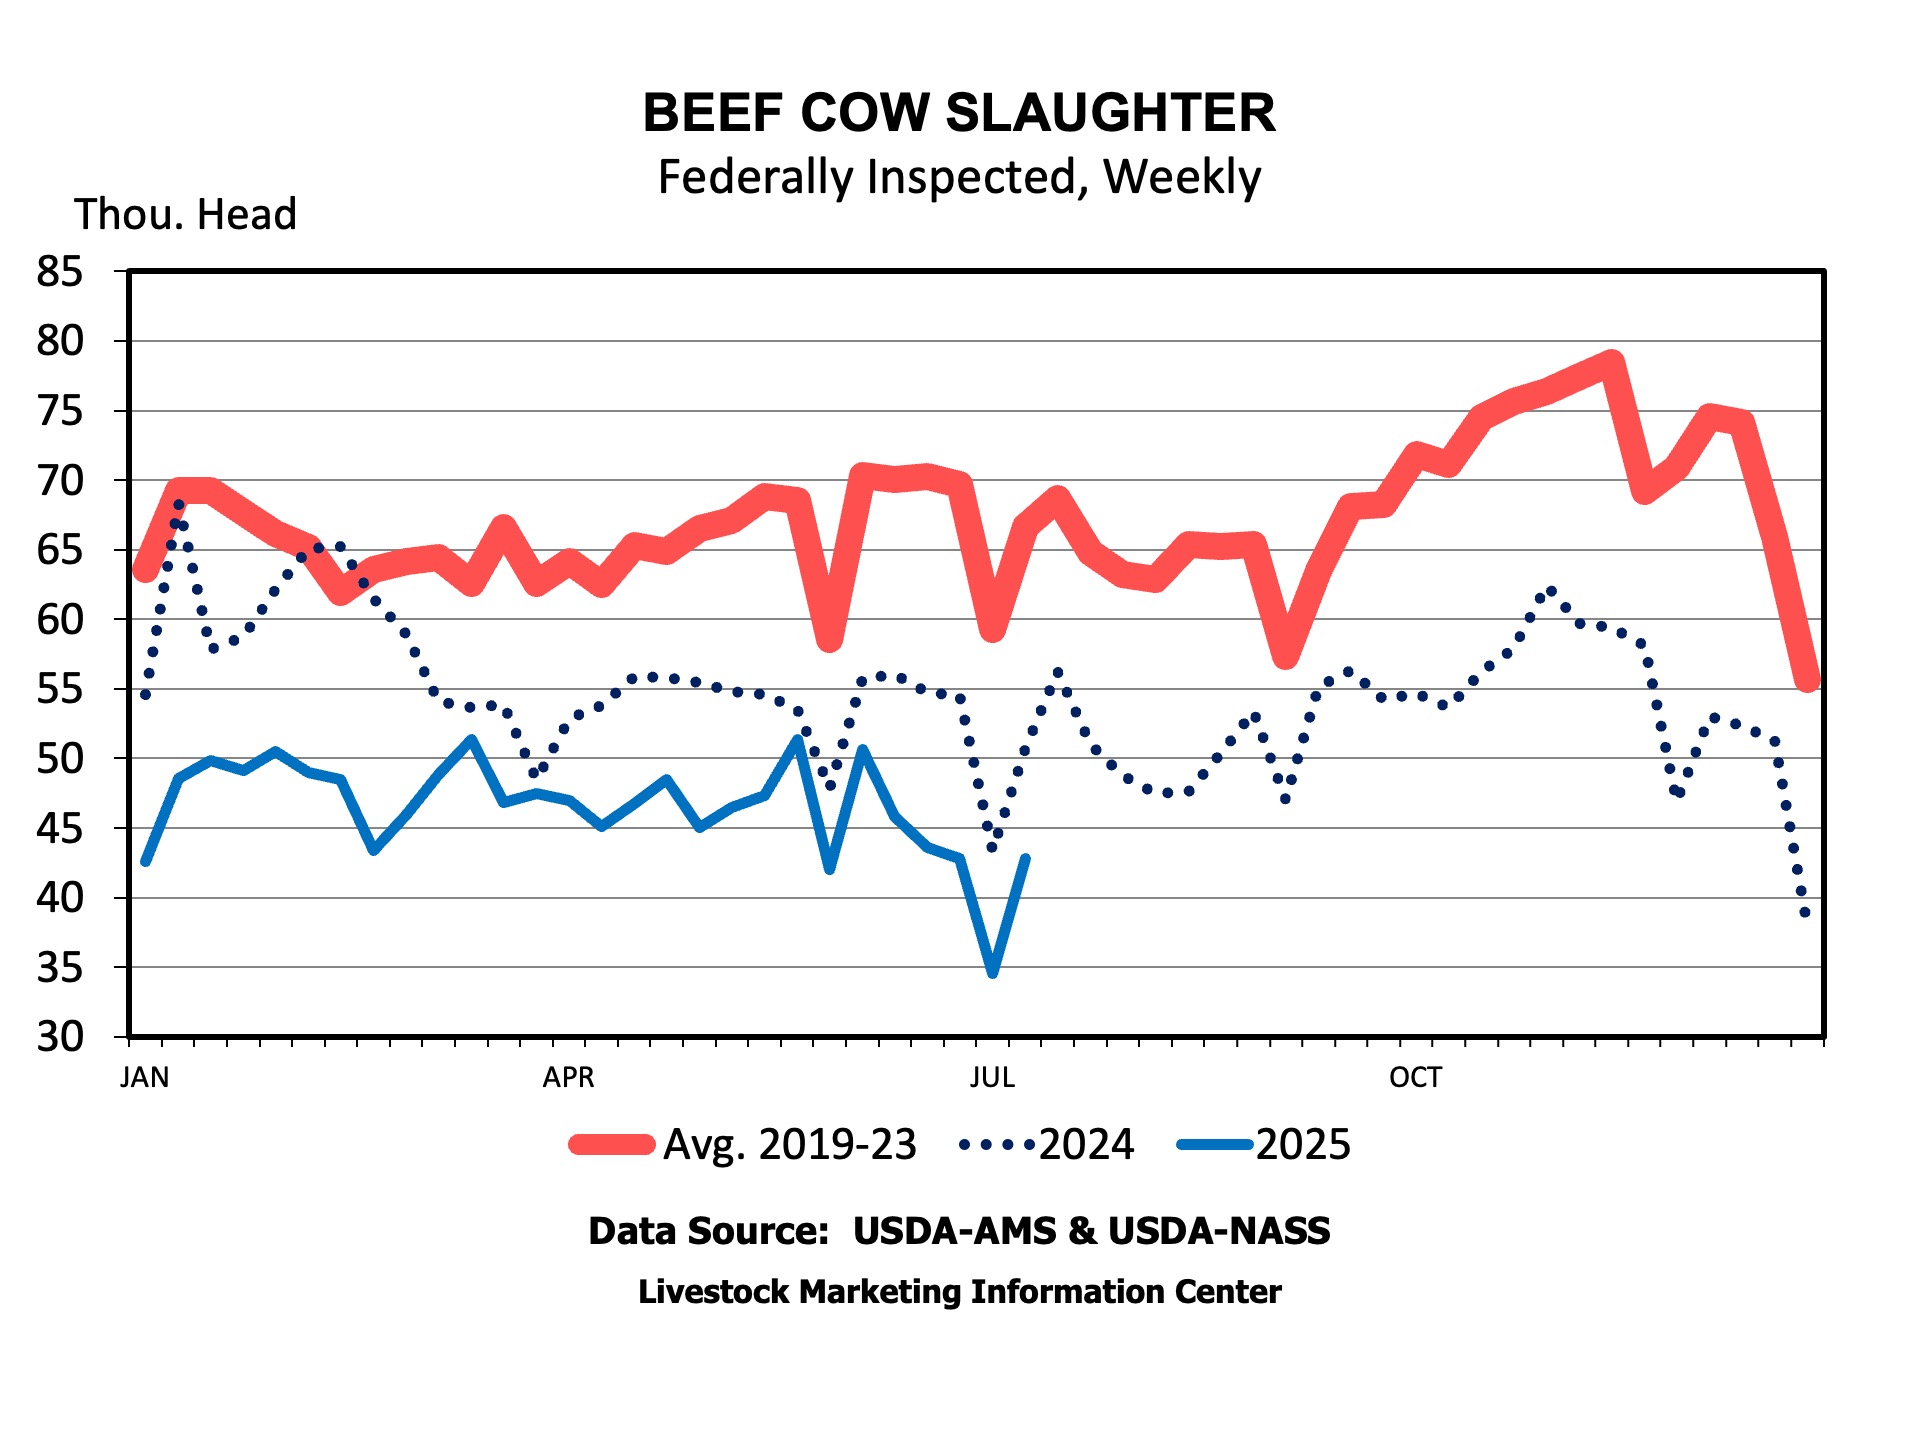
The fact that there was no mid-year inventory report in 2024 makes comparison a bit difficult. Beef cow inventory was down by 1.2% from July of 2023. Most were expecting beef cow inventory to be down a bit more over the last two years, but I think this speaks to how much lower beef cow slaughter has been running. For the 12 months from July 2024 to June 2025, nearly 650,000 fewer beef cows were harvested than from July 2023 to June 2024. I think it’s likely that beef cow inventory was down by more than that from July 2023 to July 2024, but increased over the last 12 months due to lower slaughter levels. Heifers held for beef cow replacement were down 3% from 2023, which is a decrease of 100,00 head. The best way to think about this number is to consider it as a percentage of beef cow inventory. When looking at it that way, our heifer retention pace is lower than it was in 2023.
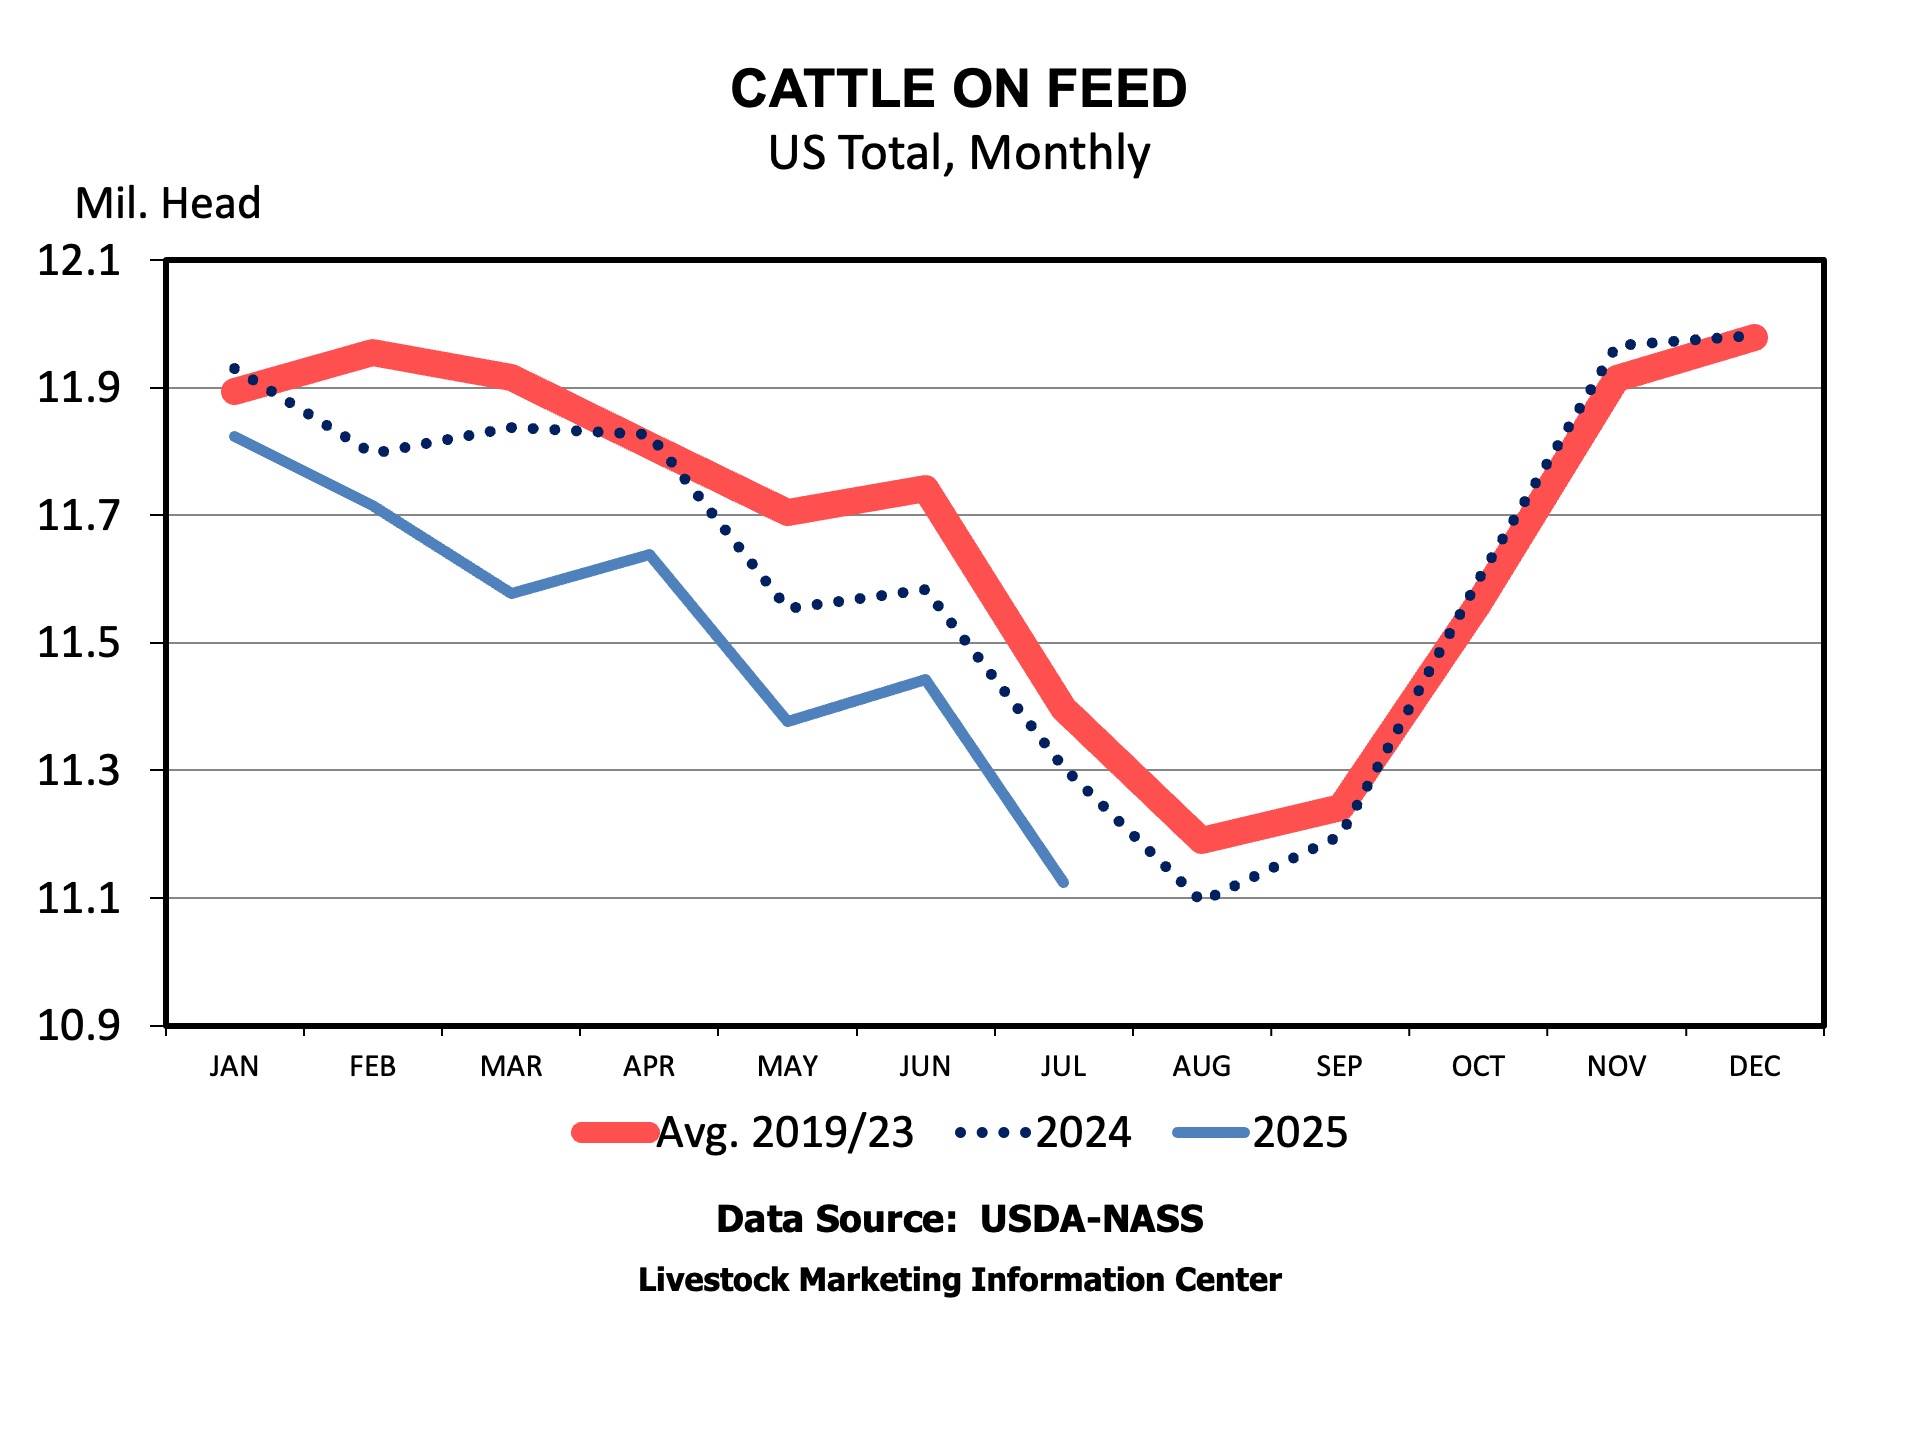
The surprise of this quarterly cattle-on-feed report was June placements, which were down 8% from 2024 and outside the range of expectations. Marketings continue to suggest we may be pulling cattle ahead, but placements suggest we are not replenishing them at the same pace.
Heifers, as a percentage of on-feed inventory, came in at 38.1%. This is about a percent and a half lower than July 1 of 2024, but up about half a percent from April of this year. Much like the beef replacement heifer estimate from the inventory report, this does not suggest much retention is occurring. Any growth in beef cow numbers is coming from reduced cow slaughter.
Shifting my focus towards home, I don’t think much retention is occurring in Kentucky at present. Anecdotally, producers tell me they are not keeping heifers at these price levels. I also think interest rates are impacting this decision. I do expect some expansion to occur in the Commonwealth over the next few years, but we are limited by land constraints and land costs.
Andrew Griffith – University of Tennessee
I don’t really know what to say about these reports. A lot of the time we discuss industry estimates compared to USDA estimates. The main thing in this report is we saw lower beef cow numbers, a smaller calf crop, and fewer cattle on feed.
It looks like more heifers are being retained this year and fewer cows are being slaughtered. There is a good chance we see a steady to slightly higher beef cow number come January 1, 2026. Of course, drought could hit once again and further delay rebuilding.
The one thing I feel certain is that the competition for cattle is going to be fierce the next couple of years. I think we will see closures, idling, or consolidation of packing plants and feedlots. Even if that does not happen, capacity utilization is going to be small. This also feeds back to stocker and backgrounders who will be growing a smaller number of cattle than usual, which will influence profitability.
Josh Maples – Mississippi State University
I don’t see significant signs of expansion from these reports. Heifers held for beef cow replacement were down 3% from the 2023 report. The 5% drop in heifers placed into feedlots during the last quarter is the number that jumps out as the question mark. But, taken with all of the other data, I’m not yet ready to call it an obvious sign of expansion. After accounting for fewer imports from Mexico, heifer placement is down 2.5% during the first half of 2025 compared to the first half of 2024. It could just be that we have fewer heifers due to smaller calf crops, and that there are some differences in placement timing. The overall percentage of heifers on feed ticked back up to 38% after dropping in the previous quarter. I think 2025 is likely a stabilization year for beef cow inventory, with 2026 having the higher odds for modest expansion if pasture conditions cooperate.
Hannah Baker – University of Florida
While the 2025 July Inventory Report does not include state breakdowns, the numbers reported in both the inventory and cattle on feed reports reflect what is happening across Florida: some producers are thinking of and starting to retain heifers, but the majority are still capitalizing on record-high calf prices. Beef replacement heifers are down 3 percent from 2023, and the beef cow herd is smaller by 350,000 head. The number of “other heifers over 500 pounds” is also 3 percent lower than 2023, meaning there is also a smaller pool of heifers to pull from for any impulse breeding in the back half of 2025 and early 2026. Signs of slow heifer retention are also shown in the Cattle on Feed report, where the number of heifers on feed was 5% lower than 2024, but the percentage of heifers on feed rose by 0.5% since April to 38.1%.
James Mitchell – University of Arkansas
A statistic I like to track is the ratio of July beef replacement heifers relative to the previous year’s calf crop (as estimated in the January report). I use this as a crude indicator of retention and potential herd expansion. The estimate for July 2025 is 11.04%, nearly identical to July 2023 at 11.03%. For comparison, the ratio was 14.32% in July 2015. We’re not there yet, which makes me wonder: with strong profitability over the last few years, are producers reinvesting in other ways – farm infrastructure, equipment, land?
Charley Martinez – University of Tennessee
It’s unfortunate that we didn’t have last year’s July 1 report. But, when looking at the percentage of changes between 2023 and 2025, I think the trends were expected. The most interesting statistic to me was the expected 2025 calf crop of 33.1 million head. The calf crop was 33.56 million in 2023, and 33.52 million in 2024. The calf crop expectation highlights the impacts of the shrinking herd over the last two years, and the expected tighter feeder calf supply signals continued elevated feeder calf prices. This report also starts the excitement for the January 1 report, where we will have statistics and more detailed data.
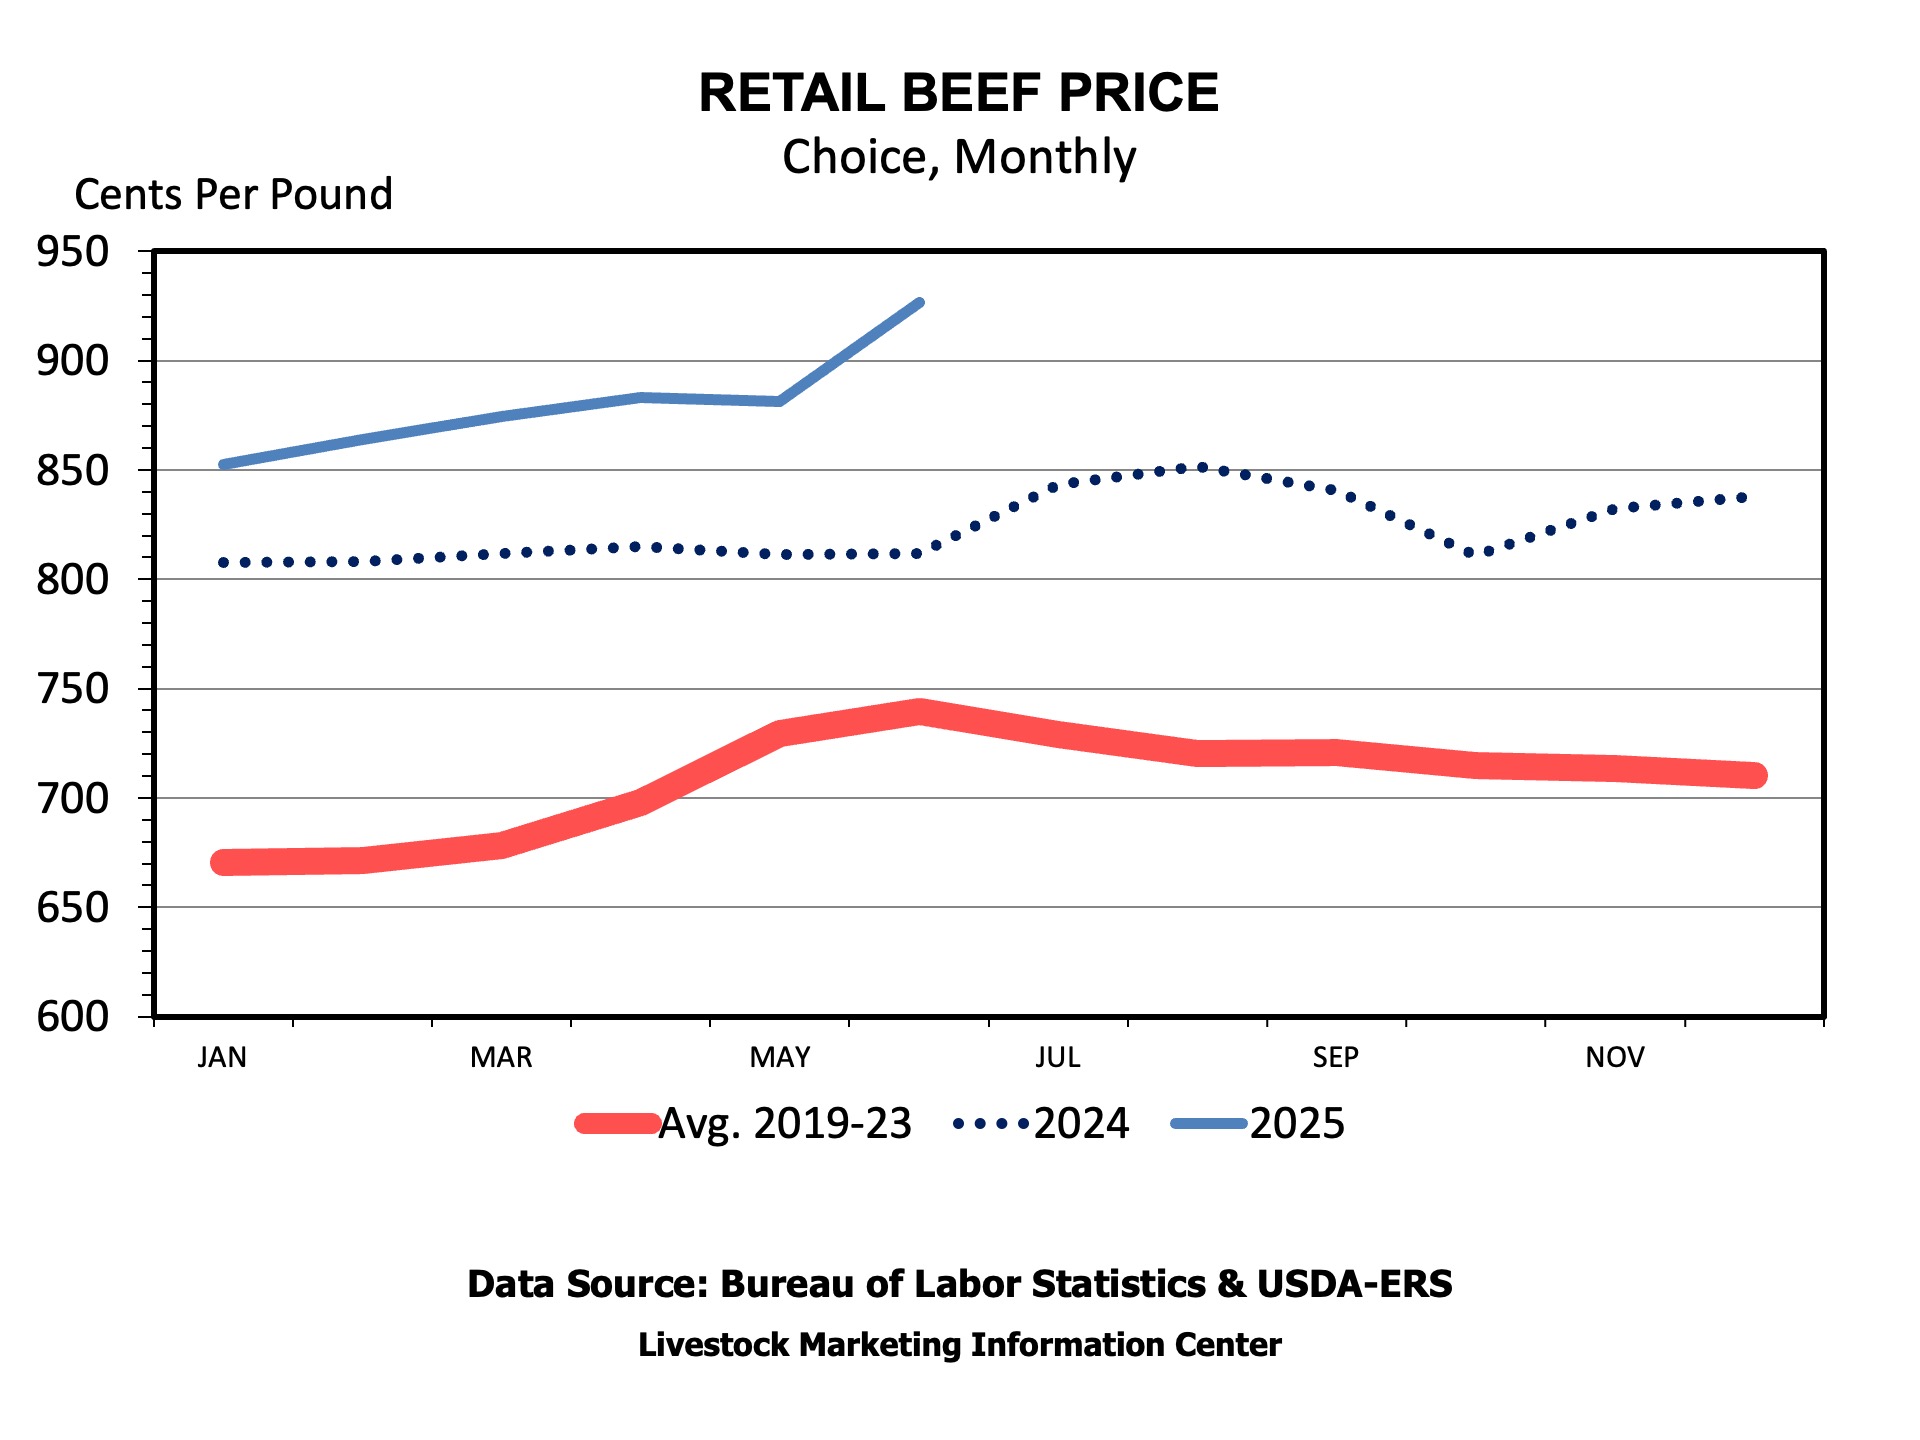
The record high retail beef price reported by the most recent Consumer Price Index (CPI) has prompted a lot of calls about why prices are record high and whether there is any relief in sight. While we often write about the great cattle prices for producers who are selling, there is a flip side, and that is consumers who are buying beef.
Reduced slaughter and beef production, especially in the second quarter of the year, cut supplies just as grilling season heated up seasonal beef demand. The combination led to a spike in wholesale prices and retail beef prices.
Is there a chance for consumers to see falling retail beef prices in the coming months? Normal seasonal production and demand would suggest prices falling from recent highs. Evidence from the wholesale beef market over the last couple of weeks indicates lower prices.
Starting with the cutout, the Choice boxed beef cutout has declined each week since it hit a record high weekly average value of $394 per cwt 4 weeks ago. Each of the seven primal cuts that make up the cutout has declined in price over this period.
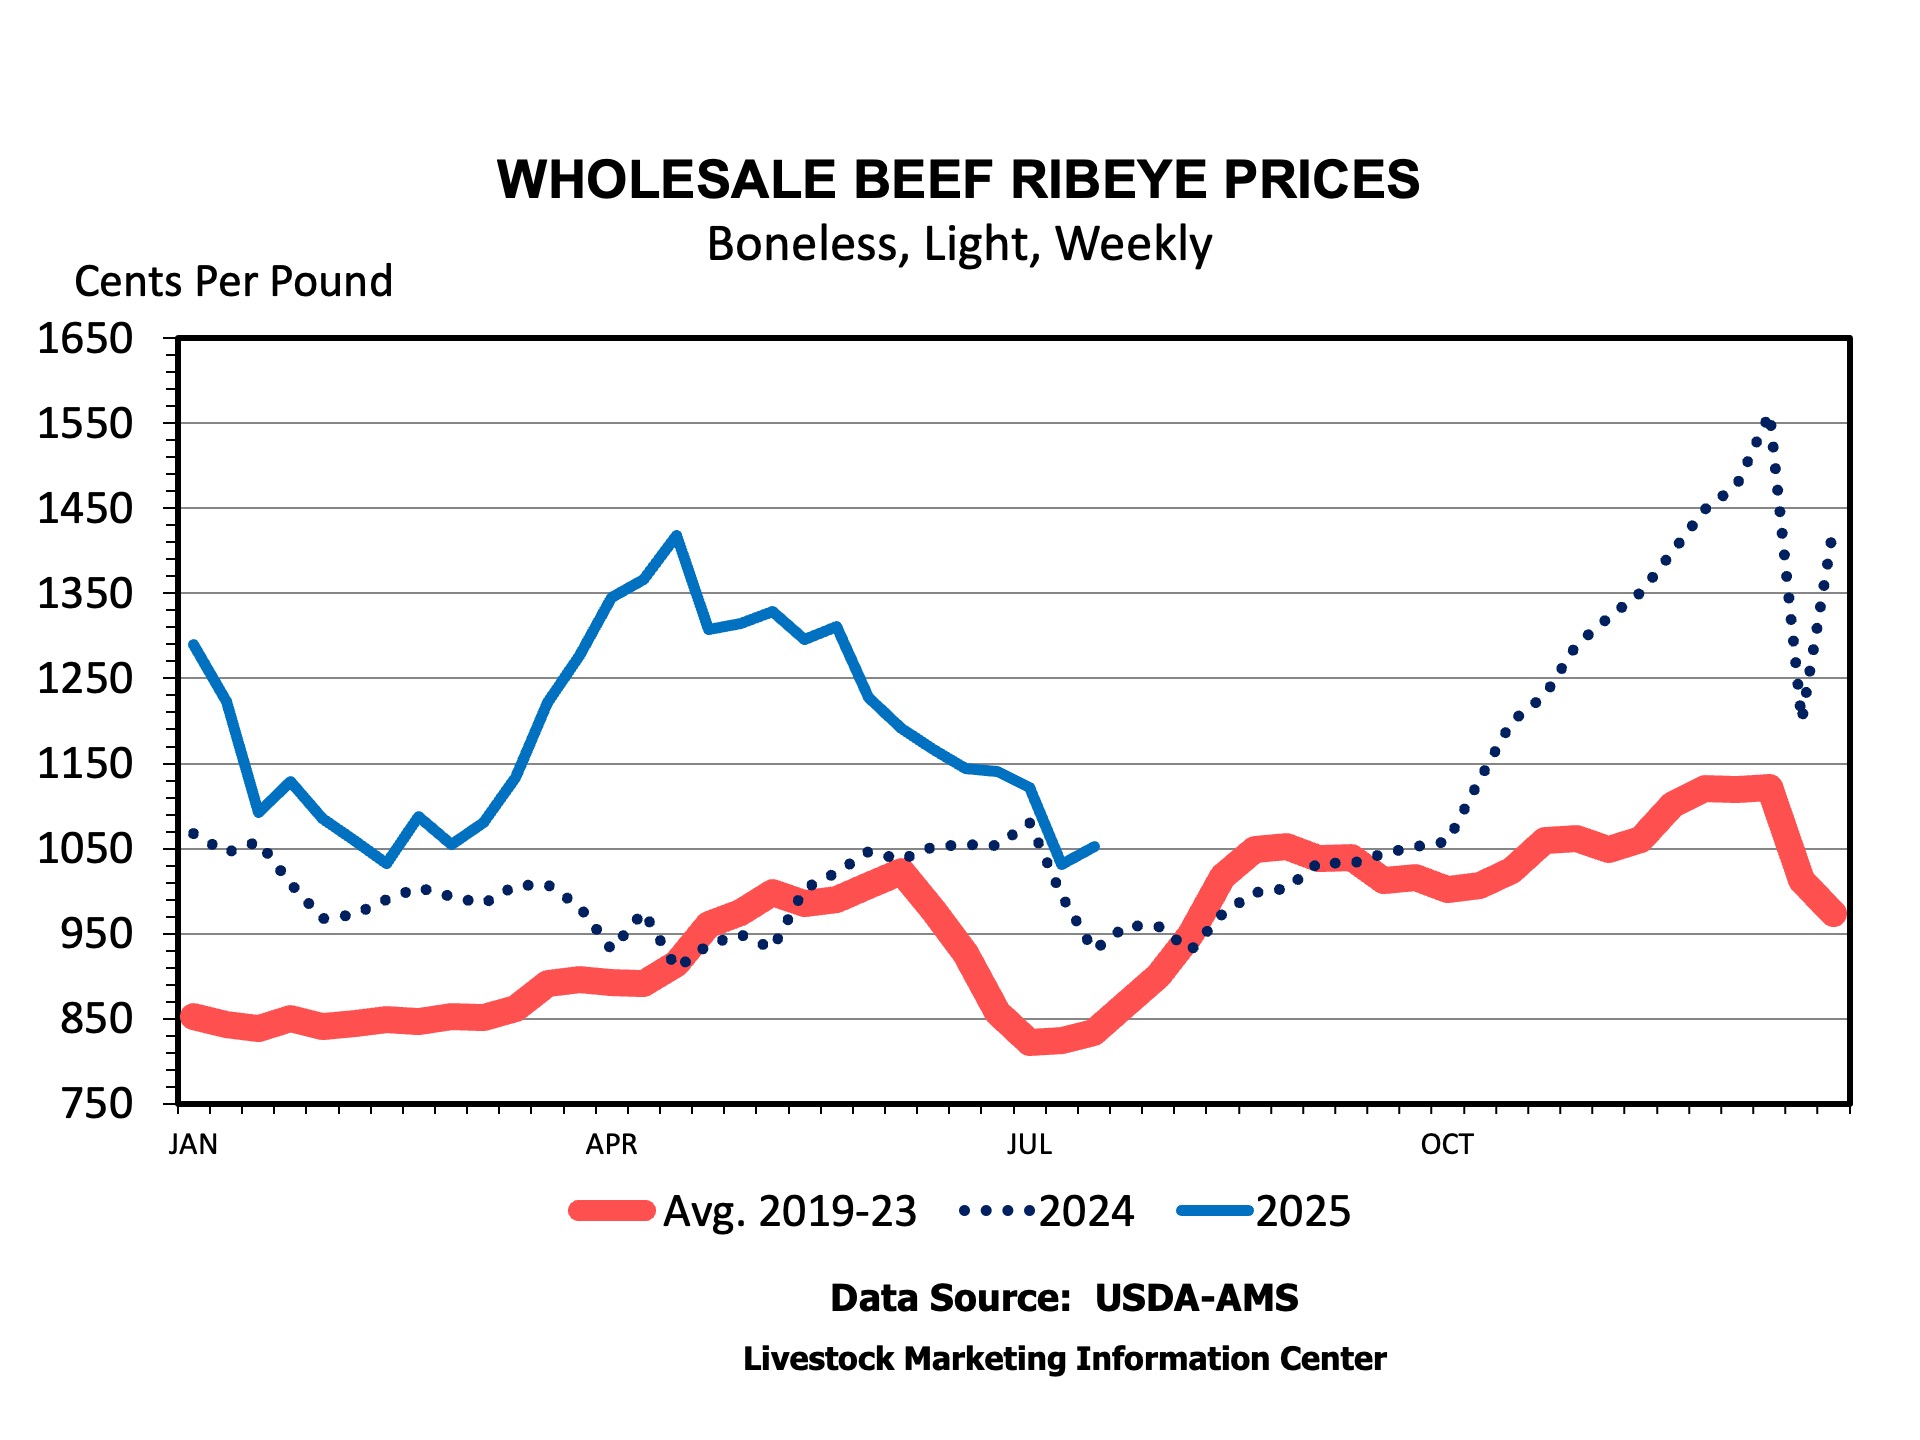
Ribeye steaks exhibit the normal seasonal pattern that peaks early in grilling season, then declines after Memorial Day. Ribeyes hit their annual peak price in late Fall as holiday demand drives them higher. Following the pattern, wholesale beef ribeyes peaked in price at $14.18 per pound. They have since declined to $10.50 per pound, only slightly ahead of last year.
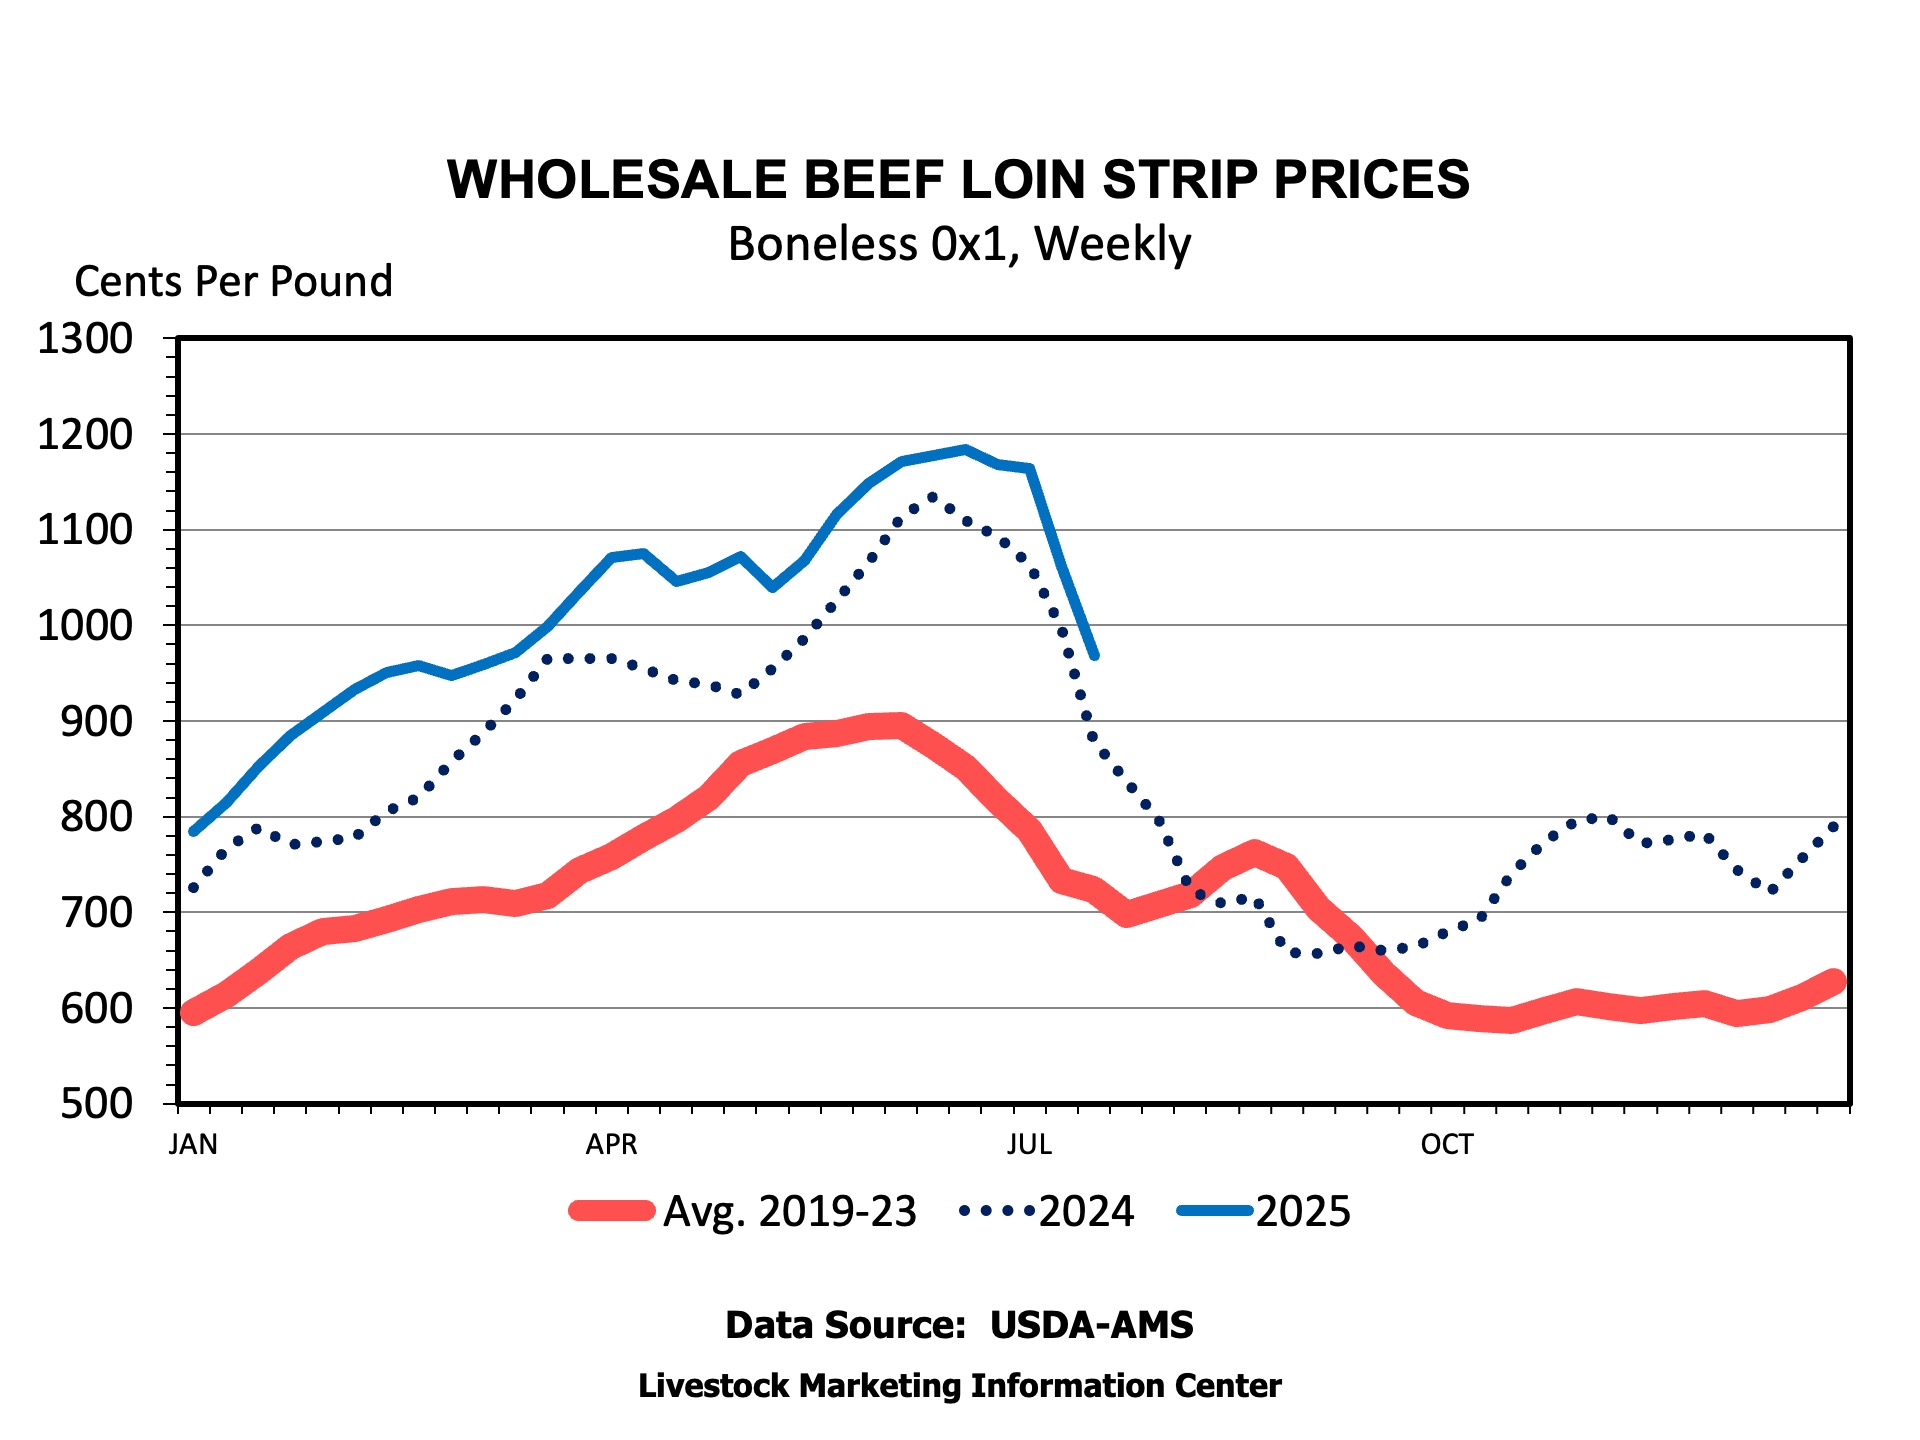
Loin strips usually hit their annual wholesale price peak leading up to July 4th. They hit $11.84 per pound in June and have since dropped to $9.68 per pound. The price remains higher than last year, but wholesale spot market prices are coming down.
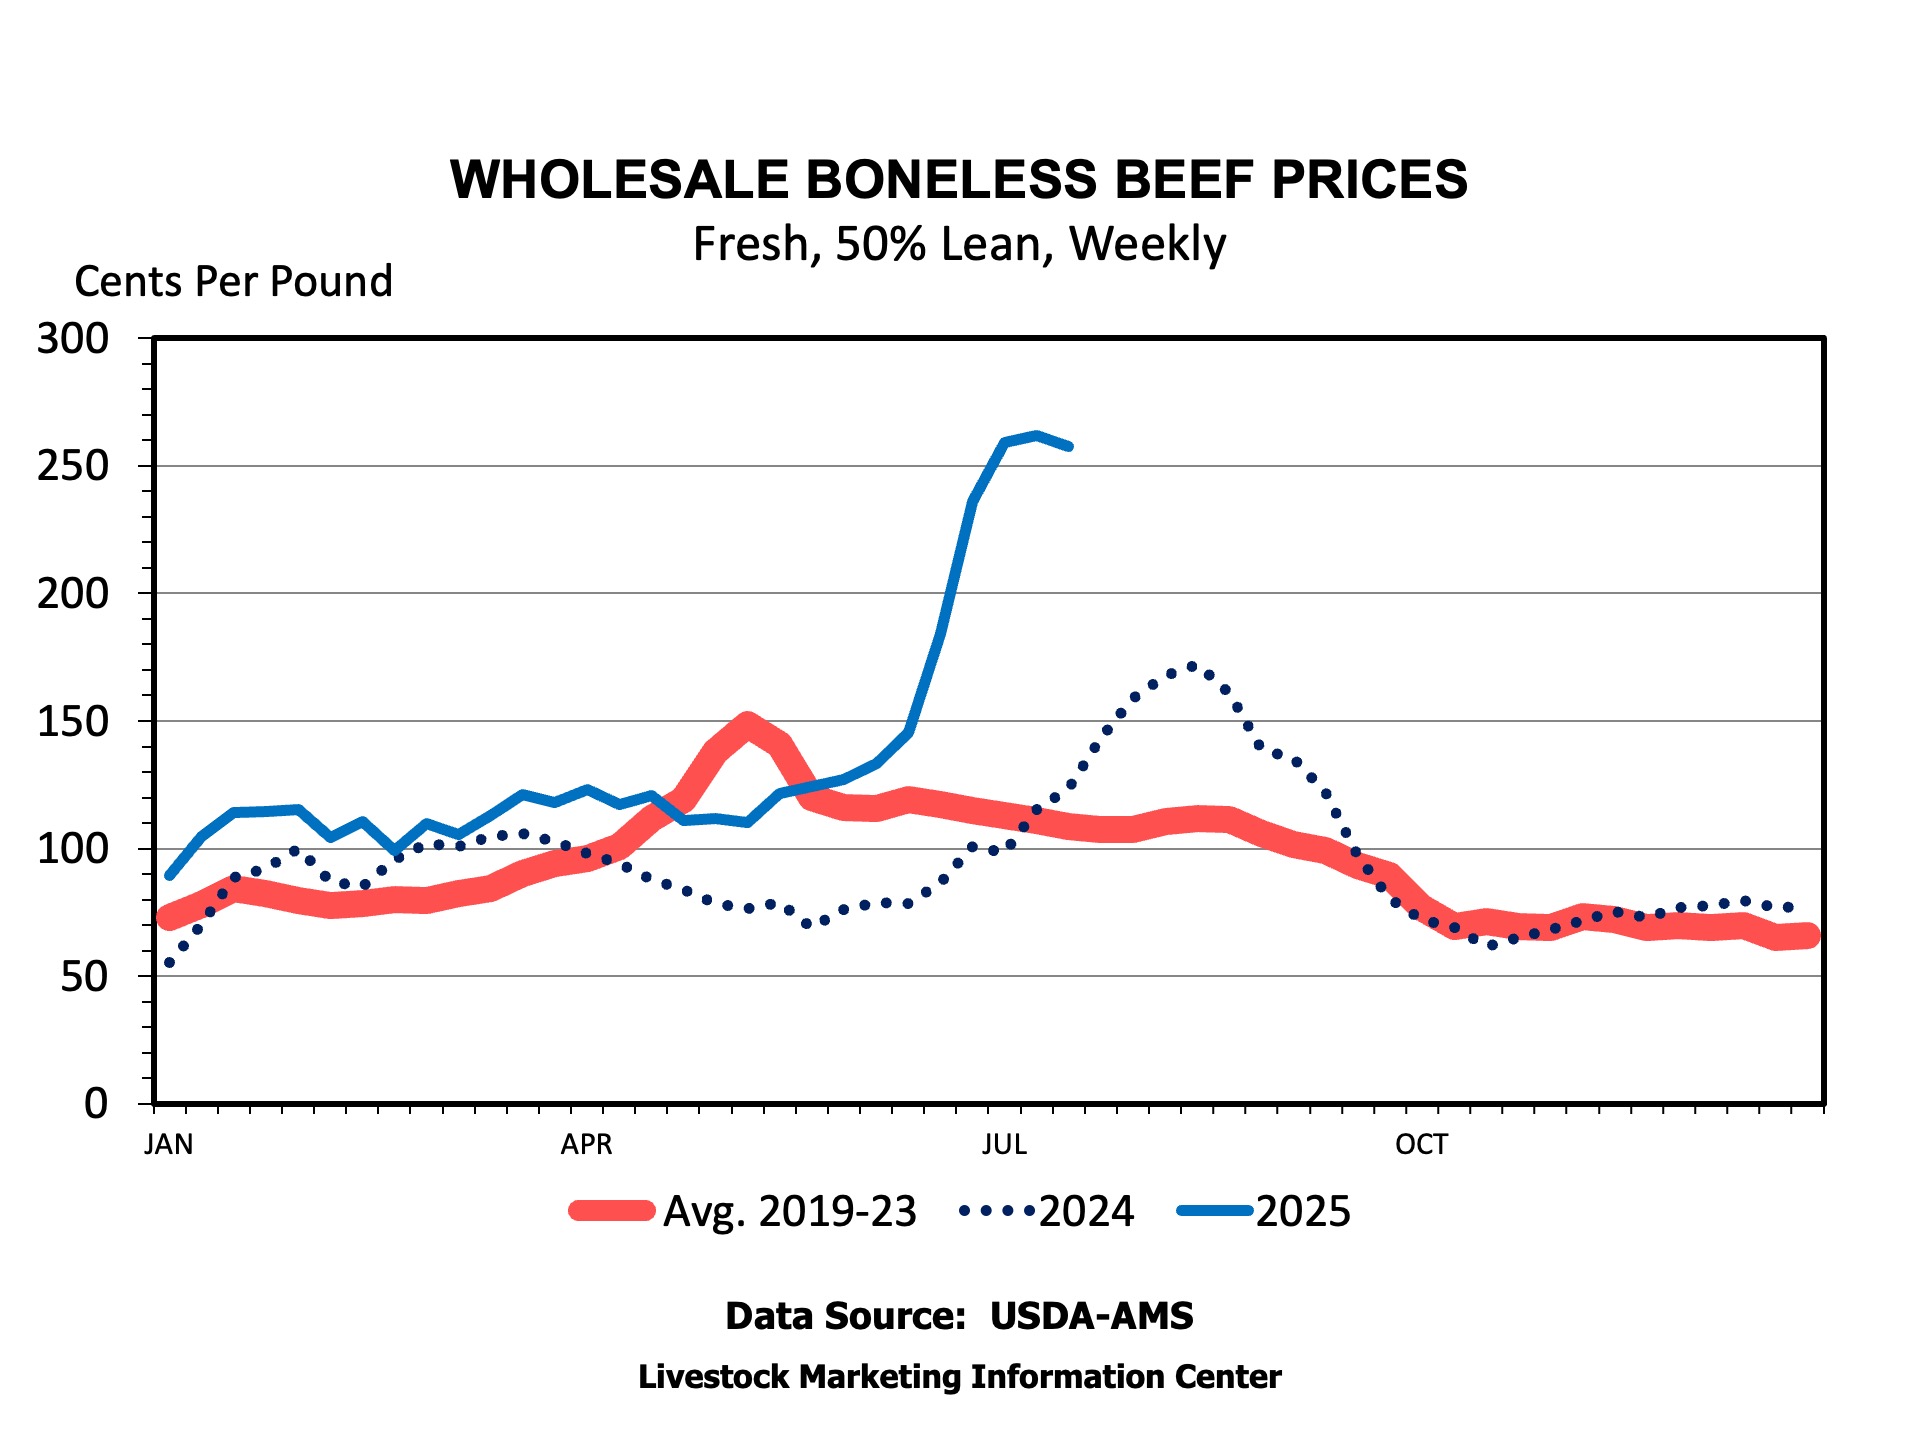
Wholesale 90 and 50 percent lean boneless beef prices continued to increase into July. The 50 percent lean price hit an all-time record of $2.62 per pound. Lean boneless beef is particularly impacted by fed beef supplies, which have been cut due to declining slaughter and seasonally lower weights. Boneless beef prices tend to decline seasonally after mid-year as we get past the grilling season rush in demand.
Seasonal price patterns would suggest that there is a chance for a little bit of relief from record high beef prices. But, only if we compare to the peak price this summer. Wholesale beef prices are already declining.
There is a time lag from lower wholesale prices showing up at retail, but lower wholesale prices combined with normal seasonality of various cut prices should lead to the expectation of falling prices in the coming months. But, it’s not likely that prices will decline below year ago levels.
A Preview
USDA will release the July Cattle on Feed report on Friday. While market analysts expect lower placements, marketings, and cattle in feedyards than a year ago, the really interesting number will be the number of heifers on feed on July 1. The heifers on feed will provide some insight into heifer retention. Also, look for placements in Texas due to the ban on Mexican feeder cattle. The lack of spayed heifers coming from Mexico is important in evaluating the number of heifers on feed.
Over the last few years, there has been a lot of discussion/questions surrounding the impact of Beef x Dairy (BxD) on the beef supply chain. Anecdotally, BxD calves have gone from day olds being worth $75/head in 2019, to well over $800/head today. Thus, BxD calves have led to increased revenue for dairy producers around the country. Given their worth, dairy producers have increased the amount of BxD offspring in their breeding program. The increase has been noticed by the beef industry and has led to the particular question, “How many head of Beef x Dairy calves are out there?”. This is a common question that has been asked at Extension meetings, and most recently, at the 2025 Beef Improvement Federation (BIF) in Amarillo, TX. While it may seem simple to answer, it is quite difficult to answer that simple question.
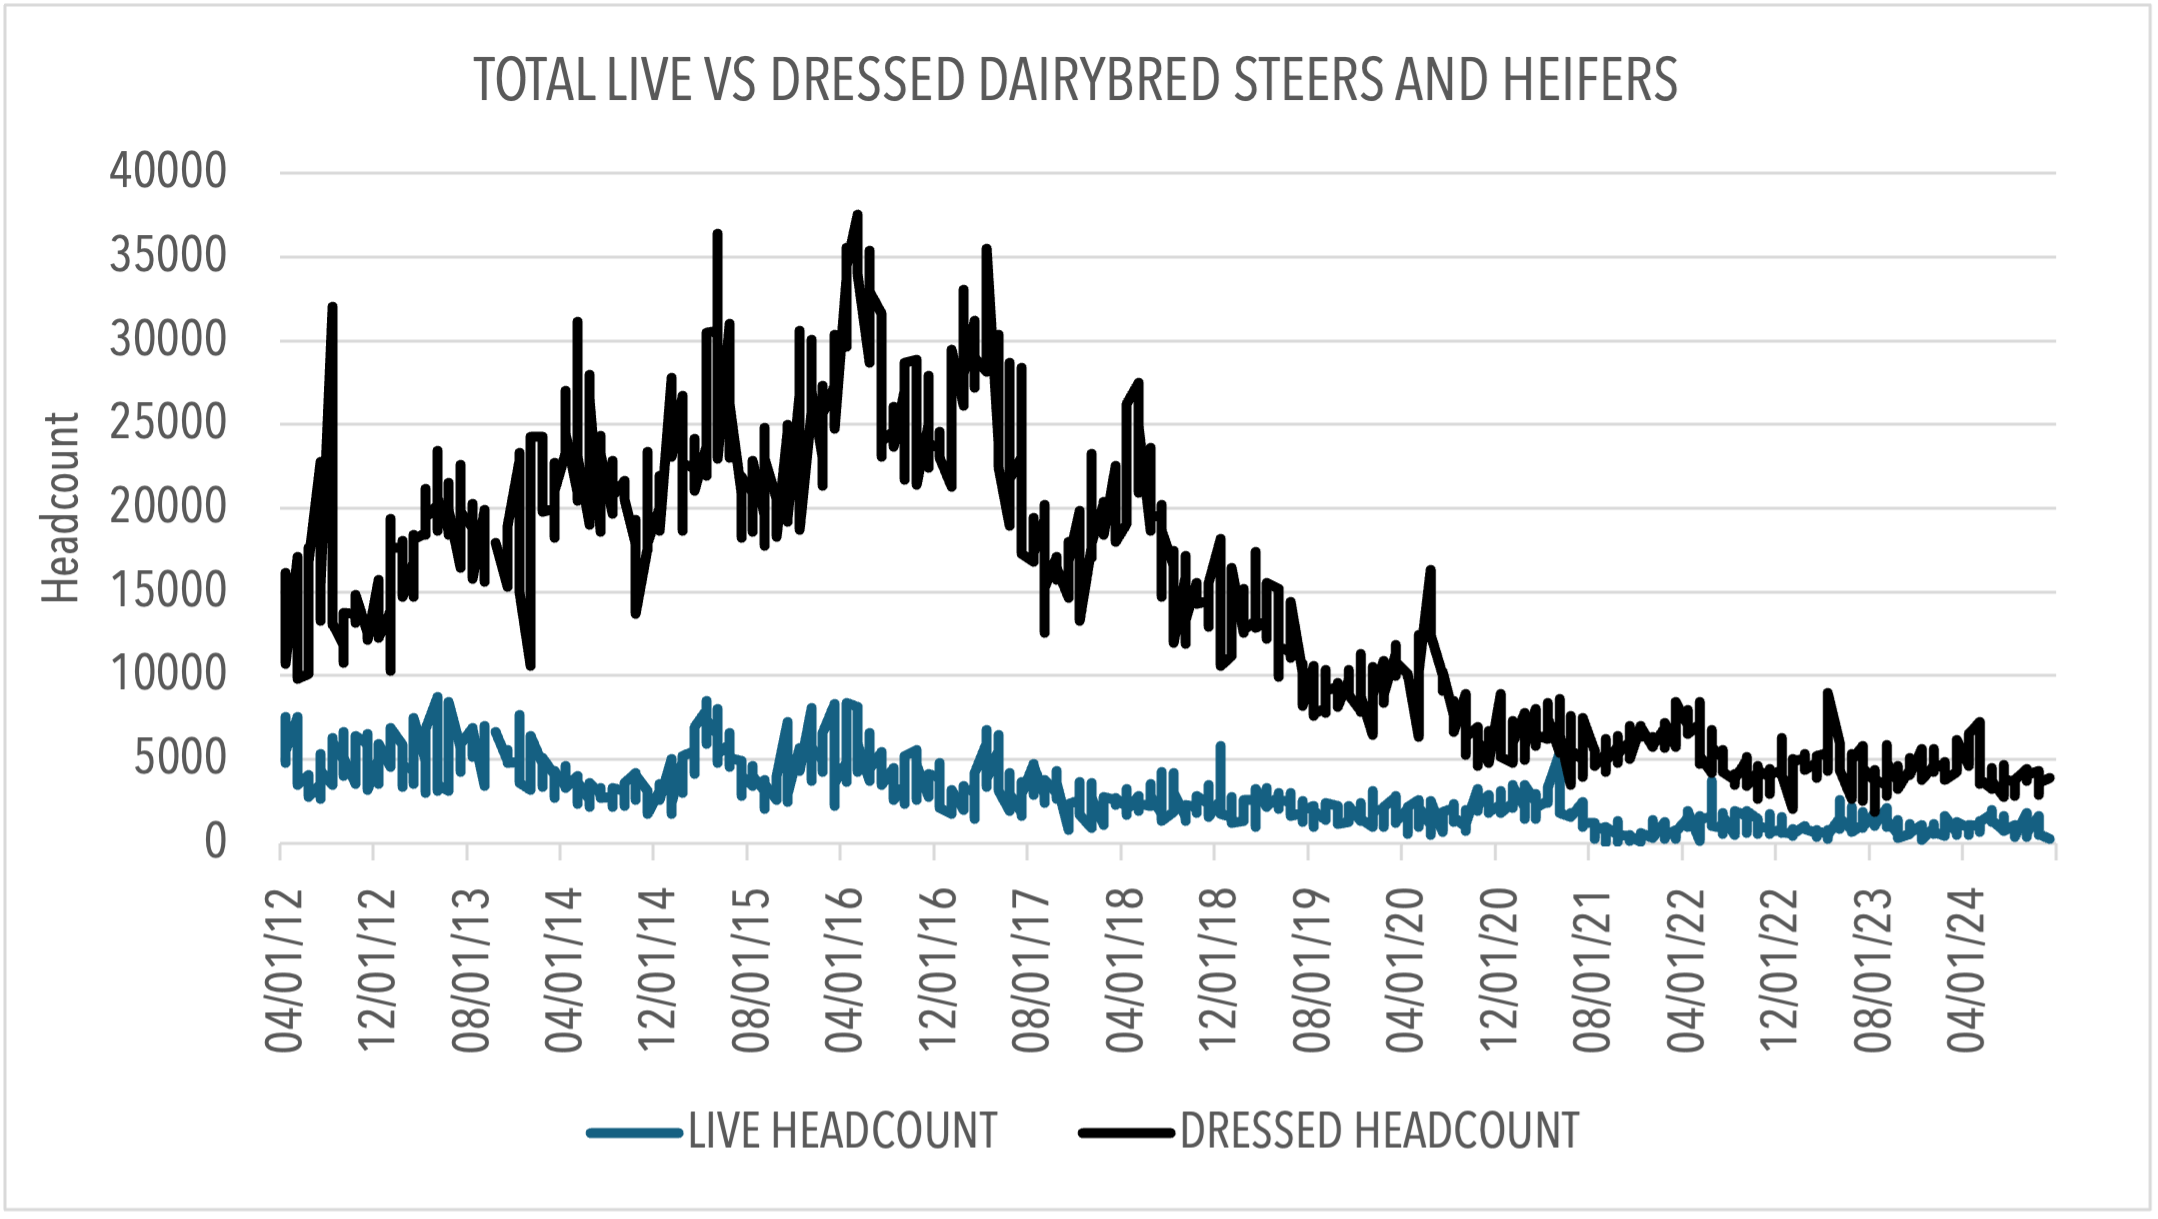
Historically (from 2001-2024), the dairy herd size has remained relatively constant at 9.2 million head. Annually, the dairy calf crop is utilized as either future replacement heifers, or they enter the beef supply chain. The ones that enter the beef supply chain are eventually harvested and marketed as fed cattle. The cattle that are straightbred dairy (majority dairy genetics) are reported by the USDA as “dairy” in the fed cattle reports. Figure 1 displays the weekly total live and dressed straightbred dairy fed cattle sales for the time frame April 2012-December 2024. The total number of straightbred dairy fed cattle peaked in May 2016. Since then, there has been a notable decrease in the total number of both live and dressed straightbred dairy in the fed cattle markets. The January 1 reports show that the difference is not due to dairy replacements. In 2016, dairy replacements were 4.81 million head and have since steadily decreased to 3.91 million head in the 2025 January 1 report. Given that the dairy calf crop has remained stable with the dairy herd, and the number of dairy replacements has not offset the decrease in straightbred dairy fed cattle, then the change in the calf crop must be BxD bred calves. With that in mind, that creates the starting point for calculating BxD estimation.
Figure 1. Weekly Total Live Vs Dressed Steers and Heifers Marketed as Straightbred Dairy in the U.S. From April 2012 through December 2024
In order to estimate the annual number of total BxD calves in a given year, we first estimate the calf crop and remove replacements by using a combination of that year and the following year’s January 1 reports. For example, to estimate the 2024 calf crop (minus replacements), we take the 2024 dairy cow inventory and subtract the 2025 dairy replacement inventory. We then adjust the calf crop estimate by subtracting the total number of cattle marketed as straightbred dairy (reported in the USDA Weekly 5 Market Area Report) for that given year (2024 in our example). This yields our estimate for the total number of BxD calves. It is important to note that we do not adjust the estimated number of possible BxD calves for calving rate and death loss. Thus, our estimate is the maximum amount of BxD calves possible. Table 1 displays BxD headcount estimates by year.
Table 1. Annual Beef x Dairy (BxD) Headcount Estimates
2016
2017
2018
2019
2020
2021
2022
2023
2024
2,879,077
3,239,703
3,695,863
4,058,416
4,296,389
4,824,271
4,975,405
5,046,508
5,178,194
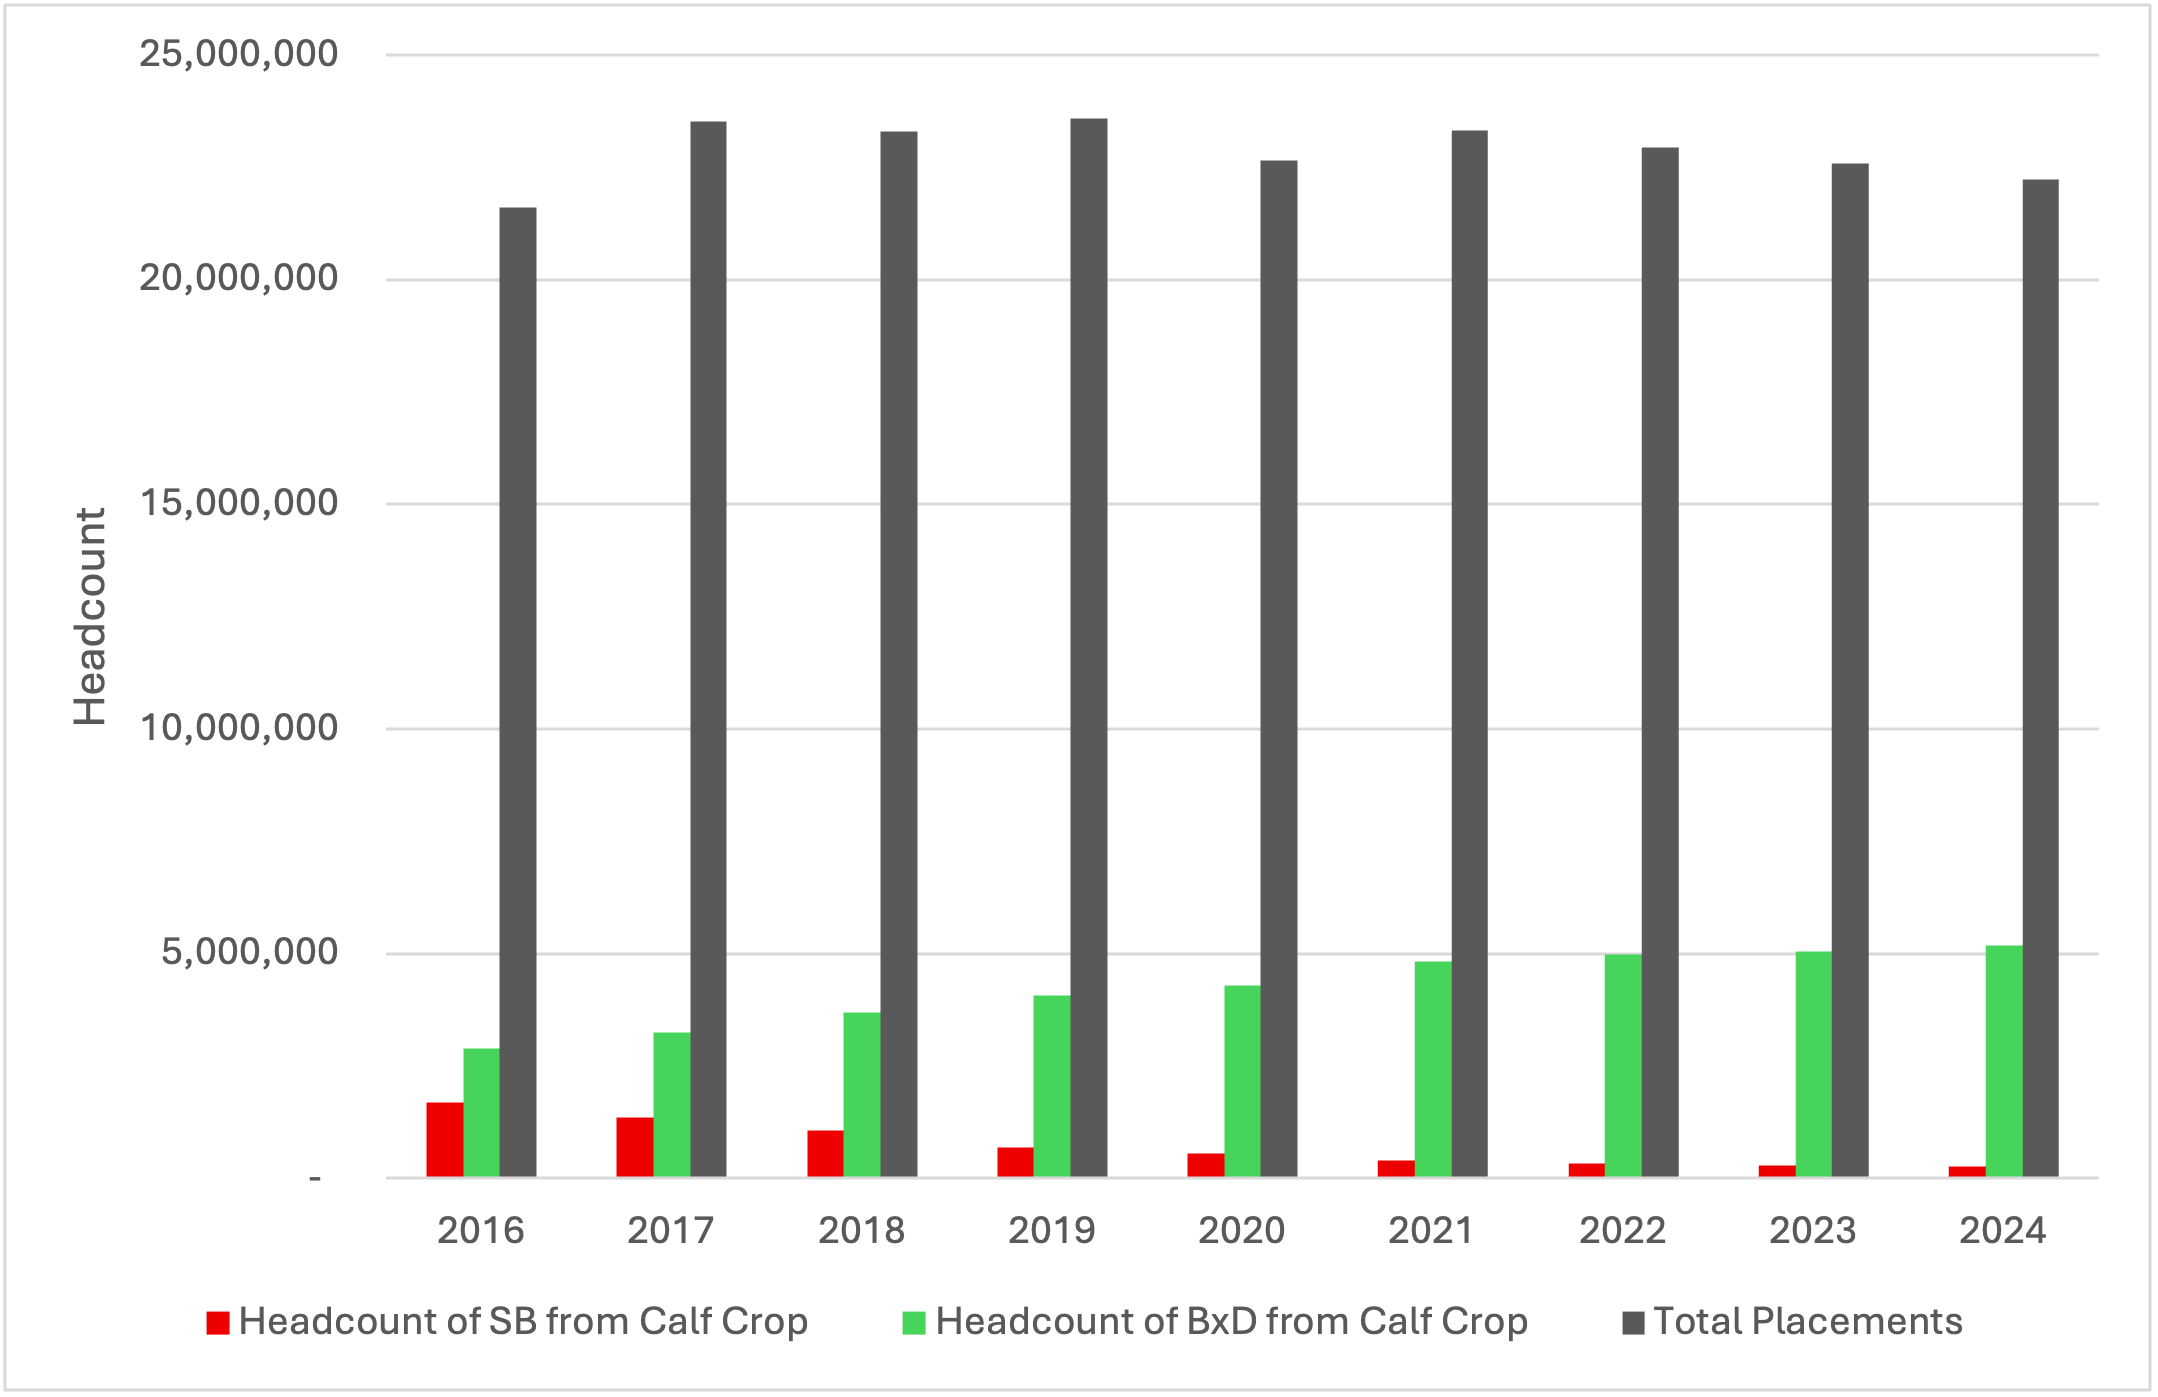
In 2016, maximum BxD headcount estimates were approximately 2.9 million. This number steadily rises to 5.2 million head in 2024. How do these estimates relate to total annual placements? By calculating annual placements from monthly Cattle On Feed reports, and comparing estimates in Table 1, we can estimate the maximum percentage of BxD calves placed in the feedyard annually. Figure 2 displays total annual number of straightbred (SB, red bars) and BxD (green bars) cattle relative to total placements (dark gray bars). While BxD placements have been increasing since 2016, the total number of placements has trended downward since 2021 due to a shrinking national beef herd. This has allowed for a steady increase in the percentage of placements being BxD cattle.
Figure 2. Annual Headcount for Straightbred (SB), Beef x Dairy (BxD), and Total Placements (2016-2024)
Table 2 displays the annual percent of placements that could have been BxD cattle. Current estimates show roughly 23% of the total calf crop in 2024 was available for beef on dairy. This number has increased from 13% in 2016.
Table 2. Annual Percent Estimates of Total Placements that are BxD Cattle
2016
2017
2018
2019
2020
2021
2022
2023
2024
13%
14%
16%
17%
19%
21%
22%
22%
23%
Given that the national beef herd has shown no signs of rebuilding, and that the number of BxD cattle has increased each year since 2016, we can expect the percentage of placements that are BxD cattle to remain at least steady, if not to increase in the coming years. Because of this expectation, it might be beneficial for fed cattle marketing reports to indicate if marketed cattle are BxD, instead of the current reporting of them as “beef” cattle. This would also make the question posed in the introduction much easier to answer in the future.