Category: Livestock Marketing

  • Hog Prices Hit 3-Year Highs

    Hog Prices Hit 3-Year Highs

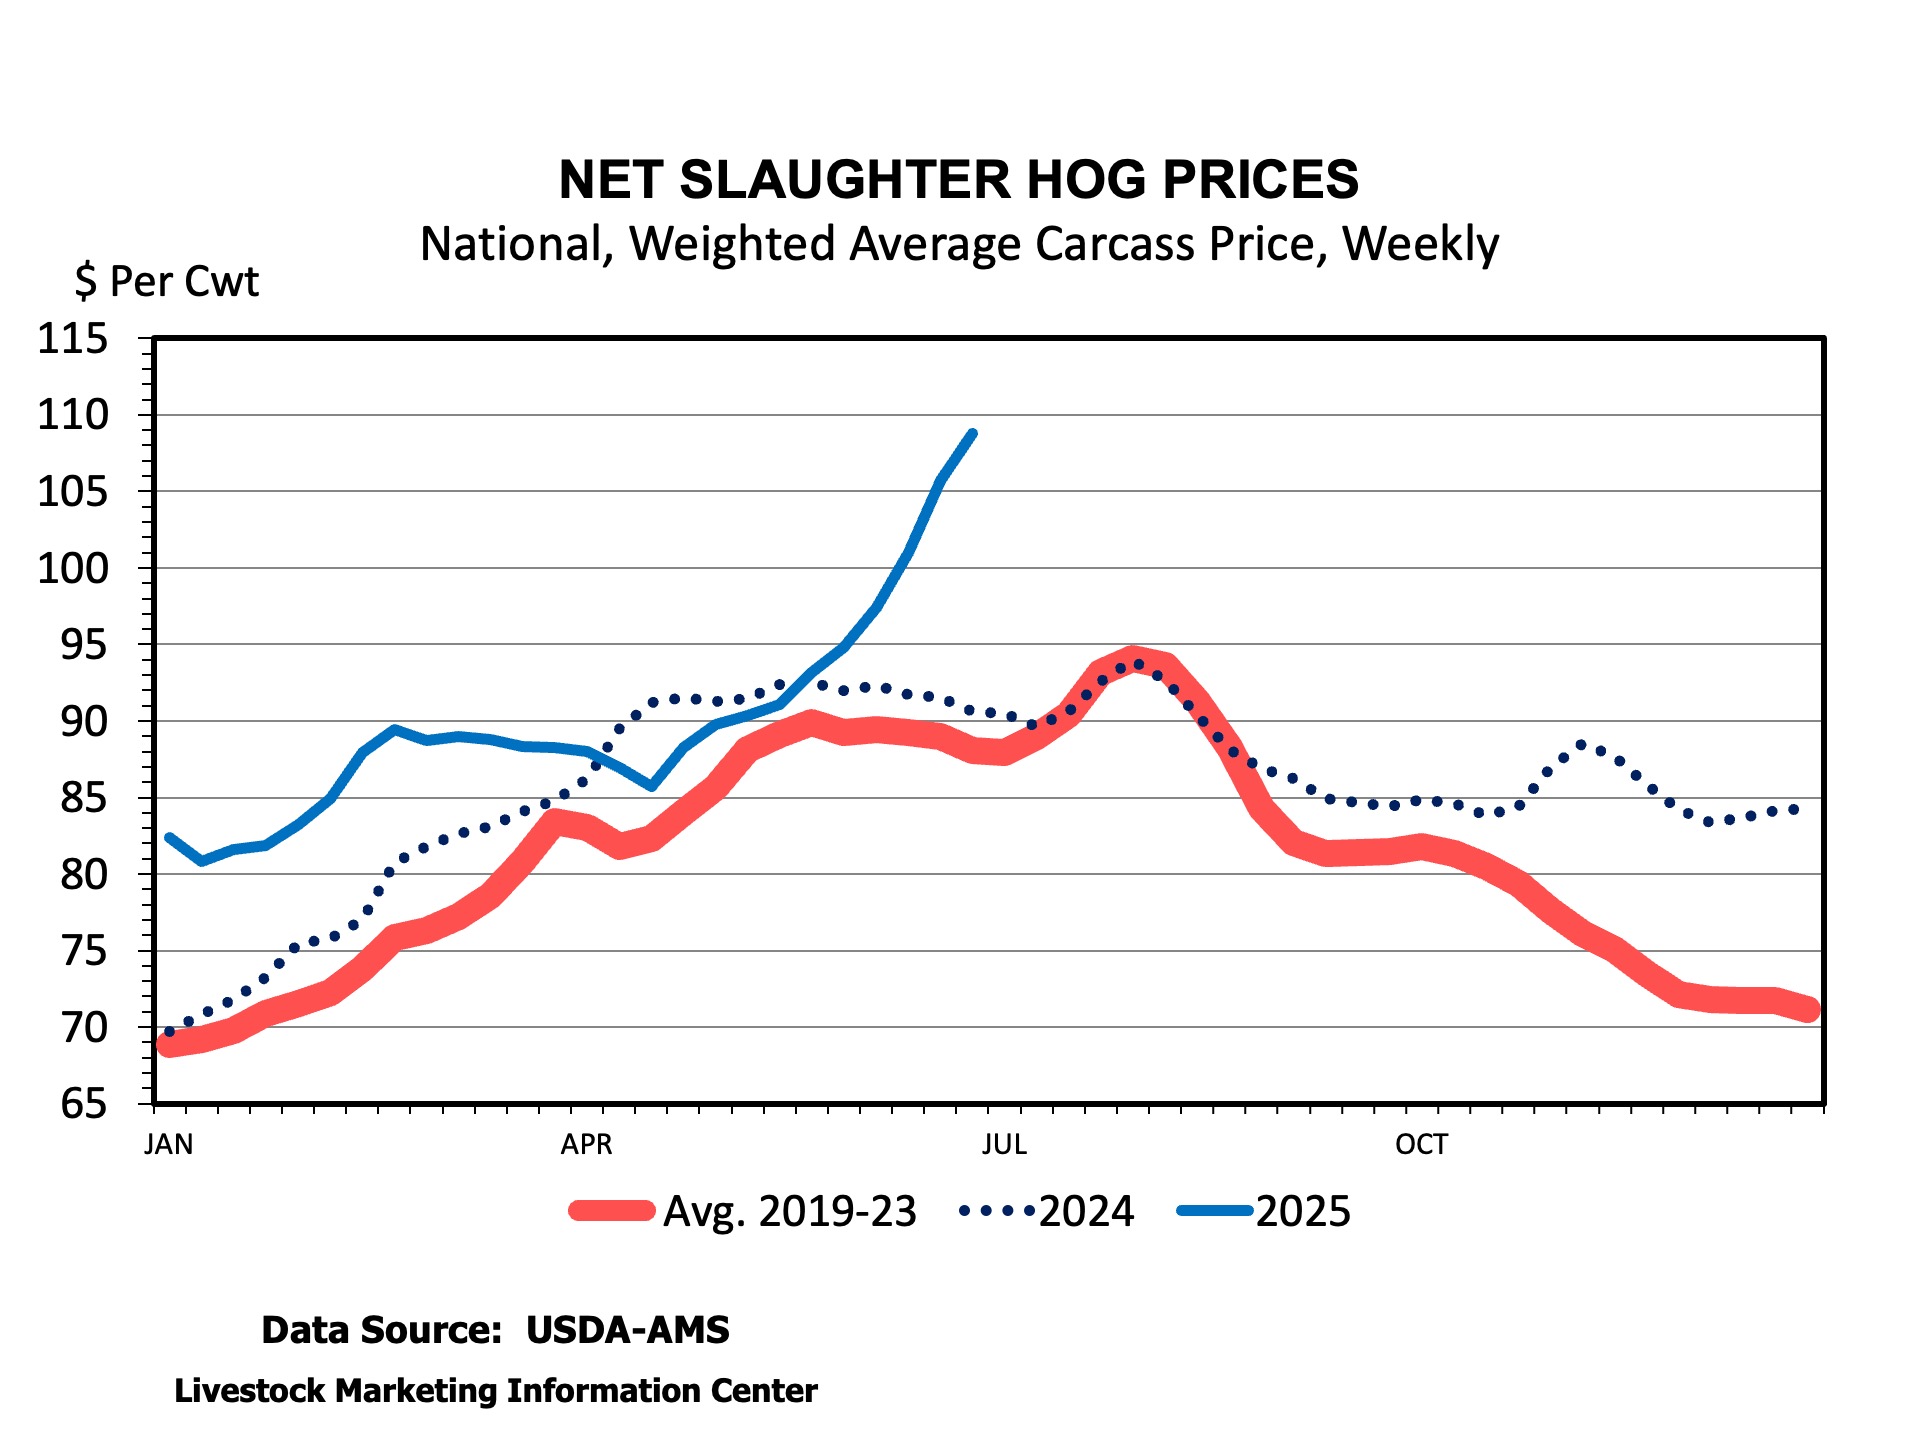
    We’ve written a lot in Southern Ag Today over the last couple of months on cattle and beef prices, but some other things are happening in livestock markets.  Hog prices have jumped to their highest level in three years, bringing some needed profits to the industry.  

    Weekly national average barrow and gilt carcass prices, net of premiums and discounts, hit $113.14 per cwt at the end of June.  That was the highest price since the beginning of September 2022.  The average price a year ago was $88.79 per cwt.  Higher hog prices are showing up in higher wholesale pork prices, as well.  Wholesale hams, pork bellies, loins, ribs, and trimmings for sausage have all been increasing in price in recent weeks.  

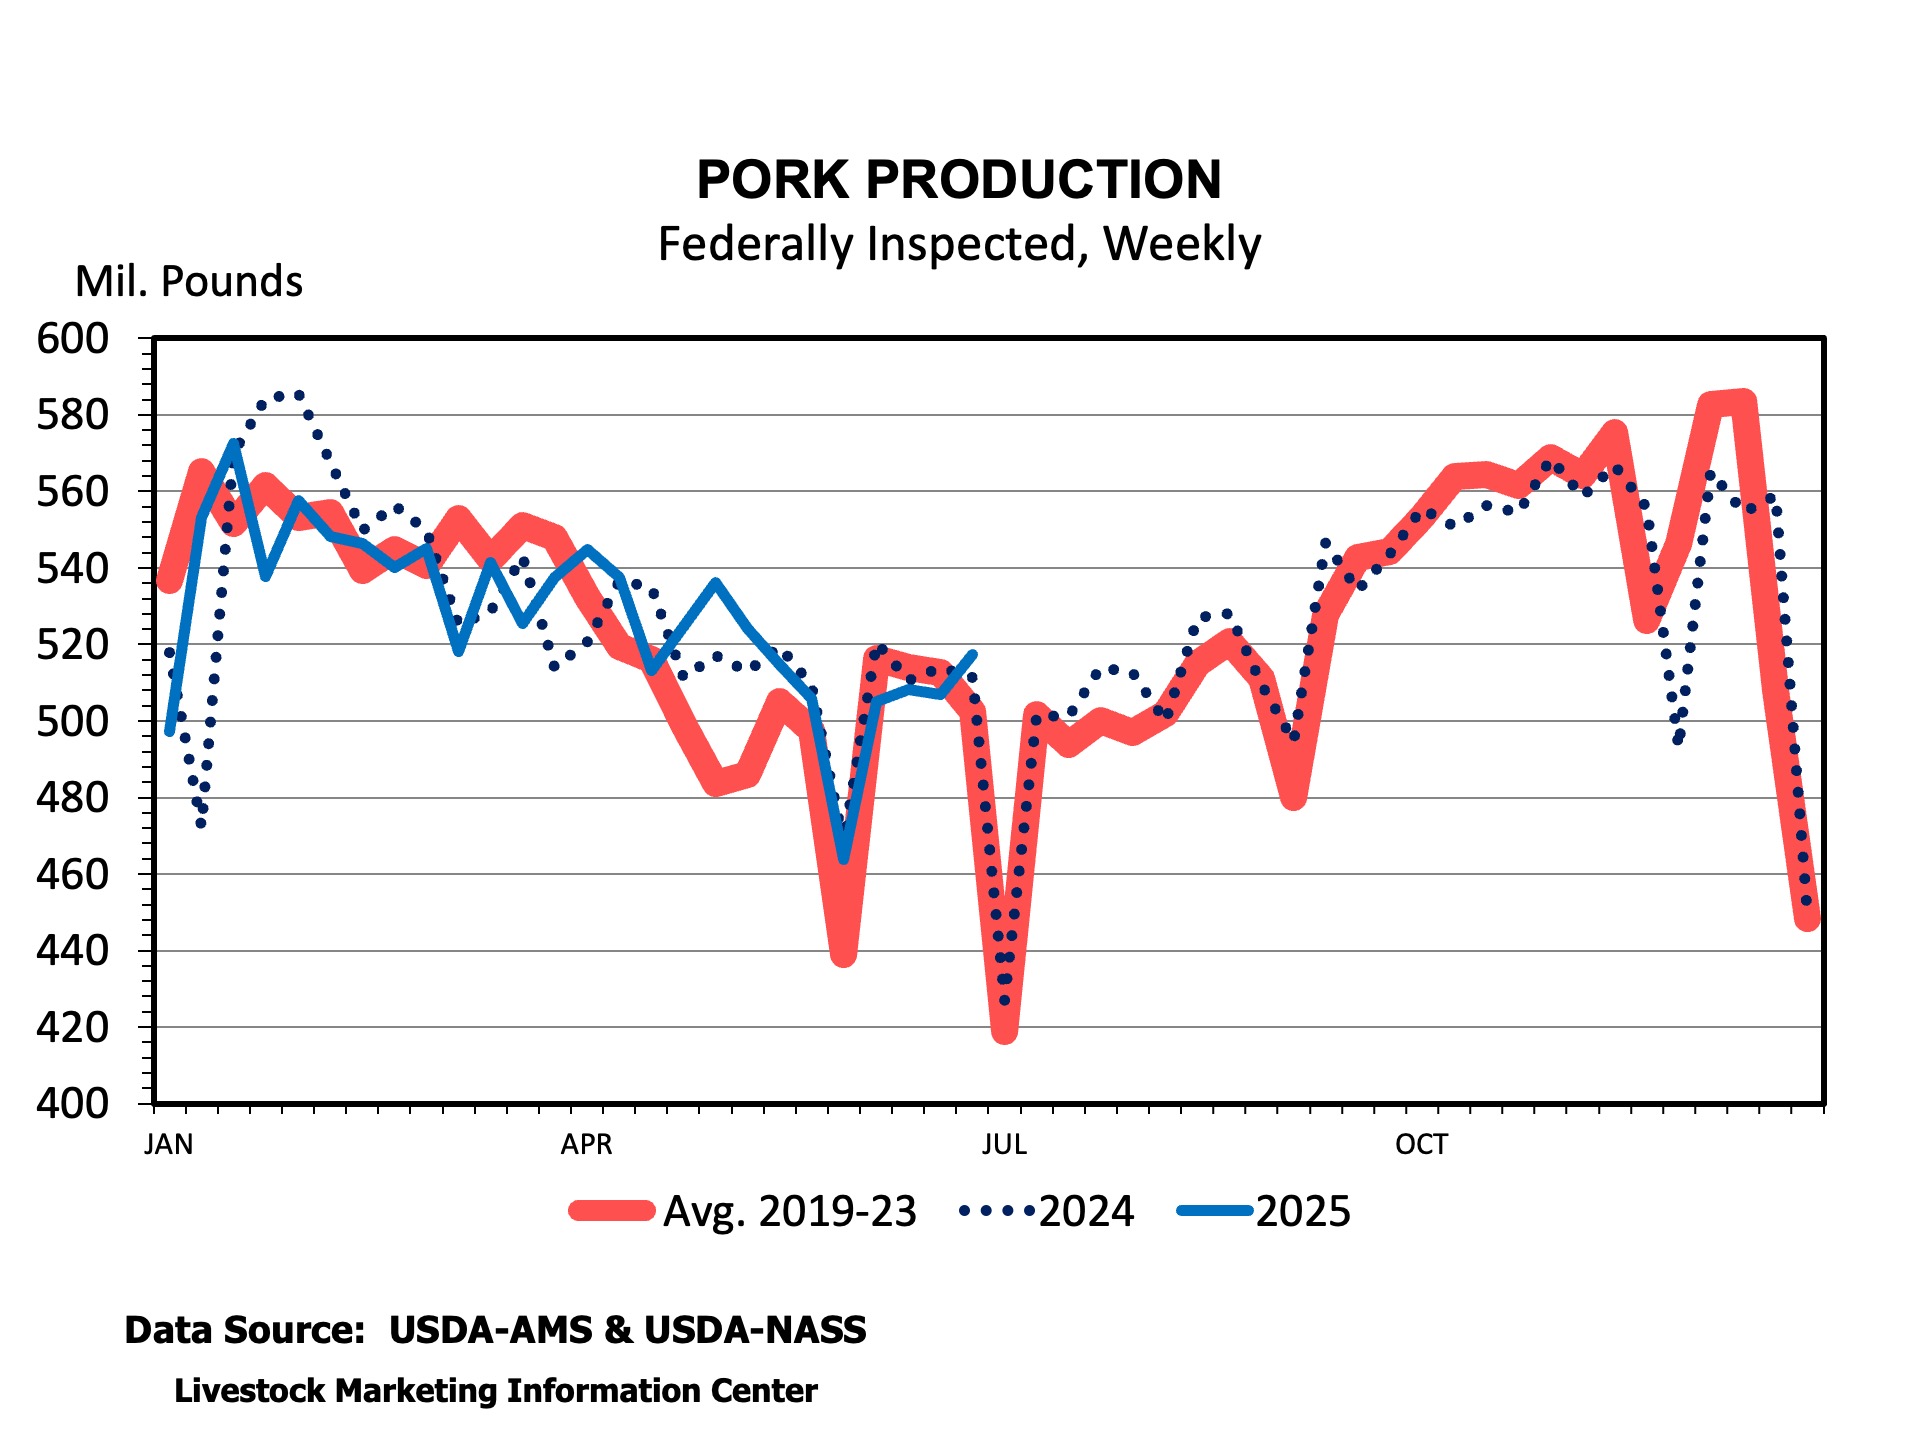
    Hog and pork prices tend to increase seasonally during the Summer due to reduced production during summer months.  Over the last 8 weeks, barrow and gilt slaughter is about 2 percent less than last year.  Total pork production is down 0.7 percent over the last 8 weeks compared to last year.  To get an idea of the seasonal decline in pork production this year, weekly production averaged 507.5 million pounds in June compared to 555.3 million pounds per week in January.  That seasonal decline is not unusual compared to past years.

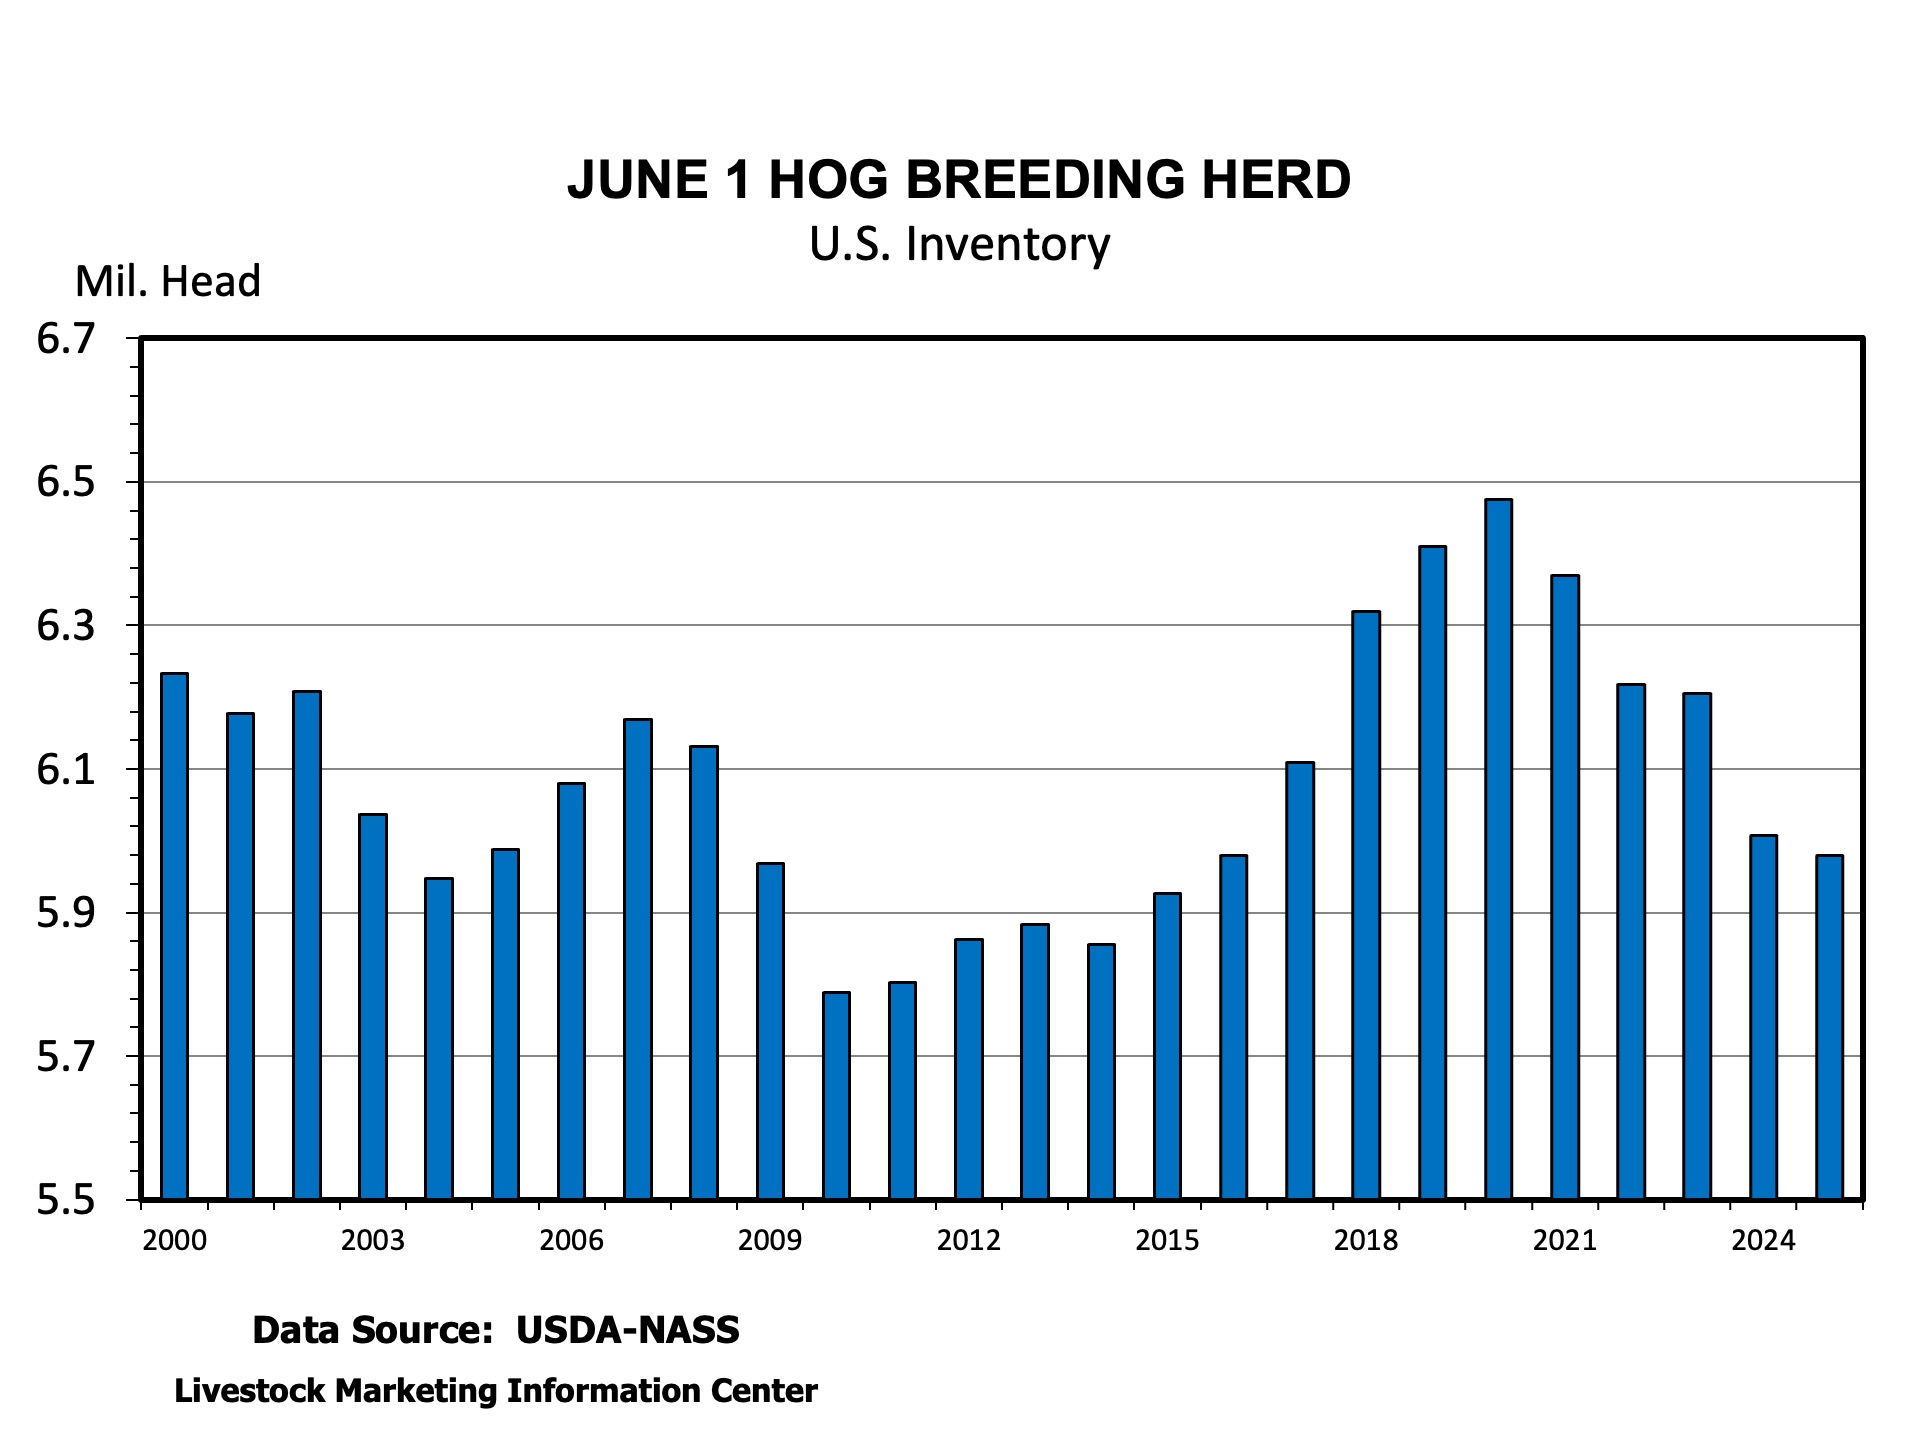
    The price increase, especially when combined with lower feed costs, has brought some much needed profits to the production side of the industry.  The industry has been largely treading water over the last year following large financial losses from 2022 into early 2024.  Small profits have kept the sow herd declining in number, down to 5.979 million sows on June 1, 2025, the fewest since 2016.  While the sow herd has been declining, the number of pigs saved per litter has continued to climb, hitting a record 11.7 pigs per litter over the last 6 months.  

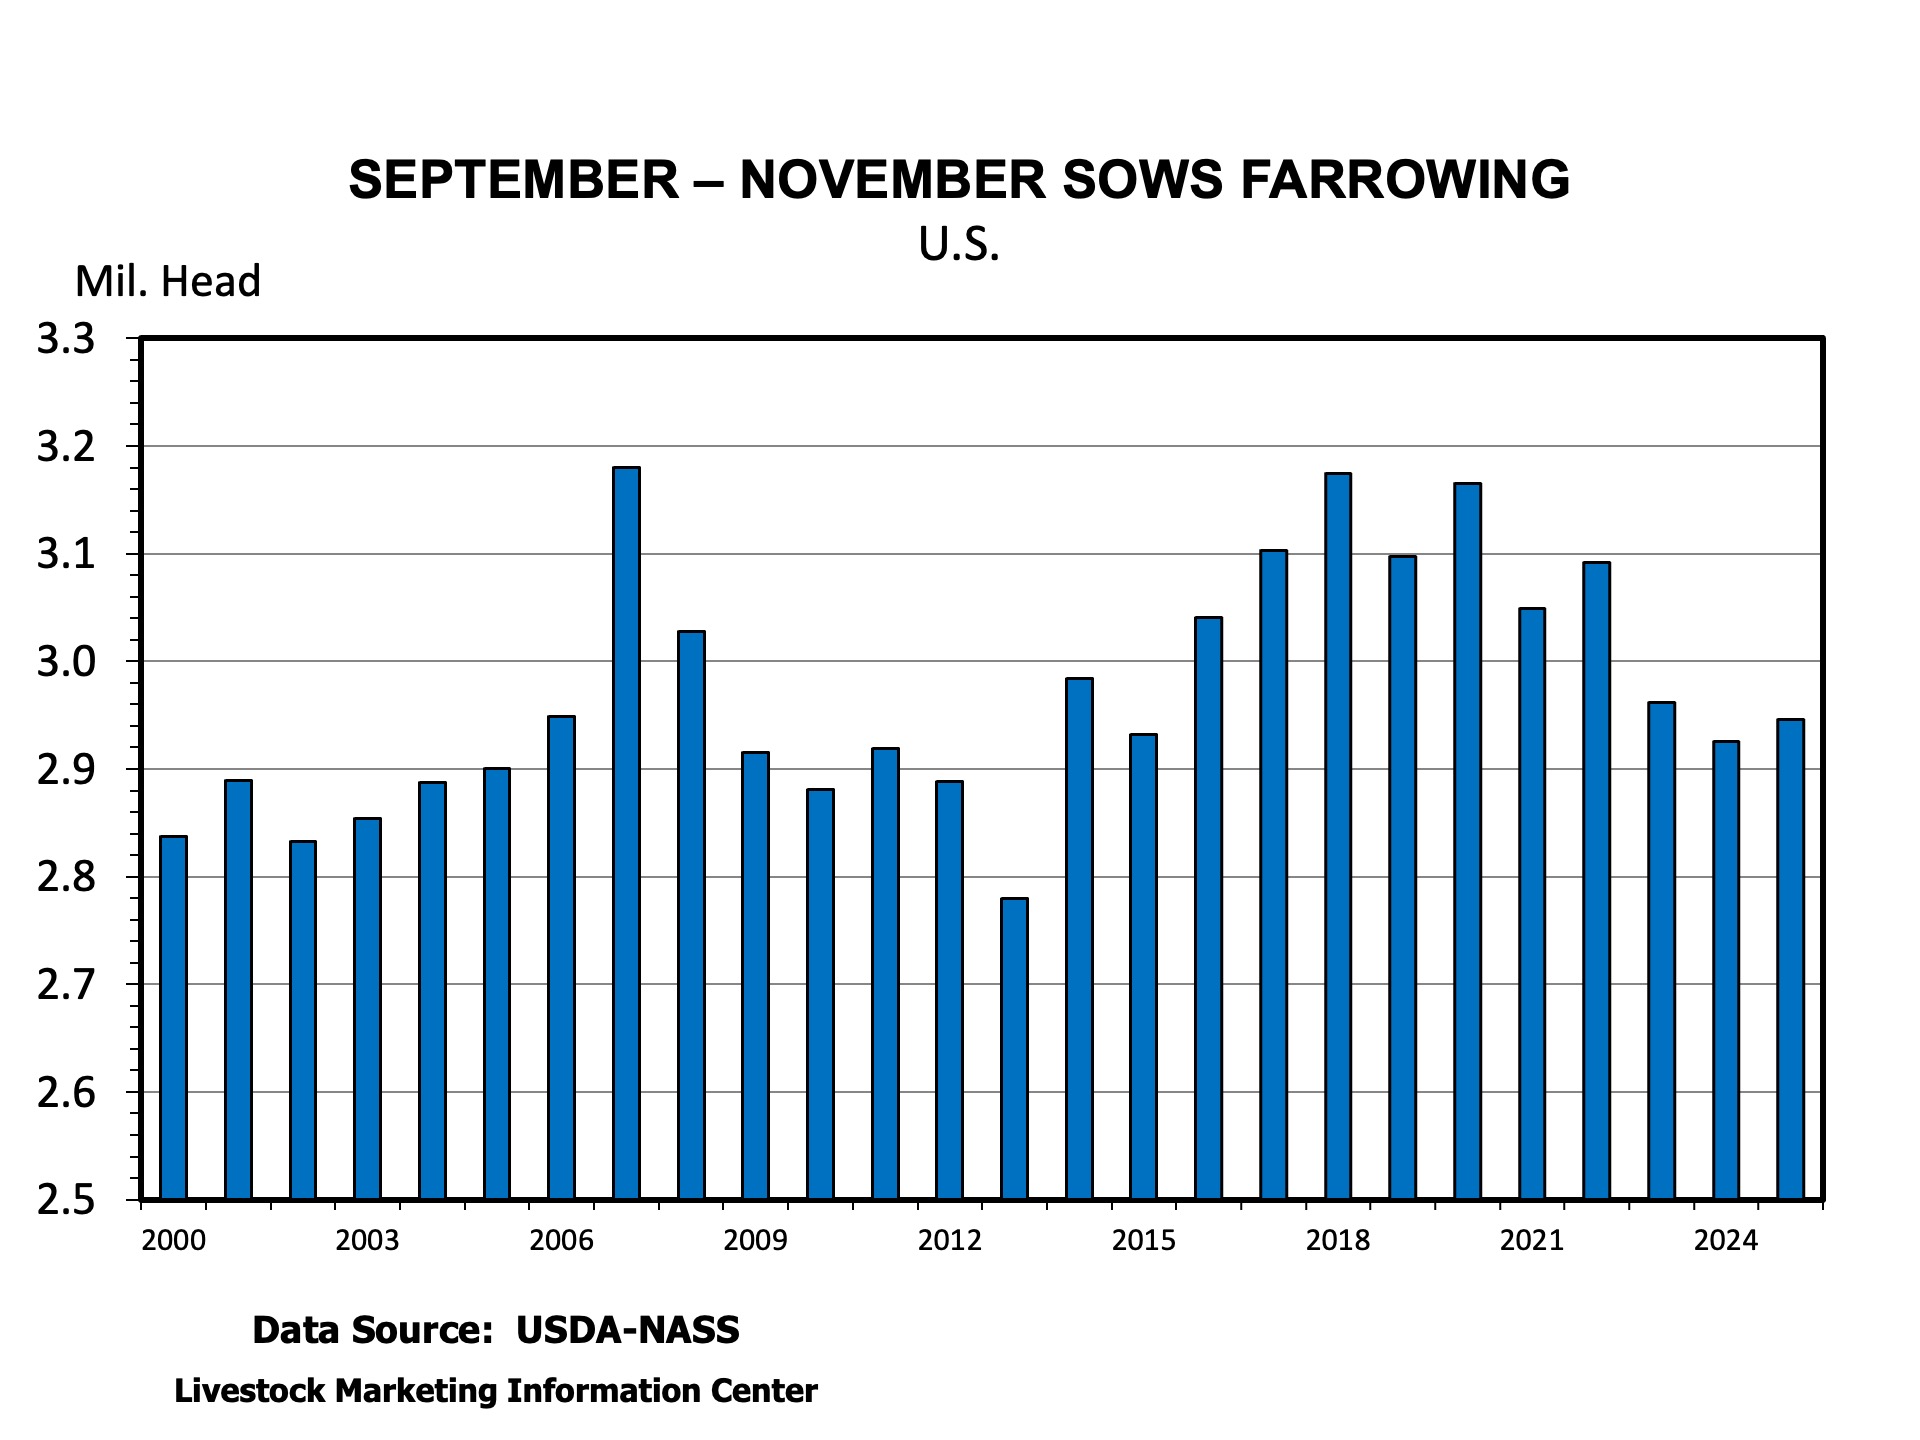
    It appears that higher prices and profits will work their magic to spur a production increase in 2026.  Hog producers reported in the USDA’s June Hogs and Pigs report to increase their intended number of sows farrowing in the last quarter of 2025.  Increased sows farrowing combined with more pigs per litter should boost production in the first half of 2026.  


    Anderson, David. “Hog Prices Hit 3-Year Highs.Southern Ag Today 5(28.2). July 8, 2025. Permalink

  • Beef Slaughter Capacity Utilization

    Beef Slaughter Capacity Utilization

    In recent months, there have been Southern Ag Today articles discussing the impacts of tight fed cattle supplies on prices, cattle on feed, slaughter weights, and total beef production (Anderson 2025a, Anderson 2025b, Maples 2025). Each of the articles mentioned has highlighted the unique and historical differences between the current market and years past. One aspect that has not been covered, but is important, is slaughter capacity utilization (CU). In Martinez et al. (2023), we show how we measure slaughter capacity utilization, which measures the ratio of operational cattle slaughter capacity over physical capacity. Figure 1 displays the monthly national federally inspected (FI) slaughter capacity utilization. 

    Figure 1. Monthly National Federally Inspected Slaughter Capacity Utilization

    In May, slaughter capacity utilization averaged 82%, which was lower than May 2024 (88.29%), and the previous 5-year average (87.56%). Additionally, through the first five months of 2025, capacity utilization averaged 84.57%, which is lower than the same time frame last year (86.64%), and the previous 5-year average (88.57%). Historically, in March and April, the ramp up of slaughter for grilling season occurs, followed by a decrease for 1 to 2 months. Thus, the decrease this year from March (86.06%) to May was expected. 

    While May’s utilization is down 8.29% compared to May 2024, commercial beef production (figure 2) in May was down 7.53% compared to May 2024 and down 4.67% compared to the previous 5-year average. Through May, total commercial production is averaging 497.8 million pounds per month, which is also lower when compared to 2024 (504.95 million pounds per month) and the previous 5-year average (513.12 million pounds per month). When comparing total production, 2025 production is 1.33% lower than last year and 2.98% lower than the previous 5-year average.

    Figure 2. Monthly National Commercial Beef Production

    Overall, the decline in 2025 capacity utilization compared to last year (down 2.07%) and the previous 5-year average (down 4%) is larger than the decline in total production compared to last year (down 1.33%) and the previous 5-year average (down 2.98%). Therefore, the increasing utilization difference between 2024 and 2025 signals the impact and realization of the tight supplies on capacity utilization. However, the supply chain is offsetting the tight supplies with larger carcasses and has led to market signals to have lower discounts for heavier cattle while operating at lower capacity utilization. As we get into the second half of the year, it will be interesting to see where capacity utilization and slaughter weights measure given even tighter supplies based on the latest Cattle on Feed reports. 

    References

    Anderson, David. “Fewer Marketings, Tighter Beef Supplies.” Southern Ag Today 5(26.2). June 24, 2025. 

    Anderson, David. “Working Less on Friday!” Southern Ag Today 5(21.2). May 20, 2025.

    Maples, Josh. “Cattle Prices Hit New Highs and Carcass Grading Trends Over Time.” Southern Ag Today 5(19.2). May 6, 2025.

    Martinez, C., Li, P., Boyer, C. N., Yu, T. E., & Maples, J. G. (2023). Beef price spread relationship with processing capacity utilization. Journal of the Agricultural and Applied Economics Association.https://onlinelibrary.wiley.com/doi/full/10.1002/jaa2.48

  • Fewer Marketings, Tighter Beef Supplies

    Fewer Marketings, Tighter Beef Supplies

    USDA released the latest Cattle on Feed report amid record high cattle and beef prices.  While the report did not have any big surprises compared to analyst’s pre-report estimates there were some noteworthy data points.  Marketings were 10.1 percent fewer in May 2025 than last May.  Some of that was attributable to one less working day in the month, but the rest was due to fewer fed cattle slaughtered.  An earlier SAT discussed fewer fed cattle being processed on Fridays over the last couple of months.  

    Fewer cattle were placed into feedyards in May, with placements 7.8 percent below last year.  But, placements in Texas and Oklahoma feedyards were down 16.8 and 21.6 percent compared to last year, likely reflecting the continued border closing restricting the supply of Mexican feeder cattle.  Fewer placements and marketing left the total number of cattle on feed down 1.2 percent compared to last year.  

    Fewer cattle marketed from feedlots means reduced fed cattle slaughter and beef production.  Beef production over the last 8 weeks has been 5.5 percent below the same period last year.  A smaller percentage of the beef graded has been grading Choice indicating tighter supplies of Choice beef in addition to lower overall supplies.  While a lot has been made of continued good demand for beef pushing prices higher, certainly reduced supplies are helping higher prices too.

    On the price side, the Choice cutout surged to $390 per cwt on Friday June 20th.  That was a record except for May 2020.  All of the Choice primal cuts have been racing higher except for the rib which has been declining, as it often does this time of the year.  Of note, just as Texas Monthly’s Top 50 BBQ joints edition hit the mailbox primal Choice briskets kept climbing to almost $3.40 per pound.  This would be a record brisket price except for May 2020 when the pandemic closed packing plants and a surge of buying depleted supplies.  

    While not one of the primals that make up the boxed beef cutout value, 50 percent lean beef has skyrocketed in value to almost $190 per cwt, compared to about $1.00 per pound last year.  This beef is largely the product of fed cattle and makes up part of the supplies of ground beef.  Fewer fed cattle marketed and slaughtered in recent weeks has likely cut into supplies while the demand for ground beef remains good.  

    The marketings side of the cattle on feed report highlights today’s tight supplies of cattle and beef.  Reduced production is part of the story of record beef prices.


    Anderson, David. “Fewer Marketings, Tighter Beef Supplies.” Southern Ag Today 5(26.2). June 24, 2025. Permalink

  • Cattle and Beef Prices Push Higher

    Cattle and Beef Prices Push Higher

    Cattle prices have continued to push higher over the past few months. Auction prices for feeder steers are up 5 to 10 percent since mid-April, depending on location. Live steer prices averaged $238.68 last week – another record and 13 percent above mid-April prices. Prices across feeder cattle and live cattle are 20 to 25 percent above year-ago levels. 

    Beef values are also pushing higher. The Choice boxed beef cutout value was $382.11 per cwt on Monday, June 16. This is a 19 percent increase above year-ago levels. The weekly choice cutout has been increasing each week since mid-April. The continued weekly increases have already pushed past when many would normally expect the seasonal peak to occur ahead of summer grilling season. For reference, the only other time the cutout has been higher than $380 per cwt was a COVID-driven three-week period during May 2020. The chart above shows the cutout value over the past 5 and ½ years. The considerable increases in the loin and brisket are noteworthy. 

    Looking at the primal level, the increases vary. The rib primal value was $538.29 (up 10 percent from a year ago), chuck value up 21 percent (to $316.32), round value up 20 percent ($311.73), loin value up 19 percent ($541.41), brisket value up 30 percent ($324.36), short plate up 29 percent ($270.75), and flank up 26 percent ($211.57).  Each of these changes show how important the markets for individual primal (and cuts) are to the overall carcass and animal value. 

    Tight supplies of cattle and beef are supporting record high prices. It has been particularly interesting this year to see these continued increases in the cutout value push into June. April and May are the more common months for the choice cutout to peak, although the past few years have differed. In 2024, the choice cutout peaked the first week of July, and in 2023 it peaked in mid-June. 2025 is shaping up to be more similar to the past two years. 


    Maples, Josh. “Cattle and Beef Prices Push Higher.” Southern Ag Today 5(25.2). June 17, 2025. Permalink

  • A Little More Insight on Meat Trade 

    A Little More Insight on Meat Trade 

    Over the last 2 months, the rapidly changing tariff environment has had livestock market analysts anxiously awaiting USDA trade data releases.  The latest monthly trade data from the USDA was published on June 6th.  It included meat and livestock exports and imports for April 2025.
     
    Trade is interesting because of all the moving parts.  Tariffs are only a part of the story.  Domestic production impacts prices, creating incentives to import or export.  For example, record high beef prices creates an incentive to import more beef and export less.  Relative prices between countries, exchange rates, shipping costs and availability, and other countries’ actions may impact trade, overwhelming the effect of a new tariff.  
     
    U.S. companies exported 237 million pounds of beef in April, an 18.5 million pound decline from March and 22.3 million pounds less than April 2024.  Exports to China declined the most, down 27.7 million pounds, or 34 percent, compared to March.  The impact of China on total U.S. beef exports was partially offset by larger exports to Japan, South Korea, and Hong Kong.  It’s not unusual for beef exports to decline from March to April.  On the pork side, exports declined 58 million pounds, or 9 percent, from March, and 73 million pounds less than April 2024.  Shipments to most markets declined, led by Canada, Mexico, and China.  The decline in pork exports to Canada accounted for 41 percent of the total export reduction from March.
     
    Beef imports declined in April compared to March, down 27 million pounds.  As with exports, it’s normal for imports to decline from March to April.  Fewer imports came from Canada, Mexico, New Zealand, and Uruguay.  Imports jumped 17.8 million pounds, 17 percent, from Brazil.  The increase in imports from Brazil bucked the usual trend of declining imports after January.  
     
    Lamb imports have been a very contentious issue for the industry for many years.  The imposition of tariffs on Australian and New Zealand imports, which make up 99 percent of U.S. lamb imports, has had industry backers and detractors.  Imports in April were 5 percent larger than those in March and 10 percent larger than those in April 2024.  Some other factors are clearly at work in the lamb market, and it may take more time to see any impacts of tariffs that were imposed in early April.
     
    The April trade data gives us an early glimpse at the impacts of tariffs on meat trade.  The May data may give us a better look at impacts because that will better account for shipping time lags for some markets.  Clearly, the very large tariffs between the U.S. and China did impact that transaction.  Other markets with smaller tariff levels may not reveal large changes yet.


    Anderson, David. “A Little More Insight on Meat Trade.Southern Ag Today 5(24.2). June 10, 2025. Permalink