It’s often said that everything is sold from cattle and hogs except the moo and oink. These products include all the variety meats, hides, tendons, and anything else. One category of these products that has been increasing in value is tallow, grease, and lard. These can be edible or inedible. Several factors have been important in increasing their values. One is the renewable fuel market. The increased demand for used cooking oil and animal fats to meet renewable standards has boosted prices. On the edible side, recent trends in deep-frying foods and French fries in beef tallow have further boosted demand. And it’s hard to make good biscuits or tamales without lard.
USDA reports weekly prices for several types of these fats. As you might expect for these types of products, prices are often not reported every week. But what is reported can give us some insight into added values to cattle and hogs.
Edible tallow, delivered to Chicago, was $58 per cwt for the week ending May 2nd compared to $49 per cwt the same week in 2024. For the year-to-date, edible tallow has averaged $54.65 per cwt versus $51.82 per cwt last year. While prices are generally higher than last year, tallow prices hit $92 per cwt in September of 2022. A decade ago, edible tallow was about $30 per cwt.
Choice, inedible white grease hit its high price for the year, $51 per cwt, in April. It was $39 per cwt in April 2024. Bleachable, inedible tallows have seen similar price increases compared to last year. A decade ago, these products were about $26 per cwt.
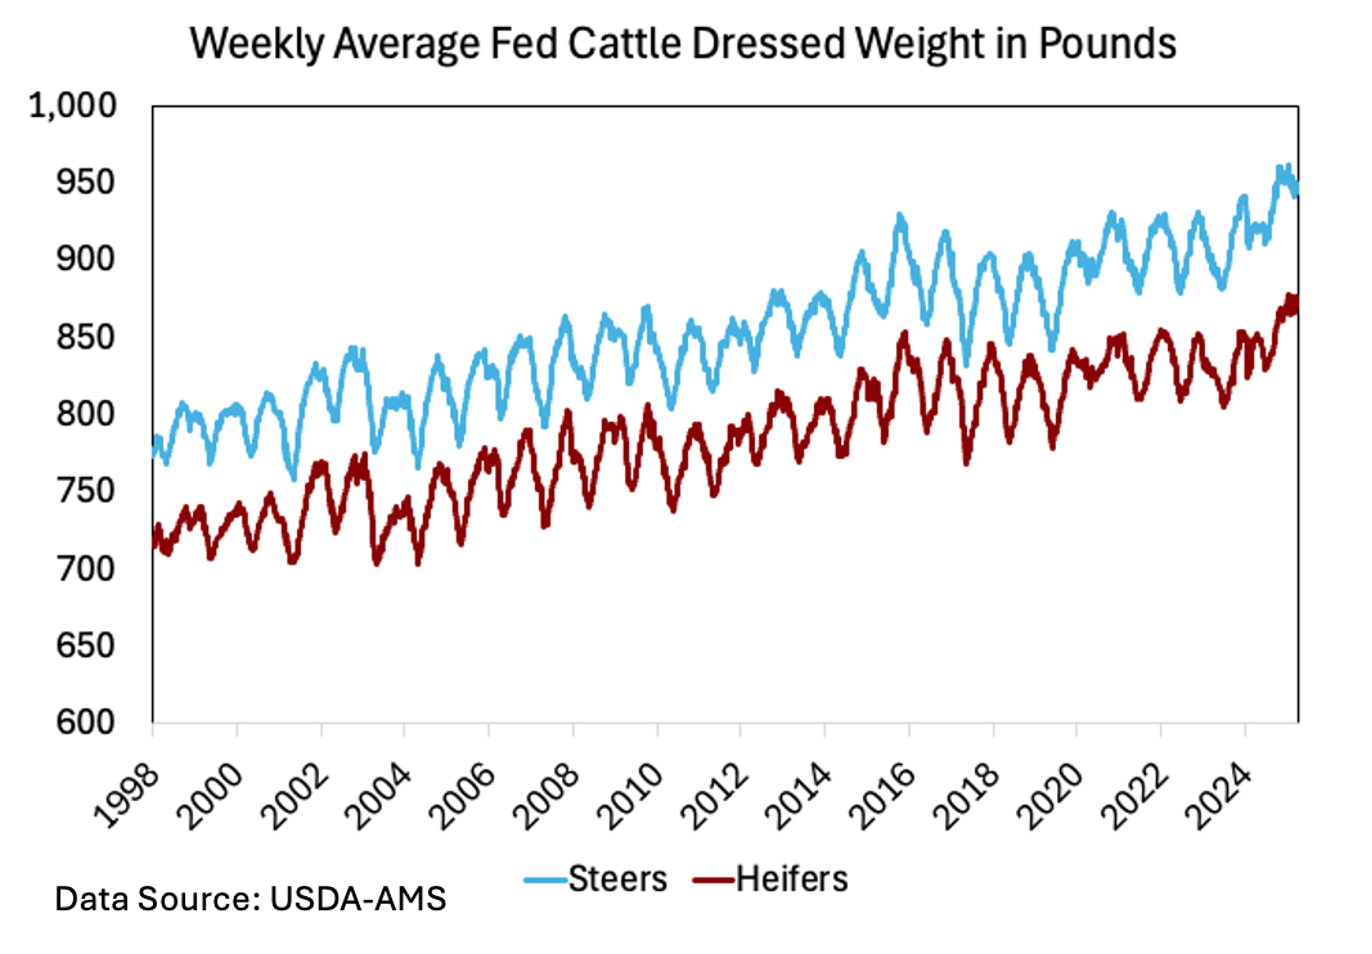
While growing demand has certainly been a factor in rising prices, the supply side is also important. Fed cattle weights have been increasing to record highs. Increasing weights are mitigating tallow supply declines due to fewer head produced. Heavier fed cattle weights have led to more yield grade 4s and 5s, resulting in more fat on the market. While cattle are discounted in price if they fall into yield grade 4 and 5, the rising value of tallow helps to offset the lost value. Tallow, grease, and lard are a small portion of the total value of a carcass, but every little bit adds value to cattle and hogs.
Anderson, David. “Tallow and Lard.” Southern Ag Today 5(23.2). June 3, 2025. Permalink