The cattle market has experienced a lot of volatility in recent weeks, especially in the futures market, due to tariff announcements and recession fears. But, prices have rebounded since the first tariff announcements due to fundamental market conditions. Those fundamental conditions include tight supplies of cattle, relatively low feed prices, and grilling season.
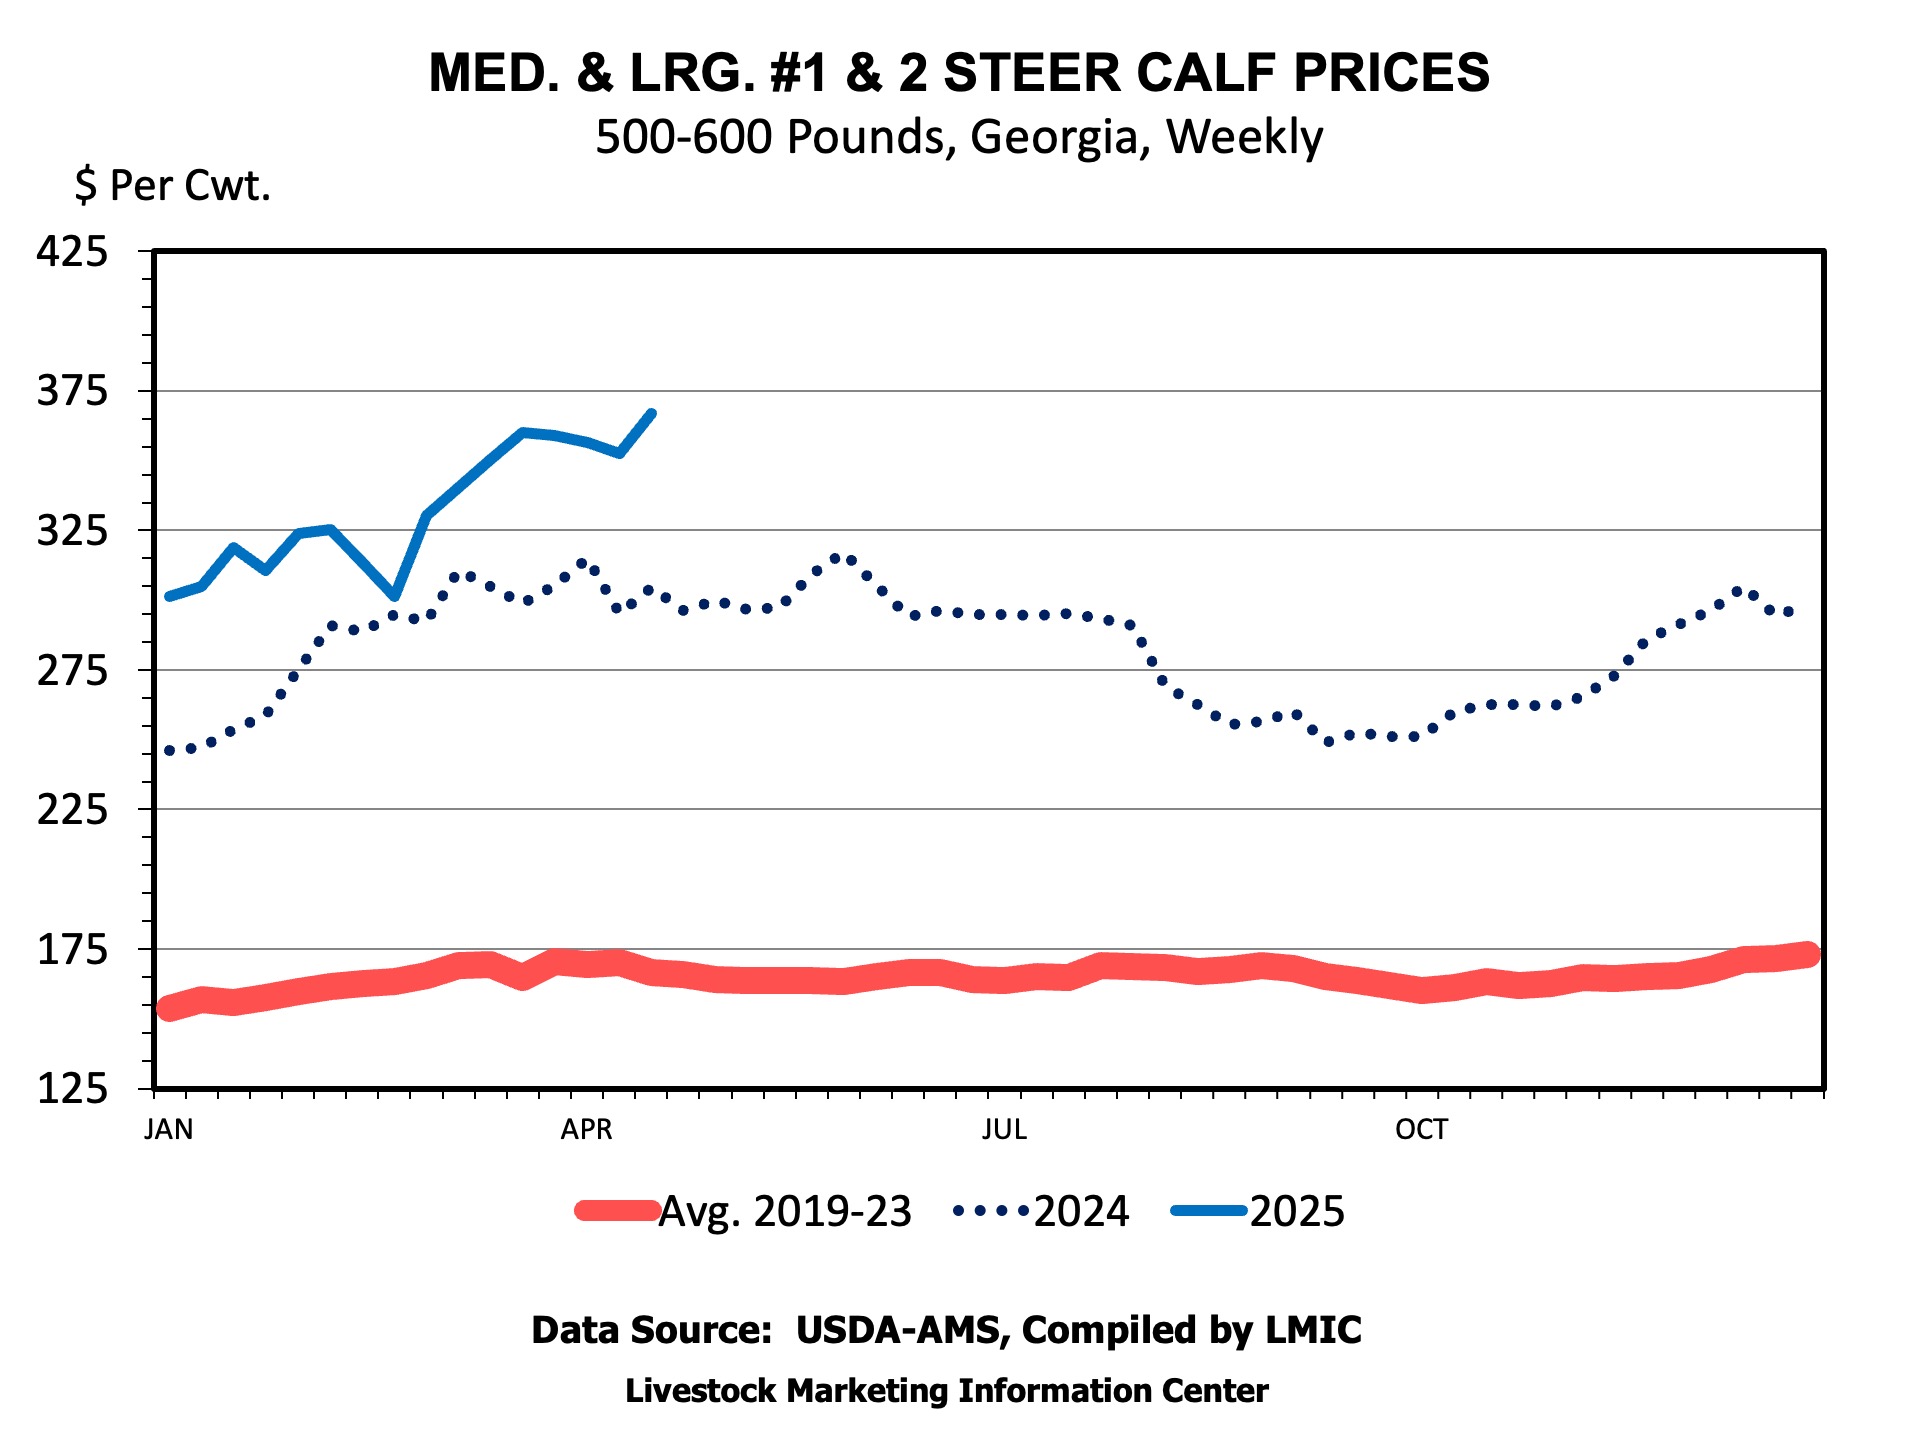
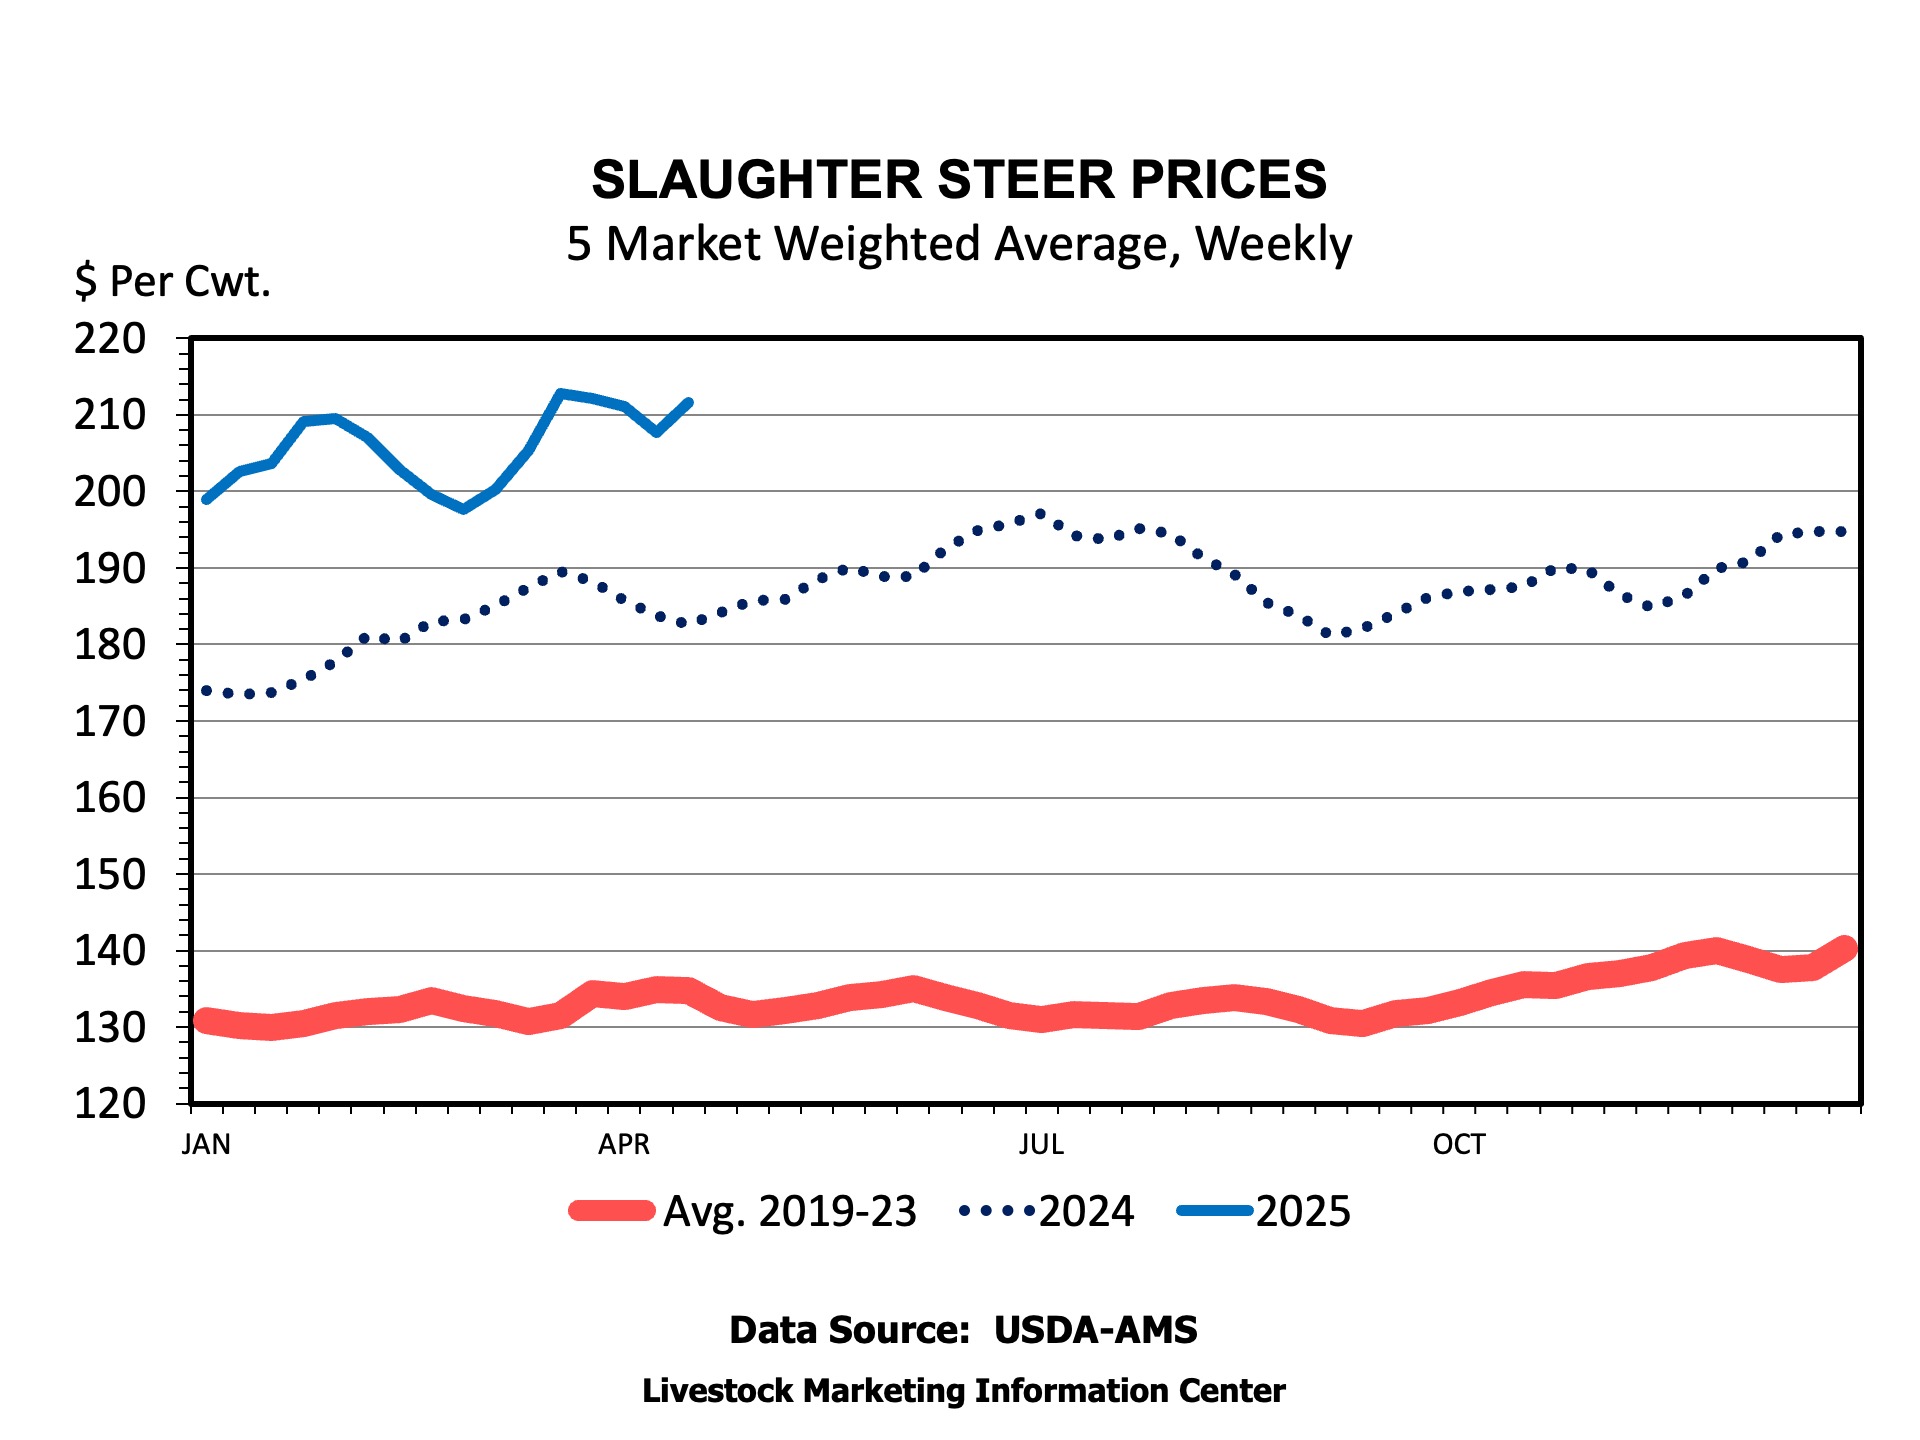
Live fed steer prices weighted across all grades averaged $207.70 per cwt the week of April 13th, following the flood of tariff announcements. Prices quickly rebounded to over $212 per cwt. in the ensuing weeks after averaging over $211 per cwt for the three weeks prior to the tariff announcements. Calf and feeder cattle markets across the South experienced price declines during that same week. Georgia auction 500-600 pound steers dropped about $7 per cwt from early April to the week of April 12th before rebounding to $368 per cwt. Mississippi auctions experienced a more dramatic decline, dropping $13 per cwt before recapturing about half of the decline.
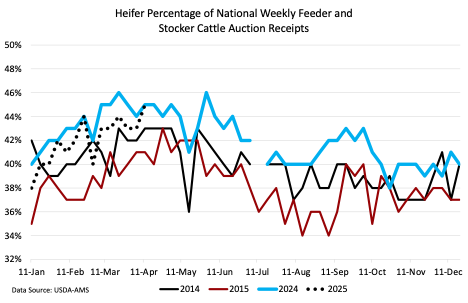
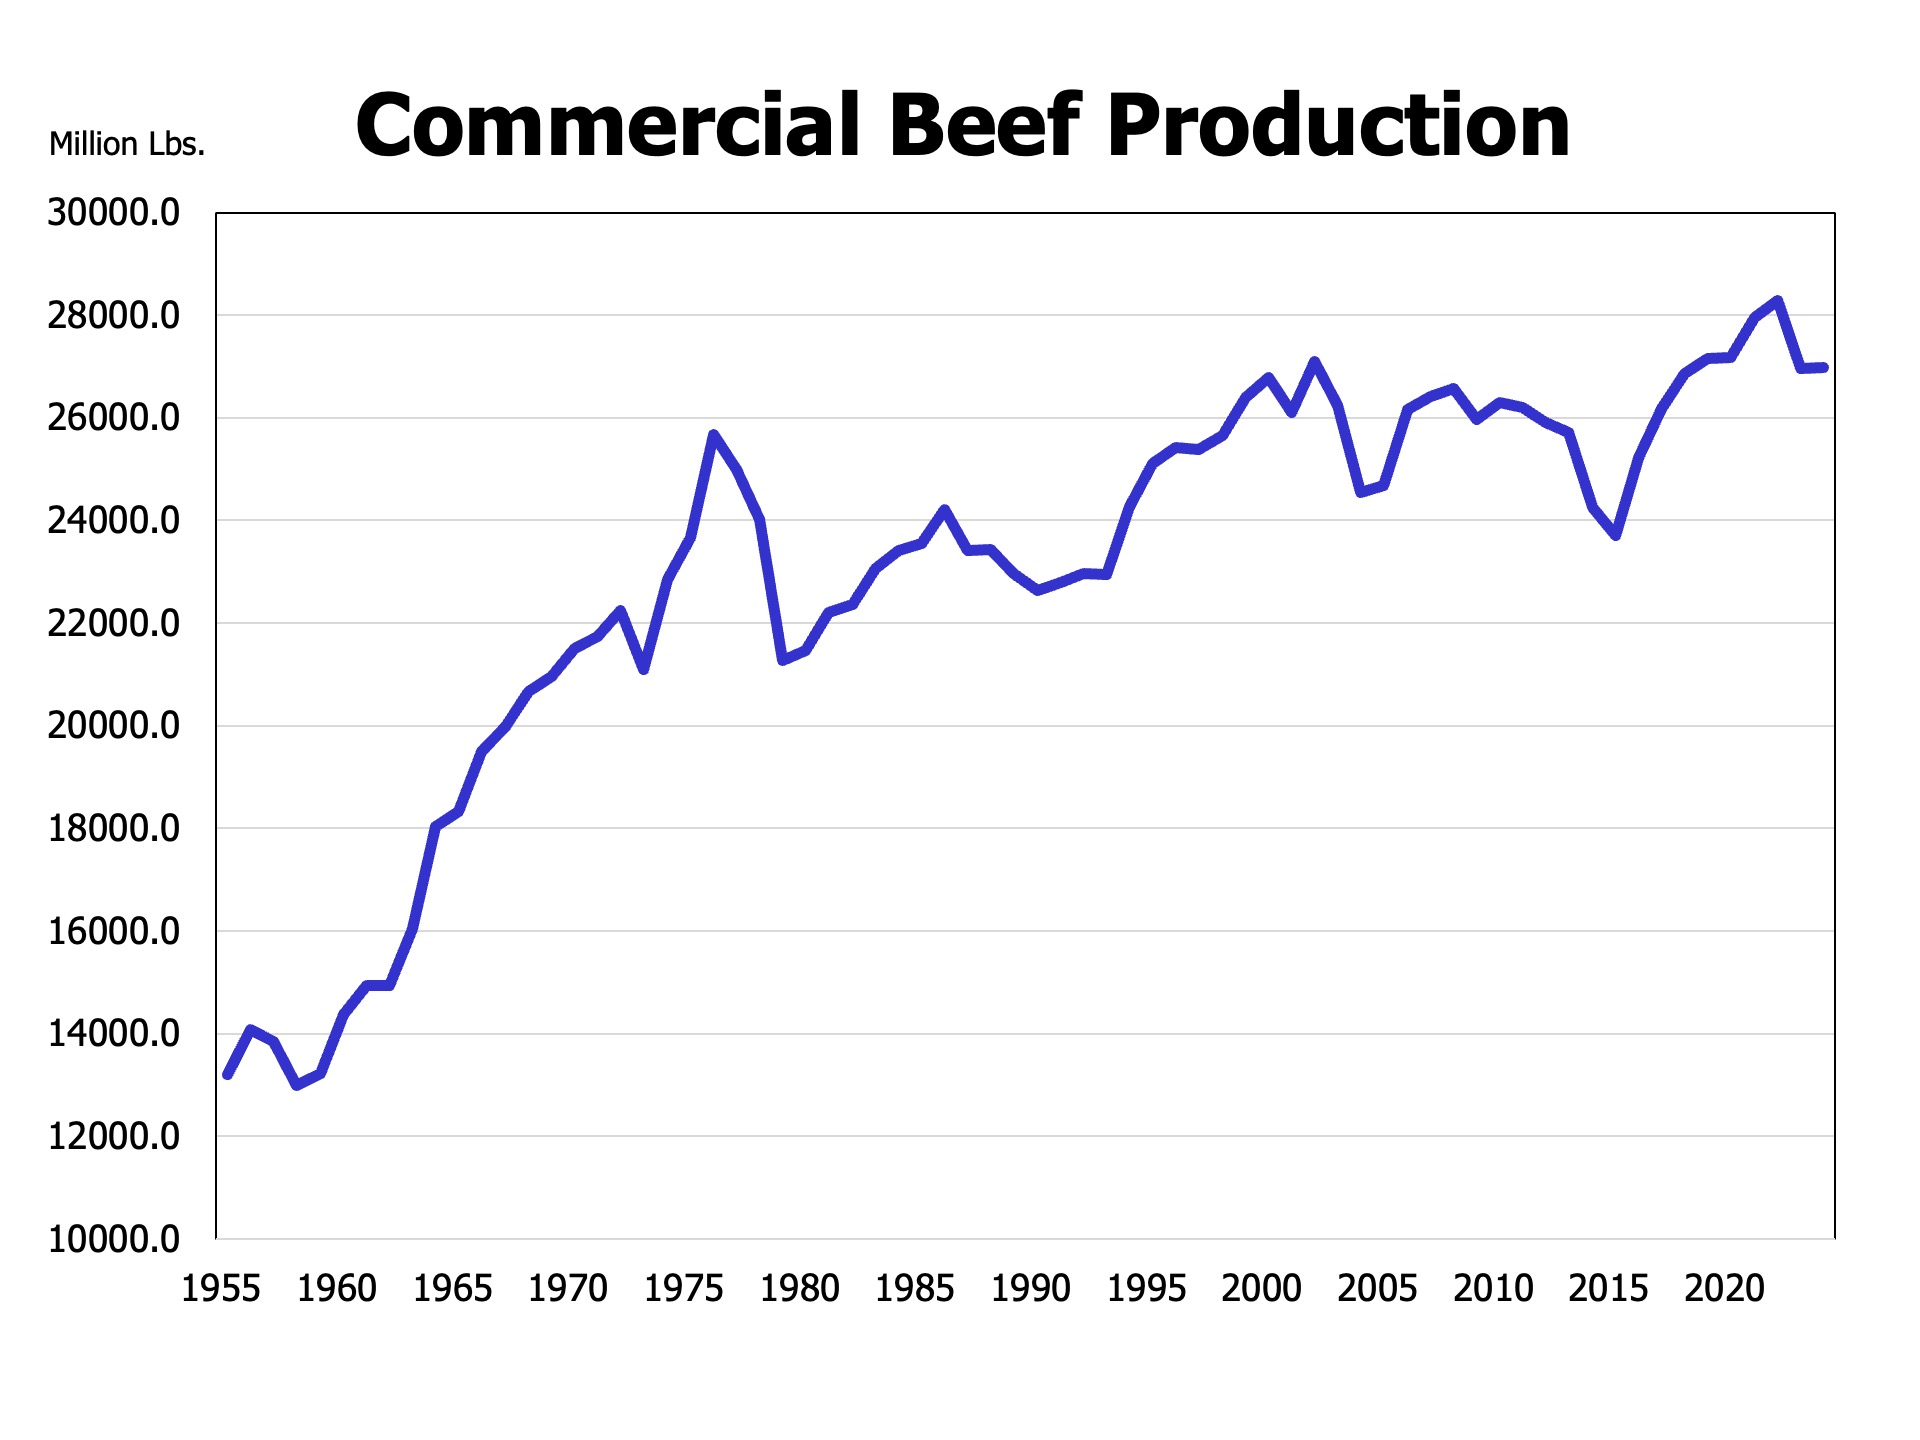
Beef production remains relatively close to last year. From January through April 26, beef production is equal to last year. But over the last month production is down 1.3 percent compared to last year. Using the daily slaughter data, fed steer and heifer slaughter is down 2.8 percent in April compared to last April. Heavier weights are continuing to keep beef production high relative to what steer and heifer slaughter would suggest. This is further showcased by the growth in cattle grading prime relative to select. Since March 15, there has been a higher percentage of fed cattle grading prime (about 12 percent) than there has select (about 11.3 percent).
One thing worth watching, that we will monitor in coming SAT’s, is weekly U.S. exports of beef to China. Tariffs appear to have severely damaged exports in the early reported weekly export data. For the week of April 17th,the U.S. exported only 186 metric tons of beef to China. That is the smallest weekly exports since March 2020 at the beginning of Covid. Exports for the week of April 10th totaled 1,431 metric tons. China has been our 3rdlargest export market for beef, following Japan and South Korea. Tariffs appear to have impacted U.S. pork exports similarly. So far, the other fundamentals have overshadowed the impact of reduced trade to China, but that might not be the case for the rest of the year.
Anderson, David. “Volatility and Fundamentals.” Southern Ag Today 5(18.2). April 29, 2025. Permalink