Severe weather has long threatened farms and ranches. Such incidents, including high winds, are expected to become more frequent and more intense. Fortunately, farmers and ranchers can take steps to reduce the vulnerability of their agricultural structures to windstorms. Tips for reducing the vulnerability of existing structures include:
- Annual inspections should include areas that may be rusted to the point of needing to be replaced as well as cracks in foundations.
- Prior to storms, check structures for loose elements and vulnerabilities. Loose fitting lids, vents, etc. should be secured.
- Doors and windows should be shut tightly. If they cannot be closed, they should be latched in a secure open position (e.g., metal building and Quonset hut doors should be latched closed or fully open).
- Structures such as movable carports used for livestock shade should be anchored for their own protection and the protection of nearby structures as well as livestock, if they are not moved to safer environments.
Our 2020-2022 study of farm wind damage found that only 43% of respondents’ farms had fully recovered after two years. The availability of builders and materials were most often cited for delays in construction, followed by cost and insurance coverage. On the other hand, most respondents said they and their insurance adjusters largely agreed on the level of wind damage for agricultural buildings, center pivot irrigators, and steel grain bins. Still, farmers and landowners should review their insurance policies to make sure the coverage meets current business needs.
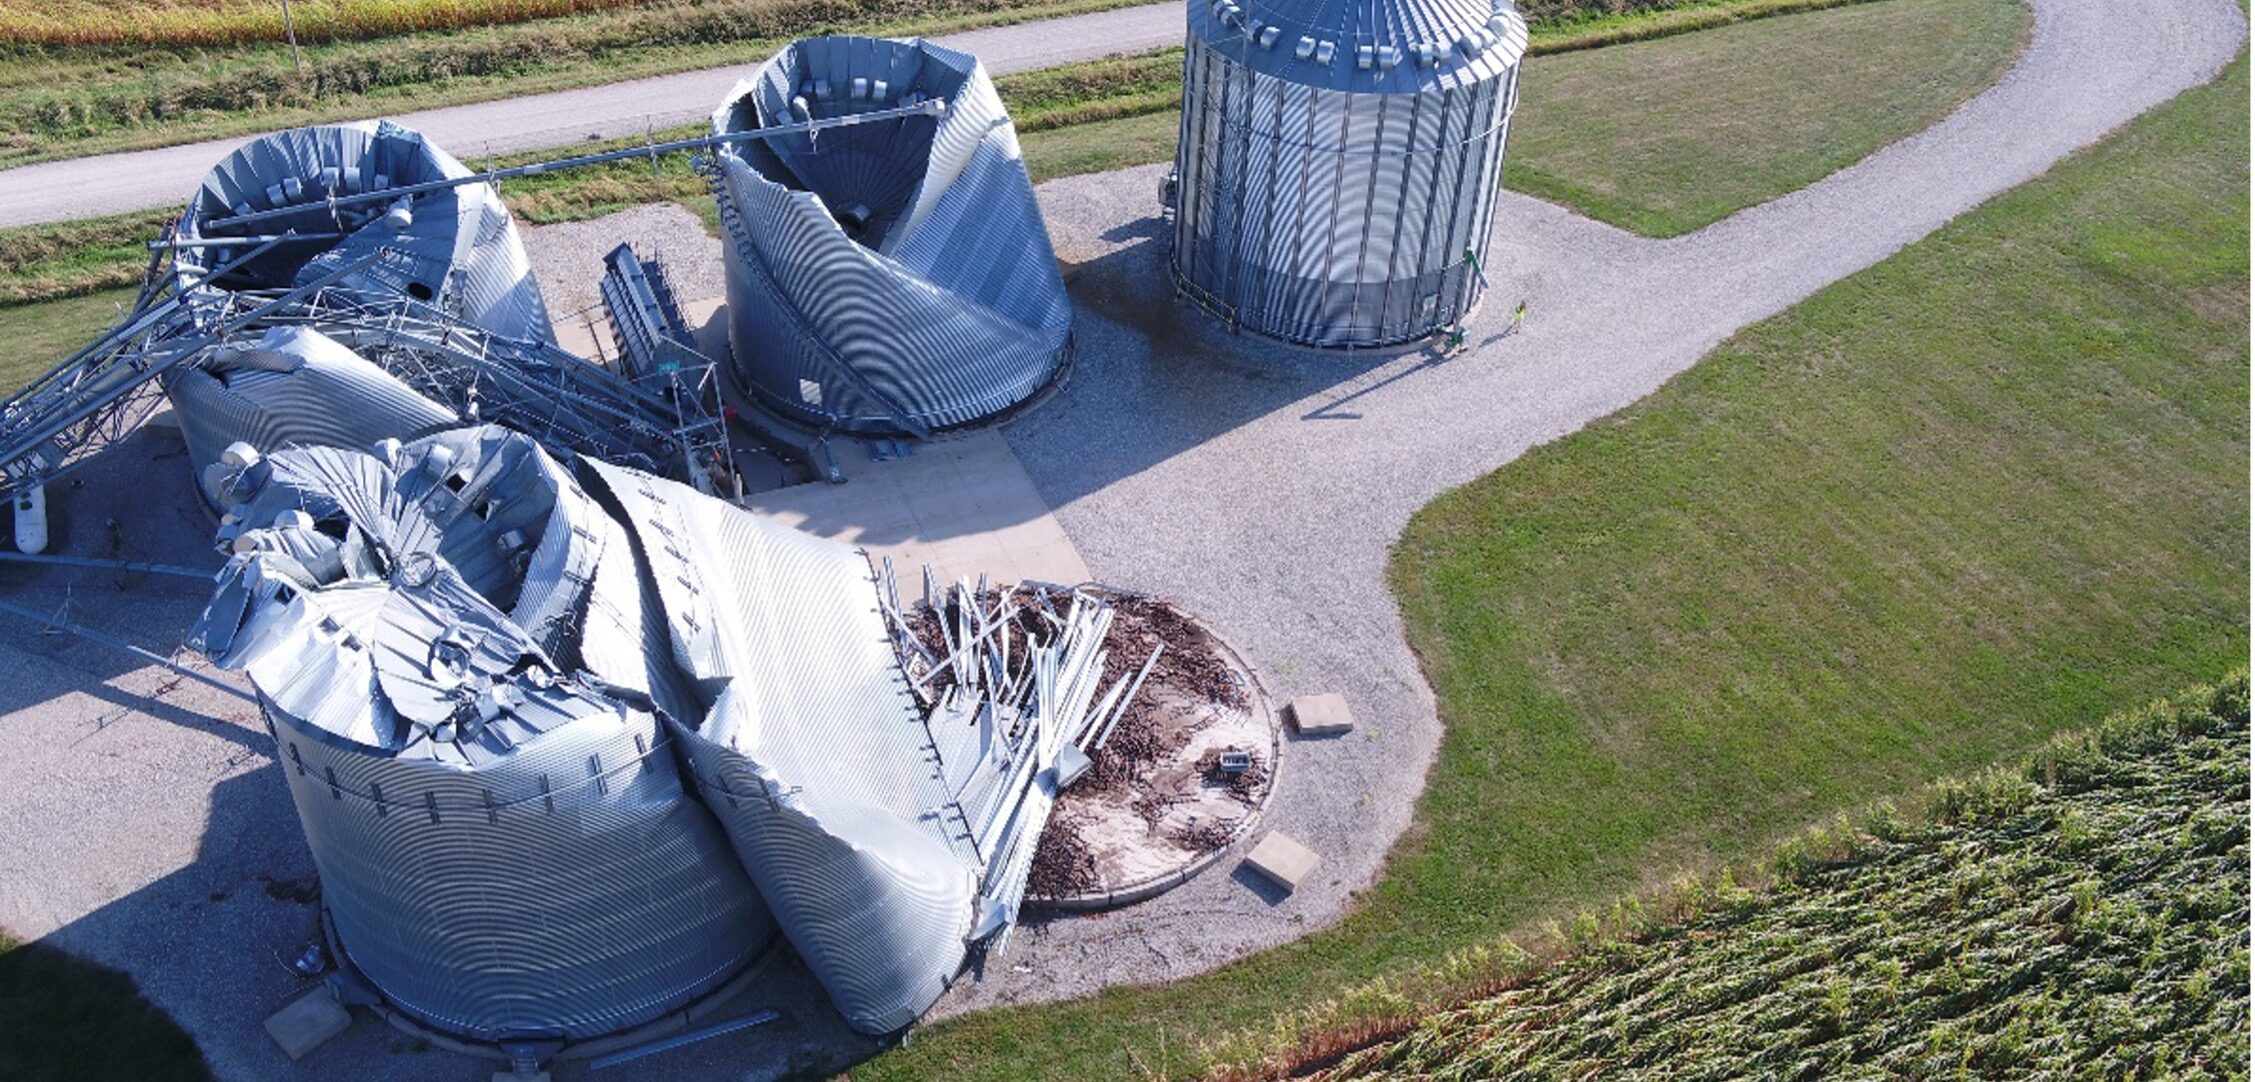
Most farmers surveyed in 2022 said they intended to rebuild structures with enhanced wind resistance. However, observations of their replacement structures indicate less enhancement. When replacing structures, businesses are usually balancing multiple objectives including cost, capacity needs, and availability of construction materials. Steel grain bins provide an example of trade-offs between capacity and structural integrity. Findings from our assessment of bins, computational modeling of wind loading, and review of other studies finds:
- Taller bins and bins more exposed to wind speed (i.e., not near other buildings or other windbreaks) are more vulnerable.
- Bins are most resilient when full of product distributed evenly throughout the structure. However, even full bins can fail at the wall-roof connection (roof damage or tear off) or experience non-structural damage (e.g., stair damage).
- Vented bins were more vulnerable than bins without vents.
- Steel grain bins with vertical stiffeners tend to perform significantly better during wind storms than unstiffened bins.
- Wind rings around bins do not appear to be significantly more resilient.
Wittich, Christine, Maria Watson, Rebekka Dudensing, Steven Klose, and Dean Mc Corkle. “Improving Ag Structures’ Resilience to Wind Damage.” Southern Ag Today 3(42.5). October 20, 2023. Permalink