Category: Specialty Topics

  • Who’s Buying this Round? Insights from Florida to Help Breweries Reach Consumers

    Who’s Buying this Round? Insights from Florida to Help Breweries Reach Consumers

    The number of breweries has grown substantially over the past decade, becoming a ubiquitous establishment in communities nationwide. However, many of these breweries are small craft producers that lack resources for in-depth market research, creating a need for localized consumer insights—especially in the Southeast where growth of the beer sector has been slower. This synthesis of our case study on the consumption and purchasing habits of Florida beer consumers provides insight into how breweries can effectively market their products to specific segments. 

    We find that craft beer has broad appeal with 72% of those surveyed reporting regular purchases. As expected, millennials lead in both purchase frequency and spending, with the highest median monthly beer expenditure at $50 (see Figure 1 and Table 1). Though spending is less ($25 median) among baby boomers, it is not negligible, and, in some areas, they represent a sizable market when aggregated. Women spend nearly the same amount and purchase craft beer at close to the same frequency as men, in-line with national trends towards gender parity and a sign that inclusive marketing is an increasingly important consideration as breweries look to expand their consumer base in a competitive market. 

    Table 1. Median monthly beer expenditure by gender and generation

     1st QuartileMedian3rd Quartile
    Gender   
    Female(n = 325)$15$25$50
    Male(n = 257)$15$30$75
    Generation   
    Millennials (n = 127)$20$50$100
    Gen X (n = 141)$15$30$60
    Baby Boomers (n = 298)$13$25$50
    Notes: Data from our survey of 582 Florida beer consumers. We exclude Gen Z due to the small number of responses from this segment.

    Regarding where consumers drink and shop, beer is most frequently consumed at home (68%) and purchased from grocery stores (66%). This presents two significant challenges for small breweries with goals of tapping into broader marketing channels: (1) acquiring and maintaining canning or bottling equipment and facilities is a major capital investment decision which cannot be easily reversed, and (2) grocery stores dedicate limited shelf space to beer and favor widely recognized brands. To successfully expand into packaged beer, breweries should consider developing a targeted marketing strategy for off-premises retail sales. 

    The full case study can be found at https://edis.ifas.ufl.edu/publication/FE1160


    Hambaryan, Meri, Glory Orivri, Nathan Palardy, John Lai, and Bachir Kassas. “Who’s Buying this Round? Insights from Florida to Help Breweries Reach Consumers.Southern Ag Today 5(10.5). March 7, 2025. Permalink

  • Why Grocery Inflation Still Feels High

    Why Grocery Inflation Still Feels High

    Since November 2023, grocery inflation (food-at-home, FAH) has slowed to around 1%, following fluctuations in 2021 and 2023 that peaked at 13.5% (US BLS). However, the perception of grocery inflation remains relatively high. Our monthly consumer survey of approximately 500 primary grocery shoppers in the US reveals that a significant share of consumers still perceives grocery inflation as high (Figure 1).[1] Over 60% of respondents reported high inflation perceptions between July 2023 and May 2024 when the average FAH inflation rate was 1.8%. While this is lower than the peak of 73% in July 2022, it remains well above the pre-high inflationary period average of 33% (January 2017–August 2021). Several factors contribute to the persistently high perception of inflation among consumers.

    First, the sustained high inflation perception among consumers is expected because current moderate inflation indicates that prices for many goods and services continue to rise, even after a significant jump during the high inflationary period (Figure 2). Inflation measures the rate at which prices increase over time, calculated by comparing prices in the current period to those from the same period one year earlier. Falling inflation rates do not imply that prices are decreasing; instead, they indicate that prices are rising at a slower pace. This often confuses consumers, who may misinterpret news about decreasing inflation rates as a reduction in overall price levels. Disinflation (i.e., a slowdown in the rate of inflation) should not be confused with deflation, which refers to an actual decrease in general price levels (Marks, 2023).

    Second, consumers often compare current prices to those they were accustomed to prior to the period of high inflation, rather than to prices from one year ago as inflation metrics do. For example, comparing the FAH consumer price index (CPI) from May 2024 to May 2020 reveals a substantial cumulative inflation rate of 24.68%, as demonstrated in Figure 3. This tendency could lead to a heightened perception of current inflation.  

    Third, frequent purchases of essential items like groceries amplify inflation perceptions. As noted by D’Acunto et al. (2021), frequent exposure to necessity purchases heightens inflation awareness. A survey by Balagtas and Bryant (2024) found that consumers were more sensitive to food price increases compared to other goods, despite actual food inflation (2.2%) being relatively low compared to items like housing (4.5%) and auto insurance (22.6%). Understanding what inflation is and how it is calculated is essential for consumers to bridge the gap between actual inflation and their perceived inflation. Historically, grocery prices rarely decrease (US BLS), making it unlikely that inflation perceptions will quickly return to pre-high-inflation levels. However, rising incomes (US BLS) are expected to gradually ease these perceptions over time. Identifying and addressing evidence-based causes of persistent high inflation perception can improve public understanding, boost consumer confidence, and help policymakers to communicate more effectively with consumers about economic conditions.

    Figure 1. the Inflation Rate of Food at Home (FAH) Based on Consumer Price Index versus Consumer Inflation Perception of FAH, represented by the Share of Respondents Who Strongly Agreed Noticing an Increase in Grocery Prices

    Source: U.S. Bureau of Labor Statistics and a consumer tracker survey managed by the University of Florida’s Florida Agricultural Marketing Research Center (FAMRC).

    Figure 2. Food at Home (FAH) Inflation Rate Fluctuations versus FAH Consumer Price Index 

    Source: U.S. Bureau of Labor Statistics.

    Figure 3. Actual Inflation Rate of Food at Home Based on Consumer Price Index versus Consumer Inflation Perception, represented by the Share of Respondents Who Strongly Agreed with the Inflation Statement

    Source: U.S. Bureau of Labor Statistics and a consumer tracker survey managed by the University of Florida’s Florida Agricultural Marketing Research Center (FAMRC).

    [1] In our study, inflation perception is measured by the statement “I have noticed an increase in grocery prices at my grocery store recently” where survey participants answered on a 7-point Likert scale ranging from strongly disagree (1) to strongly agree (7). We focus on the “strongly agree” category in our discussion on inflation perception as it experienced most significant changes during the inflationary period.


    Kim, Ashley Jiyoon, and Sungeun Yoon. “Why Grocery Inflation Still Feels High.Southern Ag Today 5(6.5). February 7, 2025. Permalink

  • Evaluating the Cooperative Manager

    Evaluating the Cooperative Manager

    The annual evaluation of the general manager is a clear duty of a cooperative board of directors. It’s a very important task. An evaluation of the general manager is an opportunity to revisit the direction and performance of the cooperative. When done correctly, the evaluation process will strengthen ties between board and manager and align management with board objectives. Here are three recommendations for improving the manager evaluations at your cooperative.

    1. Evaluate What Matters Most

    One challenge of manager evaluation is that potentially, there is a lot to evaluate. Further, some of the manager’s duties might be hard to evaluate or observe. If you choose criteria based on the functions of management, you might develop a list like this:

    Planning

    • Actively and accurately assesses competitive forces
    • Makes timely adjustments to the changing business environment
    • Helps to craft a successful strategic approach
    • Develops and implements effective timelines and goals
    • Budgets for current and future operating needs
    • Ensures cooperative resources are available and ready for customer use

    Organizing

    • Effectively hires and trains high-quality employees
    • Assigns resources to their best use
    • Delegates managerial duties effectively
    • Plans and accommodates organizational growth

    Leading

    • Motivates employees toward excellence
    • Cultivates board relations
    • Communicates with members
    • Promotes the company vision
    • Mentors and grooms future managers

    Controlling

    • Reports financial results in a clear and timely manner
    • Monitors cooperative performance
    • Appropriately adjusts budgets throughout the year
    • Makes staffing changes when needed
    • Conducts employee evaluations and gathers employee feedback

    Further, you can consider the manners in which the manager conducts their self. The manager’s personal skills, attributes, and competencies might also be important. Additional criteria might include the following:

    Interpersonal

    • Communication Skills
    • Listening
    • Empathy
    • Emotional Intelligence
    • Working with Others
    • LeadershipMentoring
    • Friendliness
    • Technical
    • Industrial Knowledge 
    • Marketing
    • Equipment Operations
    • Software Knowledge

    Conceptual

    • Abstract Thinking
    • Problem Solving
    • Adaptability
    • Analysis
    • Diagnosing Problems
    • Forecasting and Predictions
    • Decision-making

    One solution to organizing all these potential criteria is to consider the stewardships of the manager. Every cooperative manager has responsibilities toward the operations of the cooperative, the board, and the members. To help further, consider if your evaluation criteria are focused on the mission of the cooperative. In doing this, better questions begin to emerge:

    Cooperative

    1. Recruits, trains, and retains quality employees. 
    2. Maintains and protects the functionality of cooperative assets.
    3. Demonstrates result-driven use of cooperative funds.
    4. Focuses on cooperative mission.

    Board

    1. Provides frequent and thorough reports of cooperative financial condition.
    2. Communicates market opportunities and risks in a timely manner.
    3. Interprets market conditions affecting financial performance.
    4. Informs board of potential legal threats and conflicts of interest.

    Members

    1. Actively recruits new membership.
    2. Is knowledgeable of individual members and seeks their input.
    3. Promotes the mission of the cooperative to members.
    4. Is focused on customer service.

    2. Include Professional Development

    Don’t forget that the manager is also a valuable asset to the cooperative. Your evaluation might include goals for self-improvement of leadership skills or industry knowledge.  The manager might self identify some of these goals as well as other relevant criteria for the cooperative, board, and members. Questions might include:

    Manager

    1. Mentors employees for future leadership.
    2. Exemplifies integrity for the cooperative.
    3. Listens to member-owner concerns.
    4. Analyzes cooperative performance and suggests needed corrections.

    3. Give Evaluation the Time it Deserves

    Successful manager evaluation is not an annual event – it is a year-long process. When your board approach to manager evaluation is to invite the manager in to award a bonus, or take them to lunch, or any other solitary event, you are failing to protect the cooperative. Proper evaluation starts immediately following the prior evaluation by establishing the evaluation criteria for the coming year. This is to be agreed upon by board and manager. Monthly board meetings should take time to revisit and assess the evaluation, noting evidence of performance. Executive sessions are useful times to briefly discuss management performance and discuss any needed adjustments to evaluation criteria, or management actions. At the end of the year, the board chair can ask for an evaluation from each board member and the manager.  Doing this will help to elevate the annual evaluation to a constructive process for both cooperative and manager. 


    Park, John. “Evaluating the Cooperative Manager.Southern Ag Today 5(5.5). January 31, 2025. Permalink

  • Where Does My Food Come From? What Google Searchers Want to Know

    Where Does My Food Come From? What Google Searchers Want to Know

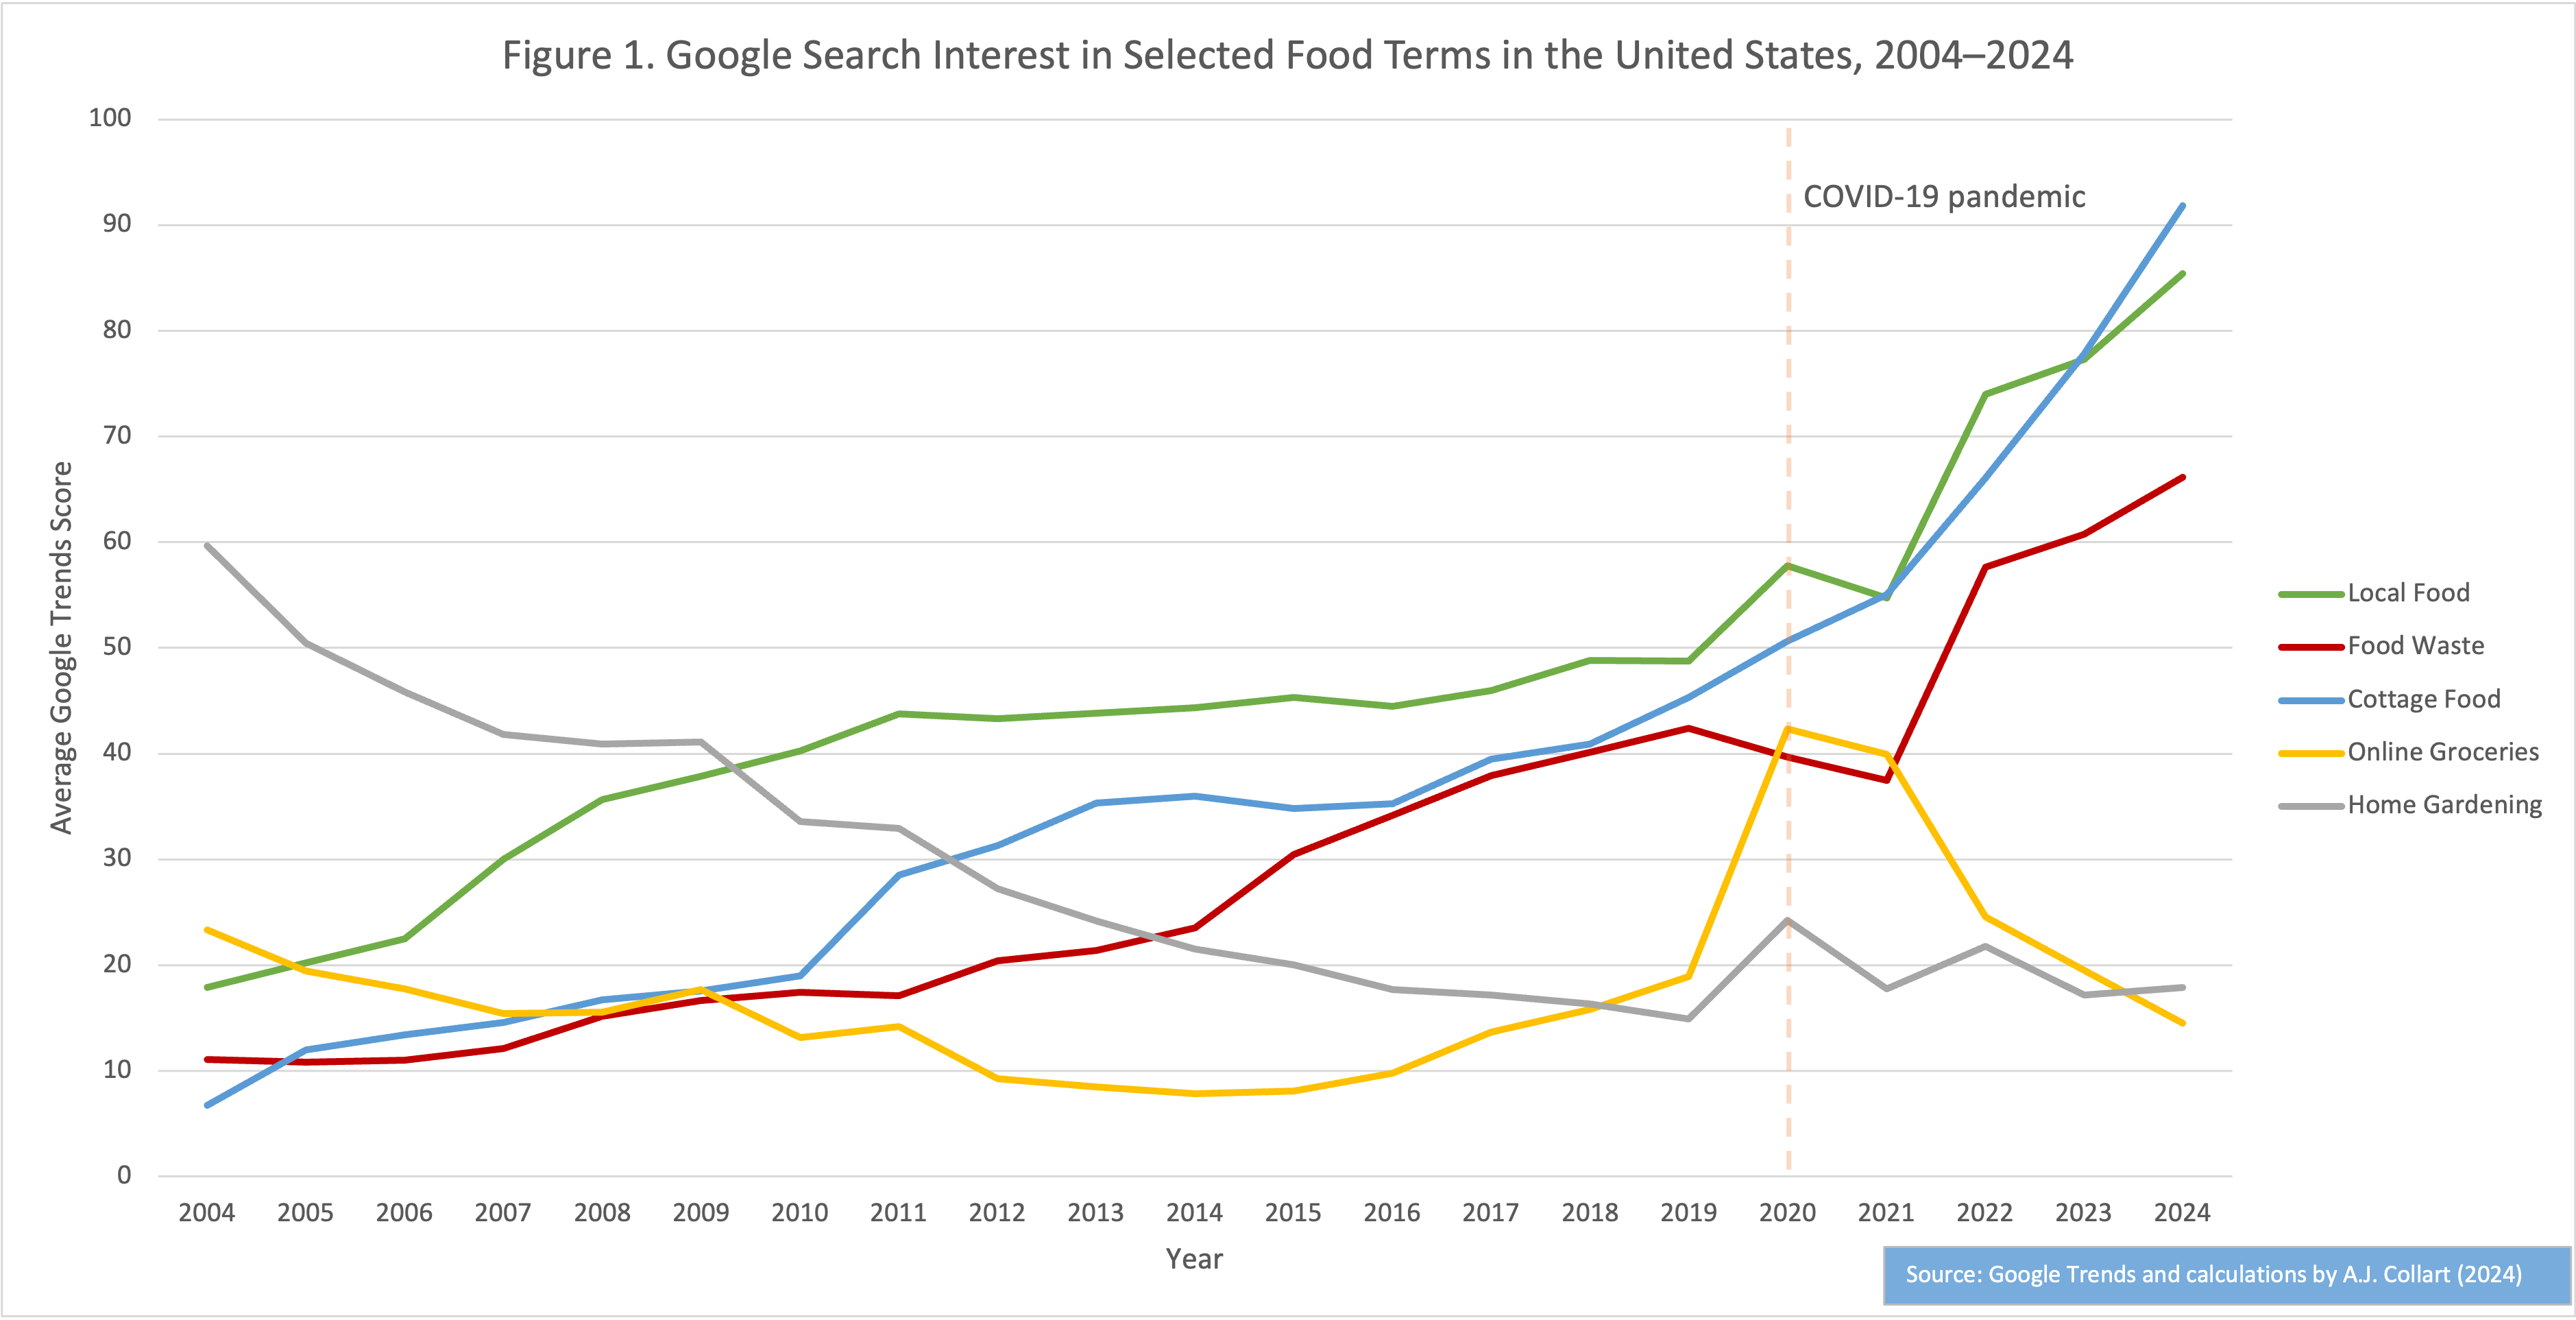
    A recently updated national study of Google Search terms highlights the importance of “Local Food.” Food supply chains are complicated and vary substantially across products and places. Still, several trends in people’s online searches are striking and may have important implications for farms and food businesses looking to position their products in the U.S. food market.

    While “Local Food” had been experiencing a steady upward trend before the COVID-19 pandemic, search interest spiked significantly during the past three years. Similarly, “Cottage Food” experienced an even more significant spike in search activity, reflecting high interest in artisanal and specialty foods. Cottage foods are specific types of foods made in an individual’s home kitchen. Because many of these foods must be sold in person directly from the producer to the end consumer, they are also often locally produced and sourced. Over the past two decades, “Local Food” and “Cottage Food” reached their peak popularity in 2024 (Figure 1).

    These trends may follow and motivate efforts undertaken by state departments of agriculture to promote local farm and food products in their respective retail settings.  While not identifying the values driving these search choices, they point to potential opportunities for local food merchandising strategies that convey an authentic local connection to consumers.  

    Searches for “Online Groceries” and “Home Gardening” saw an uptick in 2020 as consumers sought a better handle on how and where to get food. Interestingly, the search interest for these terms has not continued, as consumers return to in-person grocery shopping, and time, financial, and other constraints continue the trend away from home gardening.  

    The underlying drivers motivating these searches may be inflation-conscious consumers’ desires to get the most out of their food dollars. The positive trend and recent popularity of “Food Waste” searches also point to potential opportunities for farms and food businesses to continue or improve their messaging around efficient production, upcycling, gleaning and food bank donations, and other efforts to help people access high-quality and nutritious foods.


    Woods, Tim, and Alba J. Collart. “Where Does My Food Come From? What Google Searchers Want to Know.Southern Ag Today 5(4.5). January 24, 2025. Permalink

  • Harnessing Workforce Development and Well-being in Communities

    Harnessing Workforce Development and Well-being in Communities

    The challenges associated with current labor shortages, availability of diverse job opportunities, and creation of employment pathways are well understood. Can the US deliver effective workforce development programs in ways that work for all?  The answer is a resounding Yes! However, designing effective employment programs and pathways that work for employed and unemployed community residents is not obvious or straightforward. Skill gaps vary according to geography (Moretti, 2024). The propensity to look for jobs and the availability of job opportunities varies across states and cities. For instance, workers entering job markets in states with strong economies will likely find work. Further, labor markets for manual and unskilled work tend to be localized, while professional positions attract job seekers from everywhere. 

    Many jobs require skills training beyond high school but not a formal degree. This creates a misalignment of skills, and training opportunities for those in-demand skills are often inaccessible to the citizens who need them most. This is true for Texas and many other states. Skills training has emerged as a pressing demand to address the challenges facing workforce development in the nation today. Workforce development stakeholders typically consist of employers and federal, state, and local governments. Employed residents are sometimes included in some of the planning and implementation of workforce development programs. However, unemployed residents are often overlooked or left out in the planning and design of workforce development initiatives. Moreover, offering support services, such as childcare or eldercare, can increase the participation of women in the workforce. Underscoring these trends, it is becoming clearer as to why some regions and cities have prospered more than others.

    Finding jobs that match our talent, pay well, and align with individual preferences significantly enhances our quality of life. Regions with strong economies offer a better quality of life. In contrast, low-resourced communities face more complex challenges in developing the local economy. Community members also face disparities related to health and well-being, access to public and private services infrastructure, and the quality of their physical and material environments (Bernard et al., 2022). For example, commuting to work daily or access to healthcare requires reliable transportation, and its absence can limit one’s ability to take advantage of existing resources. The availability of and access to resources and constraints to be overcome by community residents need to be examined from a region-specific and localized focus. Health and social inequalities play an important role in shaping well-being and employment challenges facing community members. Thus, the choice between workforce development and well-being is far from neutral. 

    My research shows that addressing the well-being needs of residents plays an important part in fostering a local ecosystem that, in turn, supports the community in addressing its workforce development needs. Thus, it is important to consider the well-being of community members to reshape and harness the full potential of our work environments. To succeed with workforce development programs, we need to refocus our priorities on well-being. When the health and well-being of community residents are fostered, they show up for work, take less leave, have the confidence to perform well in their jobs, and ensure the safety of their workplace. Investing in skills training enhances the health, quality of life, and economic success of residents and the broader community.

    References

    Moretti, E. (2024). Place-based policies and geographical inequalities. Oxford Open Economics3(Supplement_1), i625-i633.

    National Skills Coalition. (2022, May 12). Skills mismatch. https://nationalskillscoalition.org/skills-mismatch/

    Bernard, J., Steinführer, A., Klärner, A., & Keim-Klärner, S. (2023). Regional opportunity structures: A research agenda to link spatial and social inequalities in rural areas. Progress in Human Geography47(1), 103-123. https://doi.org/10.1177/03091325221139980


    Alagaraja, Meera. “Harnessing Workforce Development and Well-being in Communities.” Southern Ag Today 4(52.5). December 27, 2024. Permalink