Category: Trade

  • How the Trade War Is Hitting American Beer, Wine, and Spirits in Canada

    How the Trade War Is Hitting American Beer, Wine, and Spirits in Canada

    We often forget that beer, wine, and spirits are fundamentally agricultural products, rooted in the cultivation of corn, barley, rye, wheat, grapes, and other farm commodities. As a result, disruptions to alcohol trade are not just shocks to beverage markets, but direct blows to farmers, rural communities, and the wider agricultural economy that supplies these products (Muhammad et al., 2025). This broader agricultural story now runs straight through Canada, where trade tensions transformed alcohol import demand into a geopolitical statement. Canada has long been an important export destination for U.S. beer, wine, and spirits, supported by geographic proximity, integrated supply chains, and decades of tariff‑free trade. In 2024, for instance, Canada was the leading market for U.S. wine exports and the second leading market for U.S. distilled spirits and beer exports (USDA, 2026). This relationship shifted abruptly in 2025 when trade tensions escalated beyond conventional tariff retaliation and entered the retail marketplace.

    At the heart of the disruption was Canada’s decision to remove American alcohol from store shelves entirely. Rather than relying solely on retaliation through tariffs, multiple provinces instructed their liquor authorities to stop purchasing and selling American beer, wine, and spirits. In early February 2025, the United States announced broad tariffs on Canadian imports. Canada responded in March with retaliatory tariffs on a range of U.S. goods, including alcohol (Kitamura, 2026). Provincial governments escalated further by directing liquor boards in Ontario, Quebec, British Columbia, Nova Scotia, and other provinces to halt purchases of U.S. alcohol and remove existing products from shelves and digital platforms. Throughout the spring and summer of 2025, these delistings remained largely in place, with only limited reversals in select provinces (DISCUS, 2026).

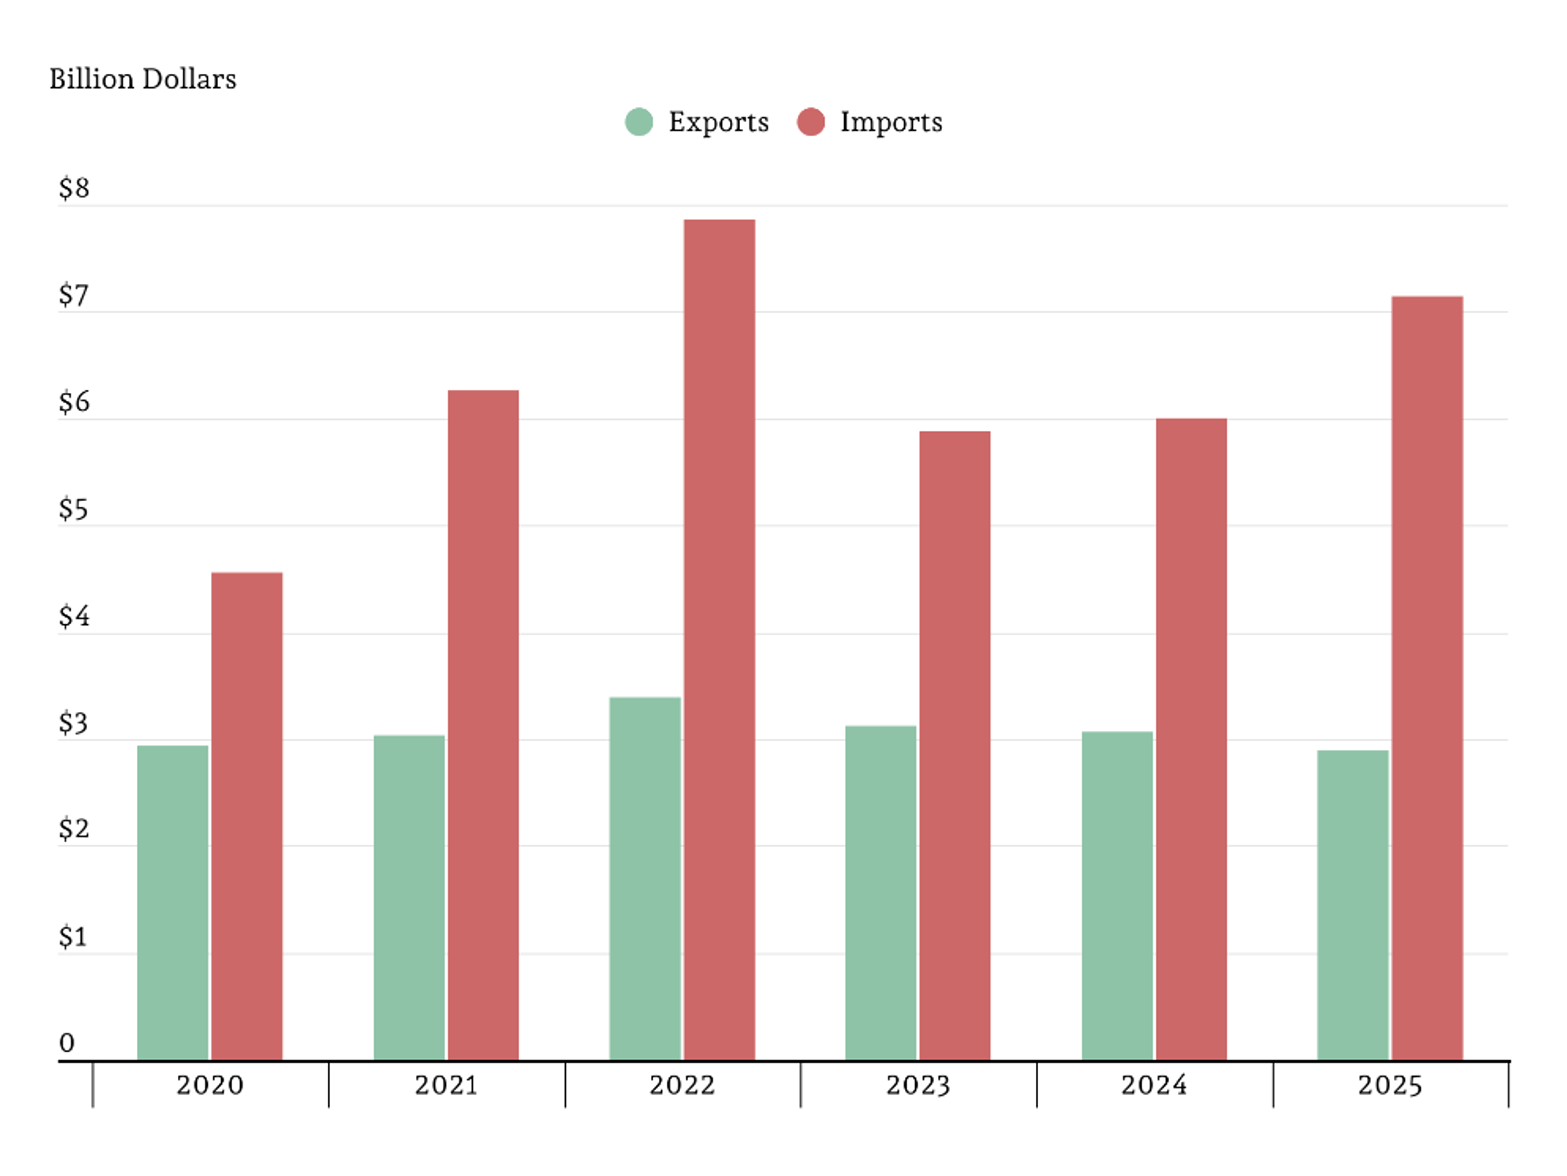
    Figure 1 summarizes the year‑over‑year change in U.S. beer, wine, and distilled spirits exports to Canada between 2024 and 2025, reflecting the impact of the trade war on each product category. As shown in the figure, wine and related products experienced the largest decline, falling from $460 million in 2024 to $103 million in 2025, a 77.6% reduction or a $357 million loss. Distilled spirits exports declined from $238 million to $89 million, a 62.7% decrease, resulting in a $149 million loss. Beer exports also dropped sharply, falling from $47 million to $17 million, a 64.4% decline or $30 million loss. Taken together, total U.S. alcohol exports to Canada fell from $744 million to $208 million, a 72% decrease amounting to an overall dollar loss of $536 million. 

    These shelf removals sent a clear political signal to U.S. policymakers while simultaneously encouraging Canadian consumers to substitute toward domestic or non‑U.S. products. It also exposed the vulnerability of exporters operating in markets where governments control distribution infrastructure, demonstrating how trade wars can extend beyond borders and tariffs to reshape retail availability itself. Even as some punitive measures were later eased, this episode underscored how quickly trade relationships built over decades can be disrupted when retaliation targets market access rather than prices alone.

    Figure 1. U.S. Beer, Wine, and Spirits Exports to Canada: 2024 and 2025

    Source: U.S. Department of Agriculture, Foreign Agricultural Service, Global Agricultural Trade System (GATS) (USDA, 2026)

    References

    Distilled Spirits Council of the United States (DISCUS) (2026). Annual Economic Briefing https://distilledspirits.org/wp-content/uploads/2026/02/FINAL-DISCUS-Annual-Economic-Briefing-Presentation-2026-2.5.2026-11-AM.pdf

    Kitamura, K.H. (2026) U.S.-Canada Trade Relations. Report IF12595. Congressional Research Service. https://www.congress.gov/crs-product/IF12595

    Muhammad, A., Menard, R. J., and Smith, S. A. (2025). “Tennessee and Kentucky Distilled 

    Spirits: What’s at Stake from a New Trade War?” Choices 40(3). https://doi.org/10.22004/AG.ECON.358876

    U.S. Department of Agriculture (USDA) (2026). Global Agricultural Trade System. Foreign Agricultural Service. https://apps.fas.usda.gov/gats/default.aspx


    Muhammad, Andrew. “American Beer, Wine, and Spirits in Canada and the Fallout of the Trade War.” Southern Ag Today 6(15.4). April 9, 2026. Permalink

  • U.S.-Indonesia Trade Agreement Framework

    U.S.-Indonesia Trade Agreement Framework

    Authors Landyn K. Young and Luis Ribera

    Another trade agreement framework was announced by the White House a few weeks ago, this time with Indonesia. The released statement explains that tariffs on 99 percent of exports from the United States to Indonesia will be removed, as well as addressing non-tariff barriers. In exchange, tariffs will remain at 19 percent for imports from Indonesia. U.S. agricultural imports from Indonesia reached $7.14 billion in 2025, with exports to the country lagging behind at $2.89 billion, which makes Indonesia the 9th largest source of U.S. agricultural imports and 12th largest export destination. 

    Graph 1. U.S.-Indonesia Agricultural Trade, 2020-2025

    Source: Global Agricultural Trading System (GATS), USDA/FAS

    Exports to Indonesia are dominated by oilseeds which makeup over a third of agricultural export value at $1.14 billion. An additional $752 million of exported products were grains and feed. Dairy products accounted for $221 million of the $454 million of animal products exported to Indonesia. Following these main groups are cotton ($146 million), ag chemicals ($58 million), and fish ($55 million).

    Graph 2. U.S. Agricultural Exports to Indonesia, 2025

    Source: Global Agricultural Trading System (GATS), USDA/FAS

    On top of being the most exported agricultural category, oilseed products led imports from Indonesia. Palm oil and palm kernel oil together made up $2.03 billion of the $3.11 billion in oilseed product imports. Fish, primarily shellfish, accounted for a quarter of agricultural imports with $1.86 billion in imports, followed by cocoa and coffee. Overall, Indonesia seems like a very promising market for agricultural products.

    Graph 3. U.S. Agricultural Imports from Indonesia, 2025

    Source: Global Agricultural Trading System (GATS), USDA/FAS

    Sources

    Foreign Agricultural Service (FAS). Global Agricultural Trade System (GATS). Online database. Online public database accessed February 2025.

    The White House. “Fact Sheet: Trump Administration Finalizes Trade Deal With Indonesia.” February 19, 2025. https://www.whitehouse.gov/fact-sheets/2026/02/fact-sheet-trump-administration-finalizes-trade-deal-with-indonesia/.


    Young, Landyn K., and Luis Ribera. “U.S.-Indonesia Trade Agreement Framework.Southern Ag Today 6(13.4). March 26, 2026. Permalink

  • U.S. Agricultural Export Trends: Stability, Growth, and a China‑Driven Rollercoaster

    U.S. Agricultural Export Trends: Stability, Growth, and a China‑Driven Rollercoaster

    Now that the December 2025 trade data have been released, we can look back over the past fifteen years to evaluate how U.S. agricultural exports have evolved across major markets and how shifting global dynamics, especially the dramatic rise and subsequent decline of exports to China, have shaped overall performance. U.S. agricultural exports from 2010 through 2025 reveals a story of both stability and notable volatility. Total agricultural exports rose from $119 billion in 2010 to a high of $196 billion in 2022, before settling at $171 billion in 2025. Exports in 2025 were more than $5.0 billion lower than the previous year, driven primarily by reduced soybean shipments, along with declines in coarse grains, beef, wine, and rice. Much of the variation in U.S. agricultural trade can be traced to the dramatic rise and fall of U.S. exports to China, a market that transformed from the leading U.S. destination to a source of sharp decline. Indeed, the widening U.S. agricultural trade deficit, which grew from –$37.6 billion in 2024 to –$41.7 billion in 2025, stems largely from the steep collapse in exports to China (USDA, 2026). 

    Figure 1 shows U.S. agricultural exports to the major destinations—China, Mexico, Canada, the European Union, and Japan. With the exception of China, most major U.S. export markets exhibit steady or gradually increasing demand, even during periods of heightened trade tensions and uncertainty. However, it’s hard to ignore the extremely volatile path of U.S. agricultural exports to China. Beginning at $18 billion in 2010, exports to China climbed substantially, peaking at $38 billion in 2022, primarily due to rising exports from the Phase One Trade Agreement and relatively high commodity prices. However, exports to China have significantly declined since, falling to just $8 billion in 2025, representing a loss of $30 billion in only three years. No other major market exhibits such a rollercoaster pattern. This deterioration also helps explain why total U.S. exports fell from $196 billion in 2022 to $171 billion in 2025, despite persistent exports elsewhere.

    In contrast, exports to nearly every other major destination remained stable or even trended upward. Mexico increased from $15 billion in 2010 to $31 billion in 2025. Canada remained consistently strong, rising from $18 billion to $28 billion over the same period. The EU and Japan both show moderate, incremental increases, with none experiencing sharp swings comparable to China. Overall, recent trends illustrate two simultaneous dynamics: the inherent volatility of U.S. agricultural trade with China and the remarkable stability of U.S. exports to virtually every other major market. While the collapse in Chinese demand resulted in a noticeable drop in total exports after 2022, the resilience of other destinations helped buffer the decline. These trends highlight both the opportunities and the vulnerabilities that come with relying heavily on a single, now‑unpredictable trading partner.

    Figure 1. U.S. Agricultural Exports to the Top Destination Markets: 2010–2025

    Source: U.S. Department of Agriculture, Foreign Agricultural Service, Global Agricultural Trade System (GATS) (USDA, 2026)

    Reference

    U.S. Department of Agriculture (USDA) (2026). Global Agricultural Trade System. Foreign Agricultural Service. https://apps.fas.usda.gov/gats/default.aspx


    Muhammad, Andrew. “U.S. Agricultural Export Trends: Stability, Growth, and a China‑Driven Rollercoaster.Southern Ag Today 6(11.4). March 12, 2026. Permalink

  • When China Stops Buying: Is this the New Reality for U.S. Cotton?

    When China Stops Buying: Is this the New Reality for U.S. Cotton?

    U.S. cotton is among the most export‑dependent agricultural commodities, with more than 80% of annual production moving into global markets rather than being used domestically (U.S. Department of Agriculture, 2026a). Although China has not always been a consistent buyer, importing less than 15% of U.S. cotton exports in some years and more than 30% in other years, it has nevertheless remained a somewhat reliable partner, accounting for nearly 30% of U.S. cotton exports in more recent years (2020–2024) (U.S. Department of Agriculture, 2026b). 

    Once the most important market for U.S. cotton, China has become a far less reliable partner in 2025, as recent import patterns show greater volatility and reduced engagement with the U.S. agricultural sector. In 2025, China’s purchases of U.S. cotton fell from $1.5 billion to just $0.2 billion, an 85% decline, while its import volume dropped at nearly the same rate, from 0.8 million metric tons (MMT) to 0.1 MMT. In contrast, exports to markets outside China expanded substantially over the same period. The value of U.S. cotton exports to non‑China destinations rose from $3.5 billion to $4.6 billion, a 32% increase, while quantities surged 51%, from 1.7 MMT to 2.6 MMT (Table 1) (U.S. Department of Agriculture, 2026b). 

    Why did China sharply reduce its imports of U.S. cotton? While the trade war and subsequent political tensions certainly accelerated the decline, the underlying shift runs deeper than tariffs. China’s overall import strategy has fundamentally changed as its domestic cotton sector has undergone major structural adjustments since 2010. Over the past decade, China has increased production, drawn down its massive state-held stockpiles, and reduced its dependence on foreign fiber. Since 2021 alone, domestic output has risen by more than 30% (U.S. Department of Agriculture, 2025a). As a result, China is increasingly able to meet the needs of its textile and apparel industry with domestic cotton rather than imports. Taken together, these developments suggest that China’s reduced reliance on U.S. cotton is not simply a temporary response to trade tensions but part of a longer-term realignment. 

    Table 2 makes clear that the steep decline in U.S. cotton exports to China was not simply the result of tariffs or bilateral tensions, but part of a much broader contraction in China’s overall import demand. China’s total cotton import value fell from $5.3 billion in 2024 to $1.9 billion in 2025, while import volumes dropped from 2.6 million to 1.1 million metric tons. Every major supplier experienced significant losses: Brazil’s shipments fell by more than 50%, India’s collapsed by over 90%, and Australia also recorded substantial reductions.

    The across‑the‑board declines underscore a structural shift in China’s sourcing strategy rather than a U.S.-specific outcome.

    Table 1. U.S. Cotton Exports: 2024 and 2025

     20242025Change% Change
    Value ($ billion)
    China$1.5$0.2-$1.3-85.1%
    Total (w/o China)3.54.61.132.0%
    Total (w/ China)5.04.8-0.1-2.8%
    Quantity (million metric tons)
    China0.80.1-0.6-84.6%
    Total (w/o China)1.72.60.951.0%
    Total (w/ China)2.52.70.29.6%
    Source: U.S. Department of Agriculture (2026b)

    Table 2. China’s Cotton Imports (Major Exporting Countries): 2024 and 2025

    20242025Change % Change
     Value ($ billion)
    Total$5.3$1.9-$3.4-63.6%
    Brazil2.20.8-1.4-63.4%
    U.S.1.90.2-1.6-87.8%
    Australia0.70.6-0.1-13.8%
    India0.10.0-0.1-91.1%
    Turkey0.10.10.03.7%
    Quantity (million metric tons)
    Total2.61.1-1.5-59.2%
    Brazil1.10.5-0.6-57.8%
    U.S.0.90.1-0.8-86.8%
    Australia0.30.30.00.2%
    India0.10.0-0.1-90.9%
    Turkey0.10.10.0-4.1%
    Source: Trade Date Monitor®(2026) 

    References

    Trade Data Monitor®. (2026). https://tradedatamonitor.com/

    U.S. Department of Agriculture (USDA) (2026a). PSD Online. Foreign Agricultural Service. https://apps.fas.usda.gov/psdonline/app/index.html#/app/advQuery

    U.S. Department of Agriculture (USDA) (2026b). Global Agricultural Trade System. Foreign Agricultural Service. https://apps.fas.usda.gov/gats/default.aspx


    Muhammad, Andrew. “When China Stops Buying: Is this the New Reality for U.S. Cotton?Southern Ag Today 6(9.4). February 26, 2026. Permalink

  • How 2025 IEEPA Tariffs Affected Agricultural Inputs and Production Costs

    How 2025 IEEPA Tariffs Affected Agricultural Inputs and Production Costs

    Authors : Jiyeon Kim, Junior Research Economist- Agricultural Risk Policy Center, North Dakota State University

    Andrew Muhammad, Ph.D. Professor and Blasingame Chair of Excellence, University of Tennessee Institute of Agriculture- Department of Agricultural and Resource Economics

    In 2025, the President imposed a series of tariffs under the International Emergency Economic Powers Act (IEEPA), reshaping U.S. trade policy. These measures, ranging from fentanyl‑related tariffs in February to broad reciprocal tariffs implemented in April, generated an estimated $130 billion in revenue by early December with implications for multiple sectors, including agriculture. Agricultural inputs such as fertilizer, pesticides, seeds, and farm machinery were subject to these duties, resulting in roughly $1.1 billion in tariff collections between February and November. Although representing small shares of total farm input spending, these tariffs contribute to rising production costs throughout the supply chain (Arita et al., 2026). We provide a brief discussion of these tariffs in this article; a more detailed analysis is presented in IEEPA Fertilizer Tariffs: Revenue, Relief, and Pass‐Through at the following link: https://ageconsearch.umn.edu/record/387621?v=pdf.

    IEEPA tariffs have been imposed on several agricultural inputs including fertilizer, pesticides, seeds, and farm machinery, against a backdrop of already volatile input prices and low commodity prices. Based on import data from the U.S. International Trade Commission and tariff rates specified in executive orders, IEEPA tariff revenue collected on agricultural input imports is estimated at roughly $1.1 billion between February and November 2025 (see Figure 1). To provide some context, USDA projects that U.S. farmers will spend about $27.2 billion on seed, $20.6 billion on pesticides, and $33.5 billion on fertilizers in 2025 (Arita et al., 2026). The tariff revenue collected on these products accounts for approximately 0.2% of seed spending, 1.5% of pesticide costs, and 0.4% of fertilizer costs. Although these shares appear relatively small, they do not fully capture the broader cost pressures facing producers. The tariffs on materials such as steel, aluminum, and machinery components may raise additional costs for U.S producers across the supply chain. 

    Figure 2 shows the estimated monthly IEEPA tariff revenue by agricultural input category from January through November 2025. While tariff revenue for most agricultural inputs changed modestly, revenue from imported farm machinery rose sharply following the implementation of the 10% baseline tariff in April. This increase was driven primarily by imports from China and India.

    Although tariff revenues on key inputs represent a relatively small share of farm expenditures, they contribute to a broader rise in production costs, particularly when combined with duties on steel, aluminum, and machinery components. Continued monitoring is essential as these policies evolve and their cumulative impacts unfold.

    Figure 1. Estimated Total IEEPA Tariff Revenue (February-November, 2025)

    Figure 2. Estimated Monthly IEEPA Tariff Revenues for Agricultural Inputs in 2025


    References

    Arita, S., Chakravorty, R., Kim, J., Lwin, W., Steinbach, S., Wang, M., and Zhuang, X. (2026). IEEPA Fertilizer Tariffs: Revenue, Relief, and Pass‐Through. NDSU Agricultural Trade Monitor 2026‐01. Center for Agricultural Policy and Trade Studies, North Dakota State University. January 19, 2026. https://doi.org/10.22004/ag.econ.387621


    Kim, Jiyeon, and Andrew Muhammad. “How 2025 IEEPA Tariffs Affected Agricultural Inputs and Production Costs.Southern Ag Today 6(7.4). February 12, 2026. Permalink http