
Farmers in the Midsouth region are faced with several choices when planting and marketing their crops. The type of rental agreement can have a variety of impacts on a Midsouth farmer, particularly in terms of returns to cash operating expenses (or variable costs). For example, a farmer operating under a crop share agreement may require higher yields to cover variable costs than one operating under a cash rent agreement. This article highlights the breakeven potential for rice, corn, and soybeans under three land ownership scenarios: cash rent, 75-25 crop share agreement, and fully owned land. Understanding breakeven curves allows farmers to evaluate the minimum yield (or price) needed to cover costs under each agreement, an essential step in managing economic risk and optimal crop choice. The analysis aims to help Midsouth farmers understand their cost structure and to support more informed marketing decisions within the context of alternative rental agreements.
The assumptions used to calculate breakeven values are given in Table 1 below. The listed Midsouth expenses represent estimated production expenses per acre for each crop; operating expenses do not include fixed overhead and other non-cash expenses such as depreciation. Breakeven combinations that exceed operating expenses do not include non-cash costs such as depreciation. Crop share agreements are assumed to follow a 75-25 split, with the landowner receiving 25% of the revenue and not contributing to production expenses. The cash rent value is an average derived from county-level estimates for irrigated farmland across the Midsouth region. We assume no associated land costs for the owned land scenario.
Table 1. Breakeven Curve Assumptions
| Crop | Estimated Cash Operating Expenses | Crop Share | Cash Rent | 2025 USDA-RMA Harvest Price |
| Corn | $806 | 75-25 | $152 | $4.65 |
| Soybean | $510 | 75-25 | $152 | $10.51 |
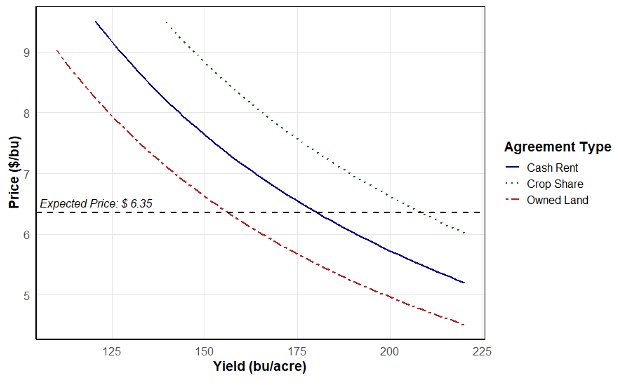
| Rice | $993 | 75-25 | $152 | $6.35 |
Figures 1 – 3 show the breakeven curves for Midsouth corn, soybean, and rice production. These curves plot the price and yield combinations necessary to cover total cash operating expenses, as defined in Table 1. Any price and yield point below the curve indicates a crop revenue that does not cover cash operating expenses, while points above the curve indicate positive returns above cash operating expenses. To provide context for current market expectations, the 2025 USDA-RMA expected harvest price for Arkansas is plotted on each graph. Across all three crops, the owned land scenario consistently requires the lowest price/yield combination to break even, while crop share requires the highest combination. For instance, Figure 1 shows the breakeven curves for Midsouth corn production. At the expected harvest price of $4.65, the target breakeven yield under full ownership, cash rent, and crop share is 173 bu/acre, 206 bu/acre, and 231 bu/acre, respectively. In simple terms, land tenure arrangements with higher expense obligations require either higher yields, higher market prices, or a combination of both to cover variable costs (Mills, 2023). The implication is that cash rent and land ownership are progressively more profitable than crop share. However, it is important to remember that there are things to consider beyond cash operating expenses. Specifically, both cash rent and owned land require the producer to bear a higher level of production risk, and land ownership requires the cost of capital investment.
Figure 1. Midsouth Corn Breakeven Curves at an estimated $806/acre cash operating expense.

Figure 2. Midsouth Soybean Breakeven Curves at an estimated $510/acre cash operating expense.
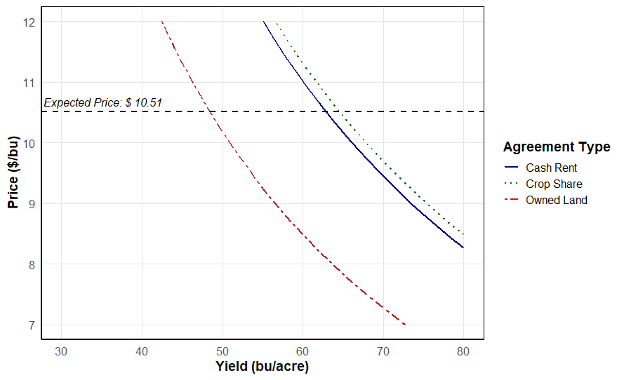
Figure 3. Midsouth Rice Breakeven Curves at an estimated $993/acre cash operating expense.
References
Mills, Brian. “Forage Cost of Production and Breakeven Curves.” Southern Ag Today. July 19, 2023. https://southernagtoday.org/2023/07/19/forage-costs-of-production-and-breakeven-curves/
United States Department of Agriculture. (2024). Cash Rents County Estimates. Retrieved April 3, 2025, from https://www.nass.usda.gov/Surveys/Guide_to_NASS_Surveys/Cash_Rents_by_County/
United States Department of Agriculture – Risk Management Agency. (2025). Harvest Price Discovery. Retrieved April 7, 2025, from https://public-rma.fpac.usda.gov/apps/PriceDiscovery
Loy, Ryan. “Breakeven Curves Under Different Midsouth Rental Agreements.” Southern Ag Today 5(17.1). April 21, 2025. Permalink
Leave a Reply