
In recent months, there have been Southern Ag Today articles discussing the impacts of tight fed cattle supplies on prices, cattle on feed, slaughter weights, and total beef production (Anderson 2025a, Anderson 2025b, Maples 2025). Each of the articles mentioned has highlighted the unique and historical differences between the current market and years past. One aspect that has not been covered, but is important, is slaughter capacity utilization (CU). In Martinez et al. (2023), we show how we measure slaughter capacity utilization, which measures the ratio of operational cattle slaughter capacity over physical capacity. Figure 1 displays the monthly national federally inspected (FI) slaughter capacity utilization.
Figure 1. Monthly National Federally Inspected Slaughter Capacity Utilization
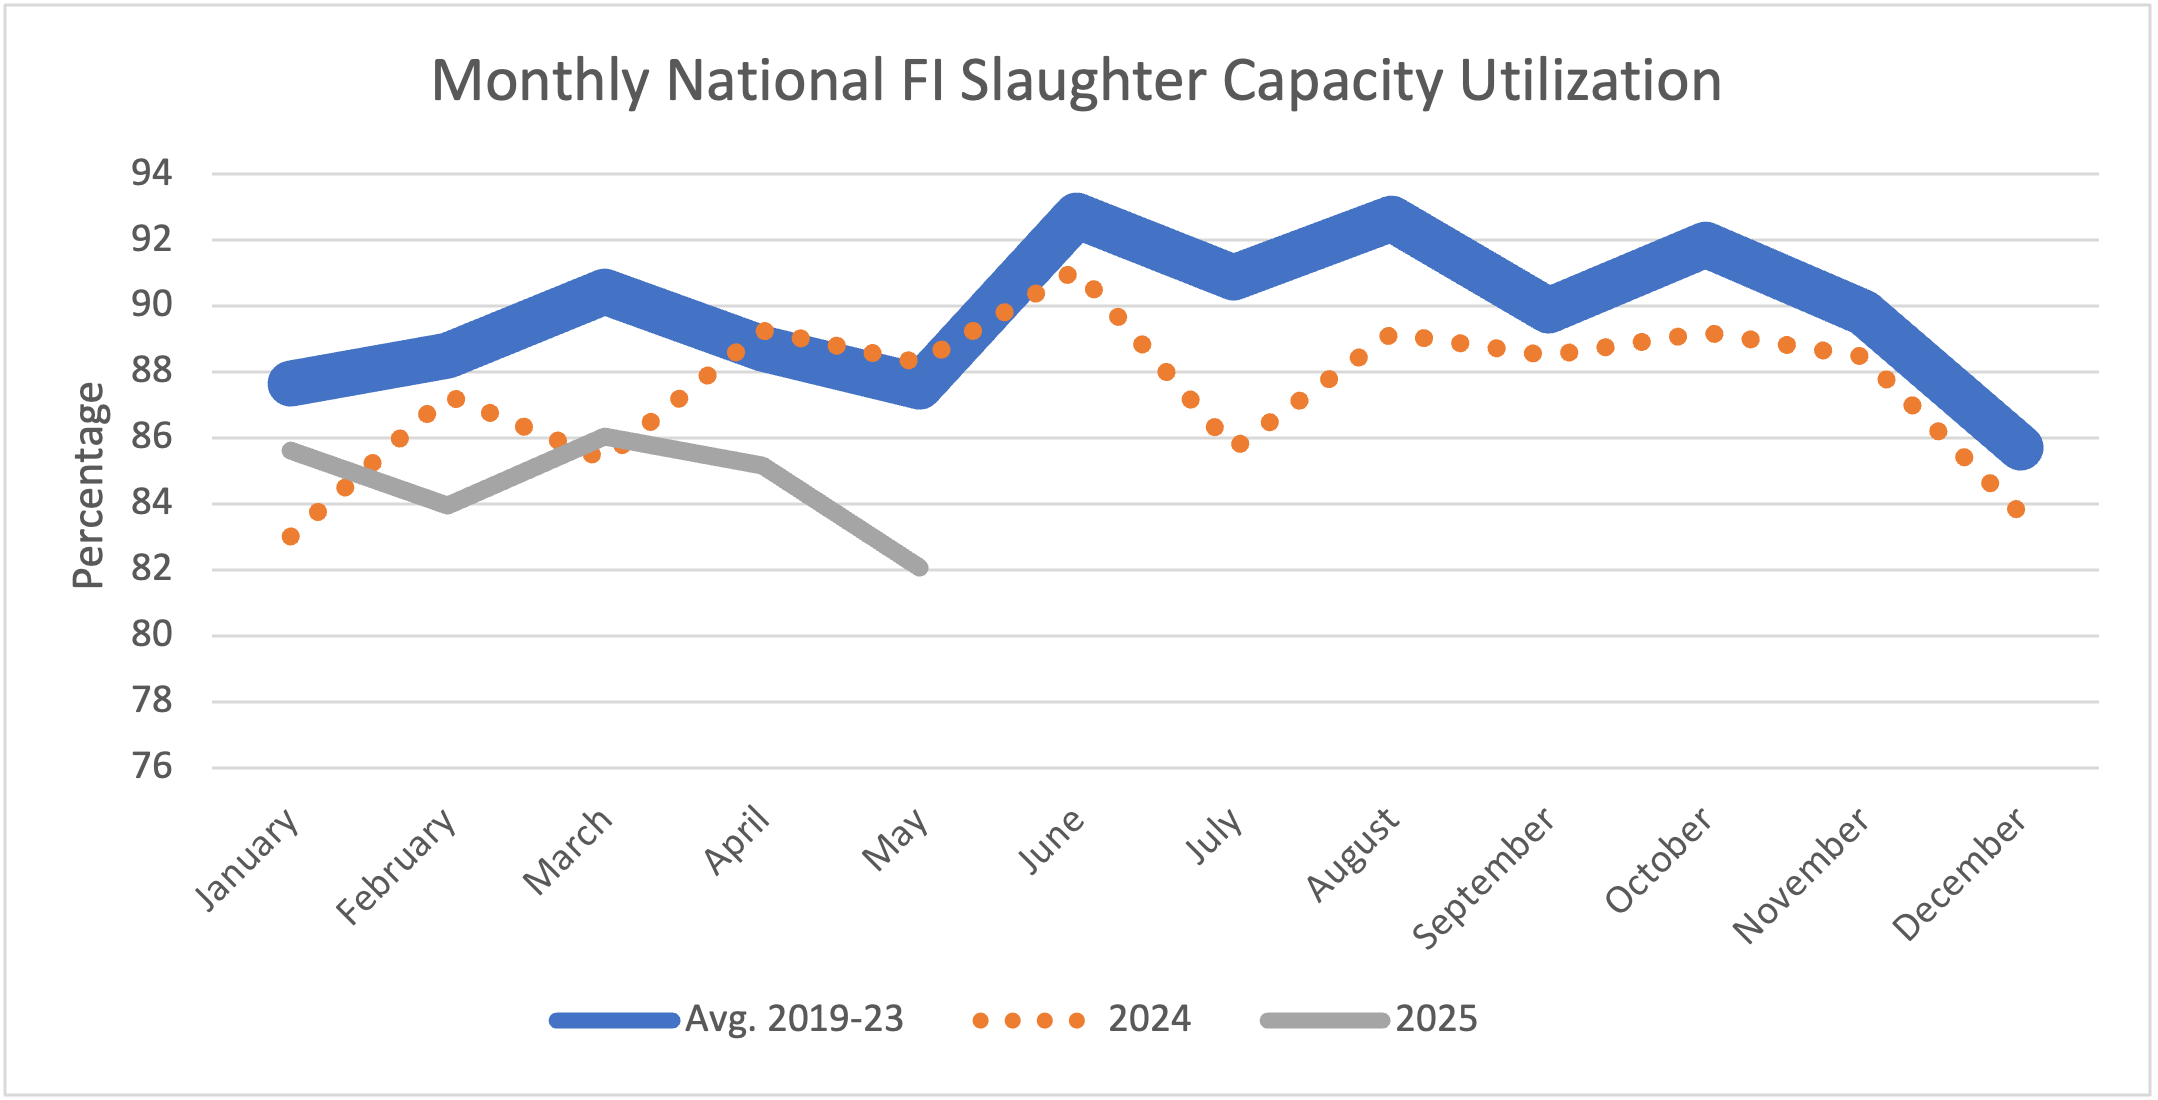
In May, slaughter capacity utilization averaged 82%, which was lower than May 2024 (88.29%), and the previous 5-year average (87.56%). Additionally, through the first five months of 2025, capacity utilization averaged 84.57%, which is lower than the same time frame last year (86.64%), and the previous 5-year average (88.57%). Historically, in March and April, the ramp up of slaughter for grilling season occurs, followed by a decrease for 1 to 2 months. Thus, the decrease this year from March (86.06%) to May was expected.
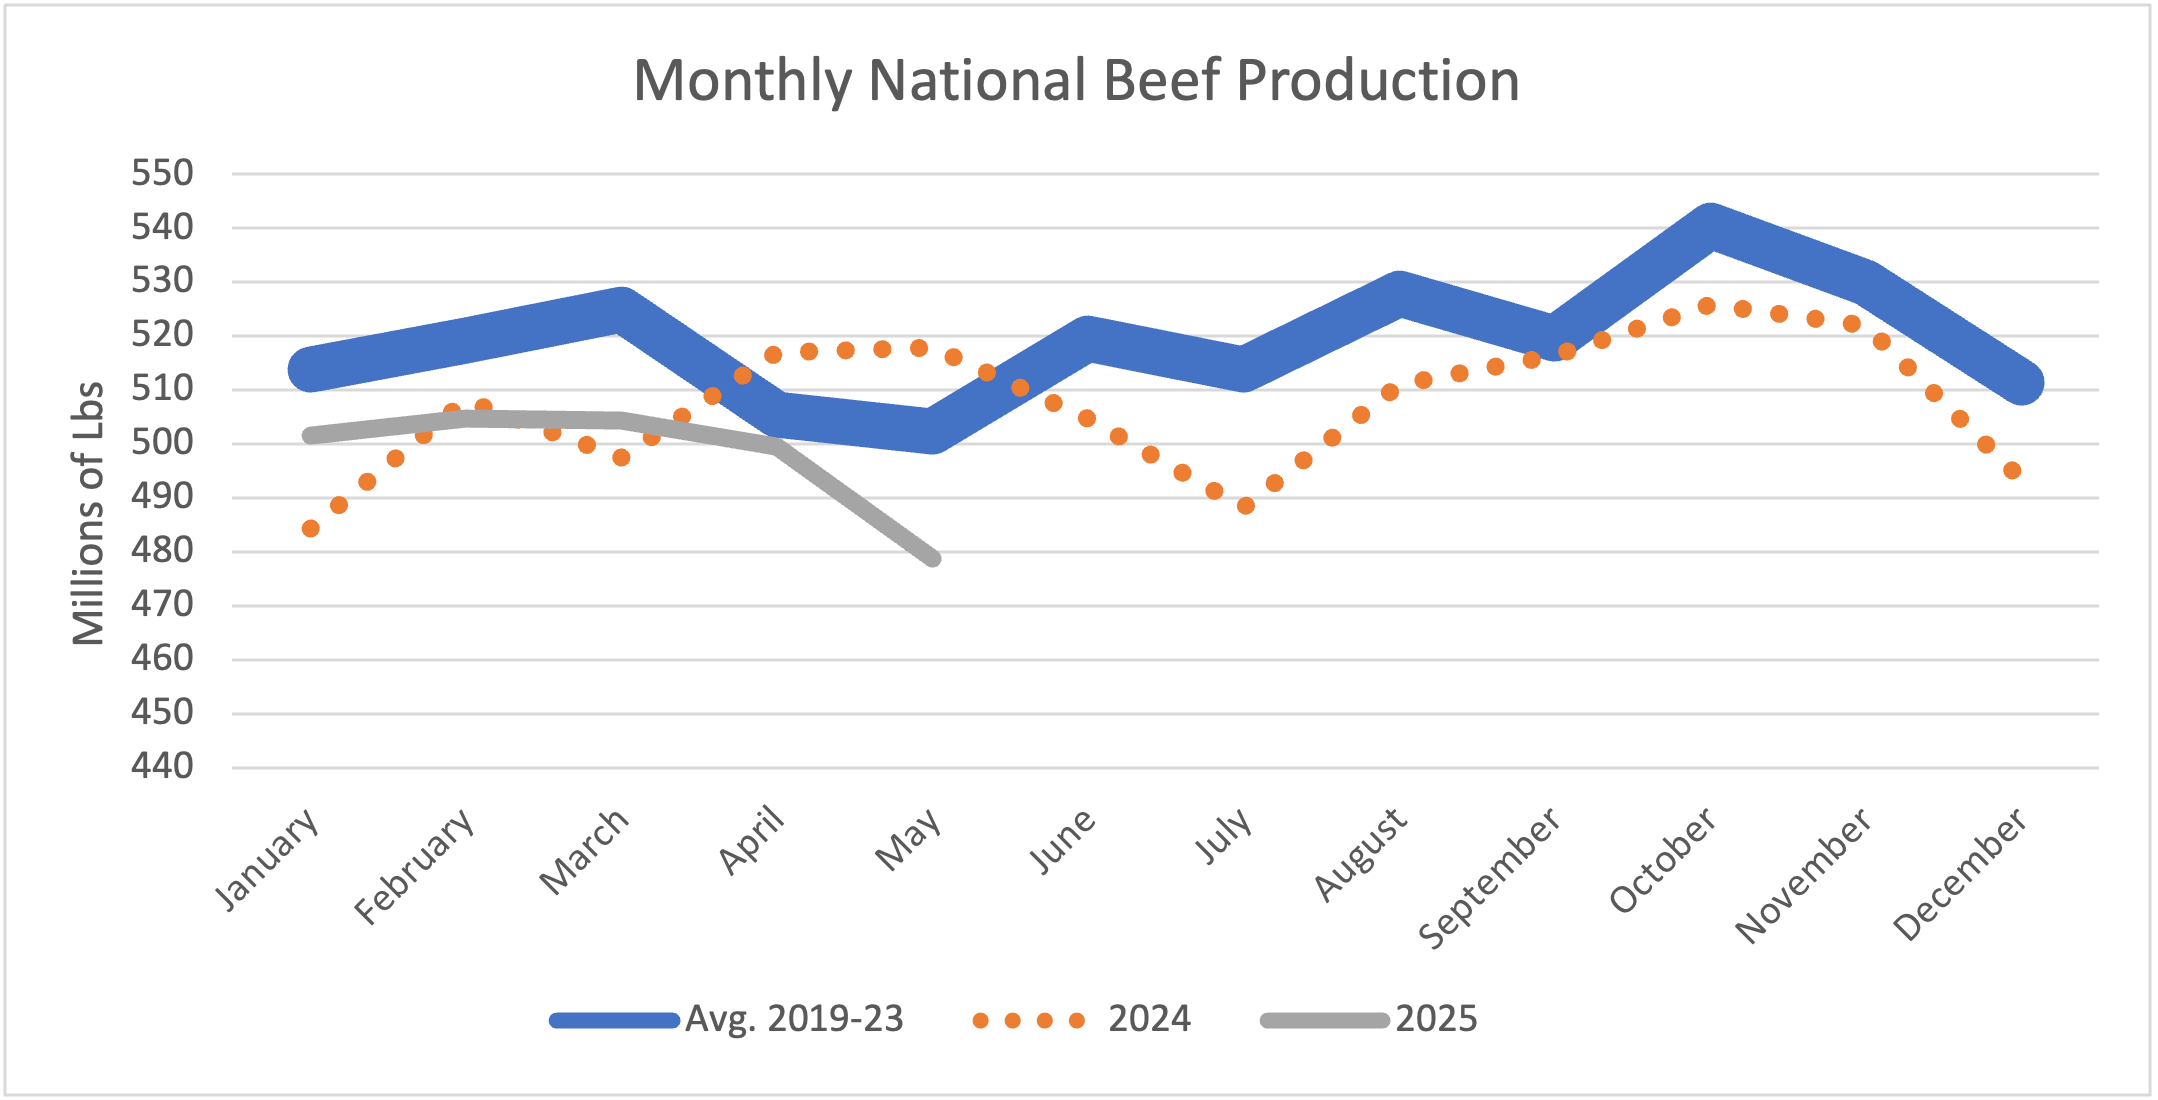
While May’s utilization is down 8.29% compared to May 2024, commercial beef production (figure 2) in May was down 7.53% compared to May 2024 and down 4.67% compared to the previous 5-year average. Through May, total commercial production is averaging 497.8 million pounds per month, which is also lower when compared to 2024 (504.95 million pounds per month) and the previous 5-year average (513.12 million pounds per month). When comparing total production, 2025 production is 1.33% lower than last year and 2.98% lower than the previous 5-year average.
Figure 2. Monthly National Commercial Beef Production
Overall, the decline in 2025 capacity utilization compared to last year (down 2.07%) and the previous 5-year average (down 4%) is larger than the decline in total production compared to last year (down 1.33%) and the previous 5-year average (down 2.98%). Therefore, the increasing utilization difference between 2024 and 2025 signals the impact and realization of the tight supplies on capacity utilization. However, the supply chain is offsetting the tight supplies with larger carcasses and has led to market signals to have lower discounts for heavier cattle while operating at lower capacity utilization. As we get into the second half of the year, it will be interesting to see where capacity utilization and slaughter weights measure given even tighter supplies based on the latest Cattle on Feed reports.
References
Anderson, David. “Fewer Marketings, Tighter Beef Supplies.” Southern Ag Today 5(26.2). June 24, 2025.
Anderson, David. “Working Less on Friday!” Southern Ag Today 5(21.2). May 20, 2025.
Maples, Josh. “Cattle Prices Hit New Highs and Carcass Grading Trends Over Time.” Southern Ag Today 5(19.2). May 6, 2025.
Martinez, C., Li, P., Boyer, C. N., Yu, T. E., & Maples, J. G. (2023). Beef price spread relationship with processing capacity utilization. Journal of the Agricultural and Applied Economics Association.https://onlinelibrary.wiley.com/doi/full/10.1002/jaa2.48
Leave a Reply