U.S. Production and Harvest Acres
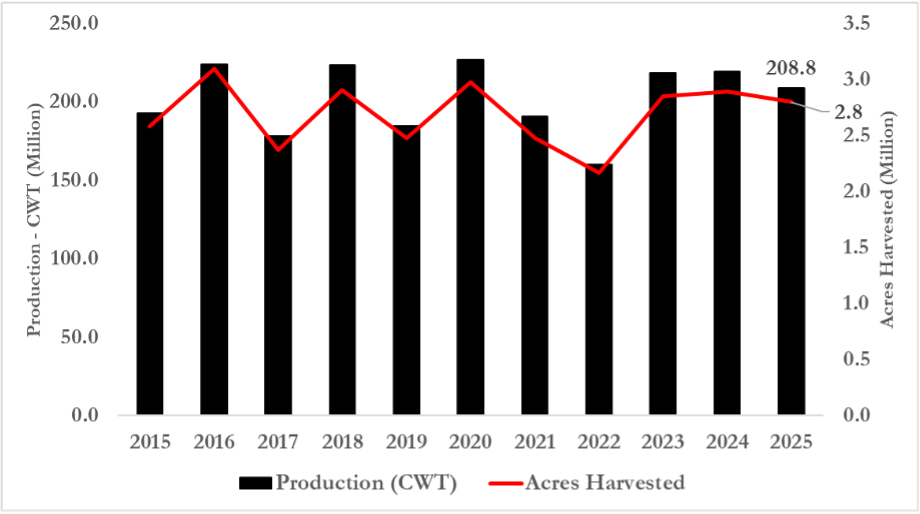
The 2025 planting season was marked by considerable challenges. Farmers in the Midsouth faced historical flooding in April that forced replanting across a significant portion of the Mississippi delta region. As farmers put planting behind them, the growing season brought extreme heat and a prolonged drought. In contrast, California experienced a relatively normal year with ideal planting temperatures and no surface water allocation issues (USA Rice, 2025). Even with California’s improved season, the production setbacks in the Mississippi delta region offset those gains, and, as a result, U.S. rice production is expected to decline roughly 10 million cwt from 2024 levels, falling to 208.8 million cwt in 2025 (Figure 1). Over the past decade, production has fluctuated between 160 and 230 million cwt, with acreage shifting between 2 – 3 million acres. Peaks in 2016, 2018, and 2020 reflect the typical crop rotation across the midsouth. However, with high input costs and weaker rice prices, 2022 marked a contraction in production at 160 million cwt. Production has since recovered, due in part to more favorable returns for a rice crop compared to other Midsouth commodities such as corn or cotton.
Figure 1. U.S. All Rice-Class Production and Acres Harvested (2015 – 2025F)

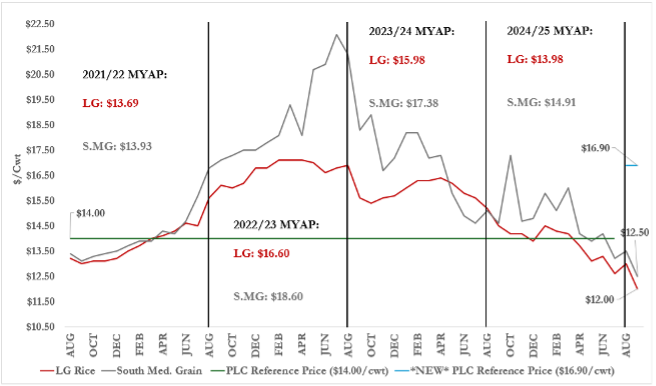
The September 2025 World Agricultural Supply and Demand Estimates (WASDE) report forecasts a 35% year-over-year increase in all rice-class beginning stocks. This increase in beginning stocks is almost entirely driven by the 93% year-over-year increase for long grain, the result of record yields across the southern region in 2024, with Arkansas averaging 169.8 bu/acre (UADA-CES, 2025). On the other hand, medium grain is forecasted to fall by 27.5%. The current outlook is for a slight rise in overall exports and a relatively minor decrease (~0.9%) in ending stocks relative to 2024/25 (USDA-AMS, 2025). Ending stocks are currently forecasted at 53.4 million cwt, compared to 2024/45, which was 53.9 million cwt. The USDA anticipates long-grain rice exports will reach 64 million cwt, a level that hinges on maintaining price competitiveness in global markets. As a result, farm prices for long-grain rice are forecast to decline to $12.00/cwt, while the prices for Southern medium & short-grain rice are forecast at $12.50/cwt (Figure 2). These expectations represent a severe decline from the 2024/25 marketing year, with long grain and Southern medium & short grain prices falling 14% and 18%, respectively. It’s worth noting that the effective reference price has increased from $14.00/cwt to $16.90/cwt for the 2025/26 marketing year (One Big Beautiful Bill Act, 2025). Figure 2 highlights this change, showing that current forecasts indicate a possible PLC payment under the new effective reference price.
Figure 2. Rice Marketing Year Average Farm Prices (2021/22 – 2025/26F)

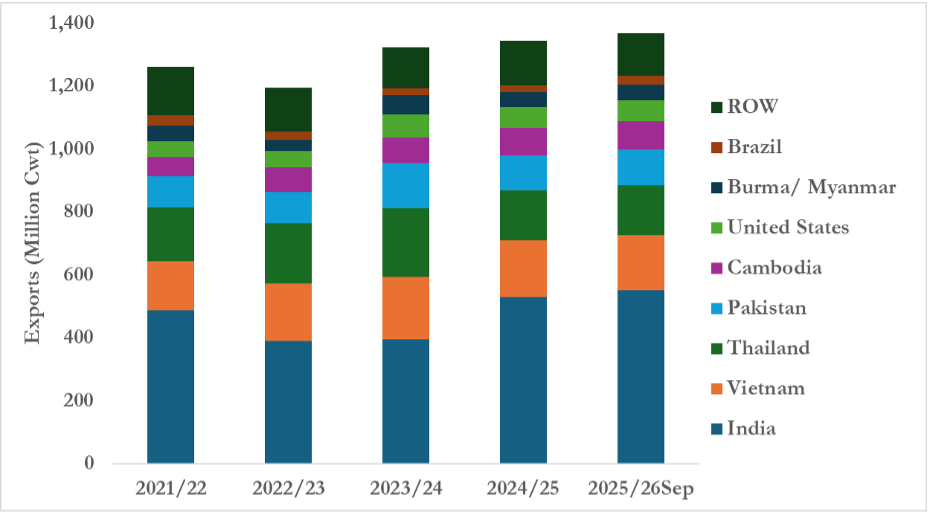
Figure 3 highlights a modest increase in exports across major rice-supplying countries. However, global rice prices have trended downward throughout 2025, primarily due to weaker global demand, India resuming rice exports, much lower import demand from Indonesia, and a temporary ban on rice imports in the Philippines, which is expected to lift in November (USDA-FAS, 2025). U.S. long-grain rice is currently priced around $585/ton[1], which represents the most expensive rice on the world market. In contrast, India, Pakistan, and Thailand are all competing for the cheapest rice on the market, priced at around $360/ton. The broad decline in the world rice price has been from India’s decision to lift its rice export ban in September 2024. Nearly a year later, Indian exports continue to exert downward pressure on international markets.
Figure 3. Milled Rice Exports (2021/22 – 2025/26Sept)

[1] This price reflects #2, 4-percent brokens, sacked FOB, Gulf Coast (Childs and Abadam, 2025)
References
Childs, N., and Abadam, V. (2025). Rice Outlook: September 2025 (Report No. RCS-25H). U.S. Department of Agriculture, Economic Research Service. Retrieved September 2025, from, https://downloads.usda.library.cornell.edu/usda-esmis/files/dn39x152w/j9604180m/w0894b61f/RCS-25H.pdf
University of Arkansas – Cooperative Extension Service. (2025). Rice Production in Arkansas. Division of Agriculture. Retrieved September 2025, from, https://www.uaex.uada.edu/farm-ranch/crops-commercial-horticulture/rice/#:~:text=In%202024%2C%20Arkansas%20rice%20producers,lb%2Facre)%20in%202021.
United States Department of Agriculture, Agricultural Marketing Service. (2025). World Agricultural Supply and Demand Estimates (WASDE-664). Retrieved September 15, 2025, from, https://www.usda.gov/oce/commodity/wasde/wasde0925.pdf
United States Department of Agriculture, Foreign Agricultural Service – PSD Reports. (2025). World Rice Trade. Retrieved September 12, 2025, from, https://apps.fas.usda.gov/psdonline/app/index.html#/app/downloads
United States Department of Agriculture, National Agricultural Statistics Service. (2025). Rice Production and Acres Harvested. Retrieved September 2025, from, https://quickstats.nass.usda.gov/
USA Rice. (2025). Spring Planting Report. Retrieved September 2025, from, https://www.usarice.com/news-and-events/publications/usa-rice-daily/article/usa-rice-daily/2025/04/25/spring-planting-report
Loy, Ryan, and Alvaro Durand-Morat. “2025/26 Rice Market Outlook.” Southern Ag Today 5(40.3). October 1, 2025. Permalink

Leave a Reply