Distilled spirits fall into six main categories: whiskey (which includes bourbon), vodka, rum, gin, tequila, and brandy. Each is defined by its key ingredient, for example, rum is produced from sugarcane, brandy from grapes, and whiskey from corn and other grains. Production methods, geography, and legal requirements also help in defining these categories. Tennessee Whiskey and Kentucky Bourbon are iconic American spirits, elevating these states to leading exporter status.
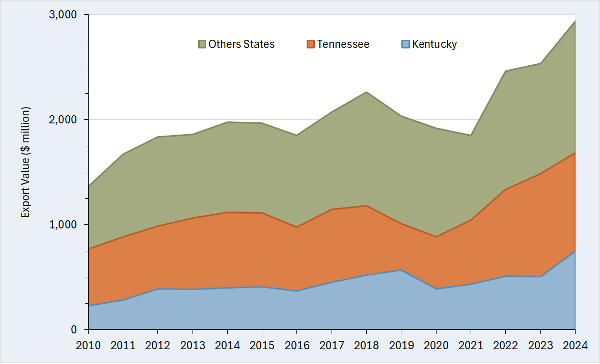
American distilled spirits enjoy global popularity and are among the nation’s top agricultural exports. Despite disruptions from the 2018 trade war and the COVID-19 pandemic, exports have shown a steady upward trend reaching almost $3.0 billion in 2024 (Figure 1). Tennessee and Kentucky lead the nation in distilled spirits exports, consistently ranking first and second among exporting states, respectively. While distilled spirits make up approximately 2% of total agricultural exports nationwide, they dominate sales in both states, accounting for 36% of Tennessee’s and 48% of Kentucky’s agricultural exports in 2024. That year, Tennessee exported over $900 million worth of distilled spirits, while Kentucky shipped around $750 million, together comprising more than half of the country’s total distilled spirits export revenue. For comparison, Texas, the third-largest exporting state, had around $350 million in distilled spirits exports in 2024.
Both Canada and the EU have been embroiled in the recent trade actions by the Trump Administration. In response, both countries have either implemented or proposed retaliatory tariffs on U.S. good including distilled spirits. What is at stake if Canada and the EU impose retaliatory tariffs on American distilled spirits?
Because retaliatory tariffs could seriously impact distilled spirits, disrupting export sales, economic activity, and job stability, it is essential to evaluate what is at risk. Our research shows that although export sales to the EU and Canada for the two states combined average around $760 million annually from 2022-2024, the totaled economic impact was over $1.2 billion and nearly 3,000 jobs. These findings highlight how distilled spirits exports create a ripple effect, influencing employment, tax revenue, and business activity across multiple sectors in Tennessee and Kentucky. If Canada or the EU were to impose tariffs on U.S. distilled spirits, it could lead to reduced exports, affecting the economic stability of distilleries and related industries. This could result in job losses, decreased income for workers, and lower tax revenues, ultimately harming the regional economy.
Figure 1. U.S. Distilled Spirits Exports (Tennessee, Kentucky, and Other States): 2010 – 2024
Source: Reprinted from forthcoming article in Choices. See the reference list.
For More Information
Muhammad, A., R.J. Menard, S.A. Smith (2025) “Tennessee and Kentucky distilled spirits: What’s at stake from a new trade war?” Choices (In Press).
The Tomato Suspension Agreement (TSA) between the U.S. and Mexico, first established in 1996, was designed to regulate the importation of Mexican tomatoes. This agreement emerged from an antidumping investigation aimed at determining whether imports of fresh tomatoes from Mexico were being sold at less than fair market value. Under the TSA, Mexican tomato producers agreed to sell fresh tomatoes in the U.S. market at set reference prices, and in return, the U.S. suspended the antidumping duty investigation. The first suspension agreement became effective in November 1996. Over the years, the U.S. Department of Commerce and Mexican signatories have entered into revised suspension agreements in 2002, 2008, and 2013, with the most recent becoming effective in September 2019 (Federal Register, 2019).
On April 14, 2025, the U.S. Department of Commerce announced its intent to withdraw from the 2019 Agreement, citing its failure to protect U.S. producers from “unfairly” priced Mexican tomatoes. Upon termination—effective in 90 days—antidumping duties of around 21% will be imposed on most Mexican tomatoes (Spiegelman, 2025). This decision could have a significant impact on imports, benefiting domestic producers. However, these duties (i.e., tariffs) could also reduce the economic activity associated with tomato supply chains and increase consumer prices.
The basic premise of an antidumping investigation is to determine whether imported goods are being sold in the U.S. market at less than fair value, often referred to as “dumping.” This practice can harm domestic producers by depressing local prices and causing financial distress. Concerns about imports of Mexican tomatoes have been driven by a significant surge in imports over the last two decades. Since 1995, imports from Mexico have grown by nearly 700% in value, from $406 million in 1995 to $3.1 billion in 2024. In terms of quantity, imports from Mexico have increased by around 220% (USDA-FAS, 2025).
What is even more concerning is that this growth occurred even as U.S. production declined, and per capita availability increased. In 1995, the year prior to the agreement, domestic tomatoes accounted for over 70% of the total U.S. supply. This situation has now completely reversed, with imported tomatoes accounting for 70% of the total U.S. supply in 2025 (USDA-ERS, 2025a). Almost all imports come from Mexico, which accounted for around 90% of U.S. tomato imports in 2024 (USDA-FAS, 2025). Despite the surge in imports, is there evidence to suggest that domestic prices have been depressed, impacting U.S. tomato growers?
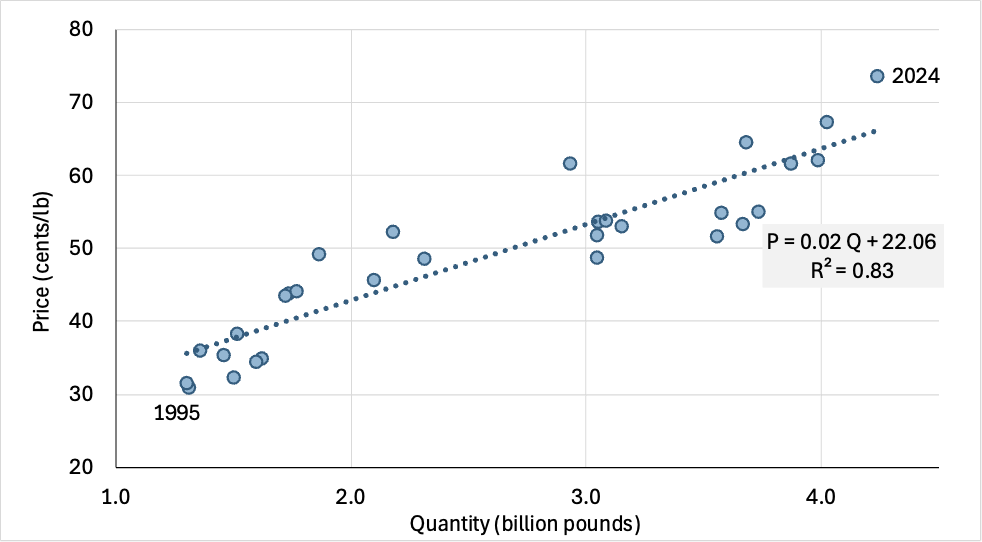
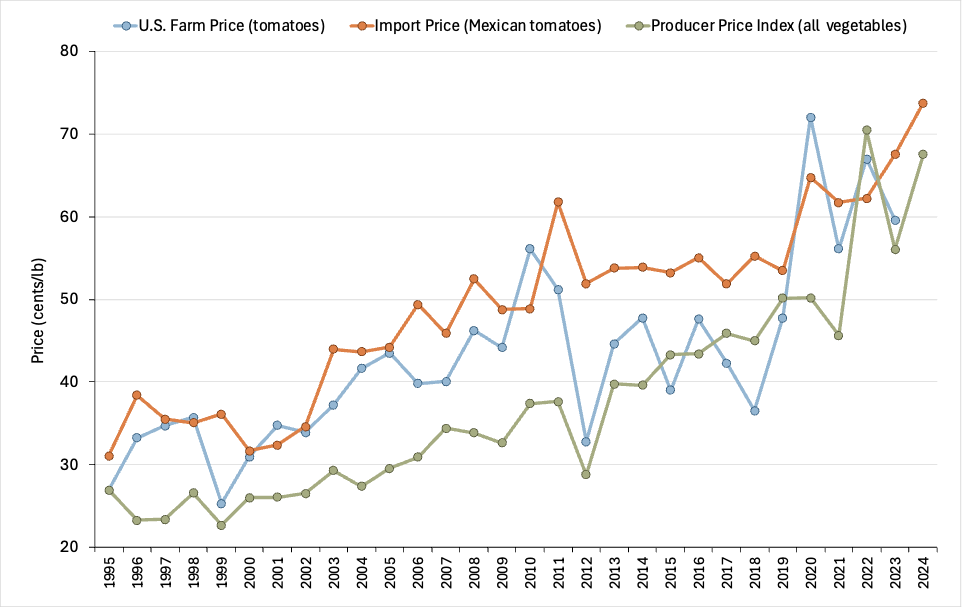
From 1995 to 2024, the U.S. saw a significant rise in the importation of Mexican tomatoes (Figure 1). The quantity of tomatoes imported from Mexico surged from approximately 1.3 billion pounds in 1995 to over 4.4 billion pounds in 2024. Alongside this rise in quantity, import prices also increased, starting at about 31 cents per pound in 1995 and reaching nearly 74 cents per pound in 2024. This upward trend in prices could be the result of the suspension agreements where Mexican signatories agreed to sell at increasingly higher prices. However, various factors, such as increased demand, changes in production costs, and market dynamics, likely contributed to this high correlation. Comparing Mexican tomato import prices to U.S. tomato farm prices and the U.S. Producer Price Index for all fresh vegetables shows little evidence of domestic price depression from imports (Figure 2). There is a positive correlation between import prices and U.S. farm prices, with a consistent upward trend. While it could be argued that prices would have grown at a faster rate without the surge in imports, overall vegetable prices suggest that this is not the case. In fact, import prices often exceeded both U.S. farm prices and overall vegetables prices.
In closing, while increased barriers on Mexican tomatoes might benefit U.S. tomato producers, there are other factors to consider. In 2024, the U.S. imported almost 2.0 million metric tons (over 4.0 billion pounds) of fresh tomatoes from Mexico, valued at more than $3.0 billion. According to a recent study by Texas A&M University, these imports generated an estimated $8.3 billion in total economic impact, including $3.6 billion in direct effects and $4.7 billion in indirect and induced effects, supporting approximately 47,000 U.S. jobs (Ribera et al., 2025). This suggest that there is more at stake if the U.S. eliminates the suspension agreement.
Figure 1. Import price and quantity of Mexican tomatoes: 1995–2024
Source: USDA-FAS (2025)
Figure 2. Comparison of import and domestic prices: 1995–2024
Source(s): The U.S. farm prices was obtained from USDA-ERS (2025b); import prices from USDA-FAS (2025); and the producer price index from BLS (2025), which was adjusted to for comparison purposes.
References
Bureau of Labor Statistics (BLS) (2025). Inflation and Prices, Prices – Producer, Commodity Data. https://www.bls.gov/data/
After numerous rounds of reciprocal tariff hikes, the tariffs between the U.S. and China have escalated to 145% and 125%, respectively. This raises a critical question: Can U.S. agricultural exports to China withstand such steep retaliatory tariffs? To delve deeper into this issue, let’s examine the impact of prohibitively high tariffs on U.S. beef exports, a significant component of U.S. agricultural trade with China.
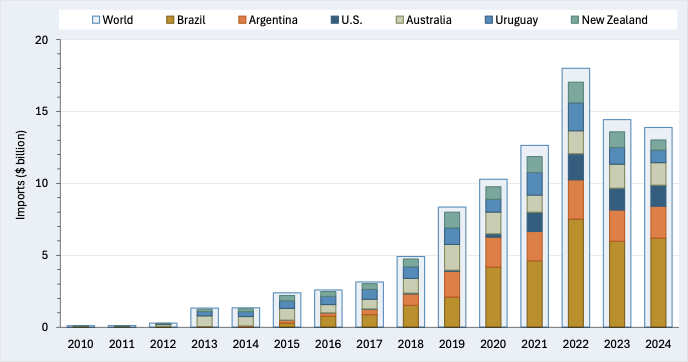
As noted in a previous article, China has emerged as a major player in global beef trade. Although once a minor importer, China is now the largest beef importing country in the world. In 2010, Chinese beef imports were only $84 million, but by 2022, they increased by 21,000% to nearly $18 billion (See SAT: https://southernagtoday.org/2022/12/01/china-emerges-as-a-leading-destination-for-u-s-beef-exports/). This remarkable rise can be attributed to several factors, including economic growth, urbanization, and changing preferences for quality protein sources. The increase in imports was further accelerated by the outbreak of African Swine Fever in 2018, which decimated pork supplies and led to a significant shift towards beef. Due to rising demand and imports, coupled with lifting the import restriction on U.S. beef in 2017, China is now the third largest foreign market for U.S. beef behind South Korea and Japan (USDA, 2025).
Since 2017, the U.S. has significantly increased its beef exports to China. In 2018, U.S. beef exports were valued at around $64 million, but by 2024, increased to approximately $1.5 billion (See Figure 1). As the figure shows, Brazil is the leading exporter of beef to China, reaching approximately $6.2 billion in 2024 (45% of total Chinese imports). Other noted suppliers include
Argentina, Australia, New Zealand, and Uruguay.
The figure underscores the competitive landscape of imported beef in China, with the U.S. emerging as a key player alongside Argentina, Australia, Brazil, New Zealand, and Uruguay. We can assess the impact of tariffs on these countries using price elasticity estimates from previous research (Hossen and Muhammad, 2025). The price elasticity refers to how the quantity imported responds to changes in import prices (own or competitor’s). Based on estimates from previous research, U.S. beef exports to China could decline by more than 77% in the short run, amounting to more than $1.0 billion in lost export sales. In the long run, U.S. beef exports to China will likely fall to zero if the high tariff persists. Interestingly, competing beef exports from Brazil and other countries could also decline (although by much smaller values) due to complementarities in importing. However, our estimates suggest that Uruguay could possibly benefit, but the benefit would be a fraction of U.S. losses. The U.S. has managed to capture a substantial share of the Chinese beef market (11% in 2024). Challenges posed by recent tariffs and trade barriers could cause the U.S. to lose it all.
Figure 1. Chinese Beef Imports: 2010 – 2024
Source: Trade Data Monitor® (2025)
For more information:
Hossen, M.D. and Muhammad, A. (2025). “Assessing the Impacts of Maritime Freight Rates on Global Beef Trade” Agribusiness. https://doi.org/10.1002/agr.22030
To say that international trade has dominated the news in recent weeks would be an understatement. Last month, President Trump followed through on his promise to impose 25% tariffs on Canada and Mexico, and an additional 10% on China. While Mexico—and to a lesser extent, Canada—received another temporary reprieve, the threat of tariffs still looms.
It is crucial to understand the potential impacts of these tariffs on U.S. agriculture. In his recent State of the Union Address, as well as in subsequent social media posts, President Trump claimed that the new round of tariffs would result in increased domestic agricultural sales. There is an element of truth to this claim. According to economic theory, tariffs can lead to a rise in domestic sales—if the imported product directly competes with a similar domestic product. However, this does not apply to commodities like soybeans or cotton, as the U.S. exports far more of these products than can be consumed domestically. For example, more than 70% of U.S. cotton production is exported. In fact, these sectors are particularly vulnerable because they are often the target of retaliatory tariffs. Also, any increase in domestic sales resulting from tariffs has less to do with firms facing less competition and more to do with the fact that tariffs lead to higher domestic prices. These higher prices, in turn, encourage more domestic producers to sell their products. While this benefits producers, it unfortunately disadvantages importing firms and consumers, with the disadvantages far outweighing any gains.
Imports should not be regarded solely as competition to American production. This perspective neglects the essential role imports play in meeting demands that exceed domestic capabilities. International trade is far more complex than the simplistic notion that “exports are good, imports are bad.”
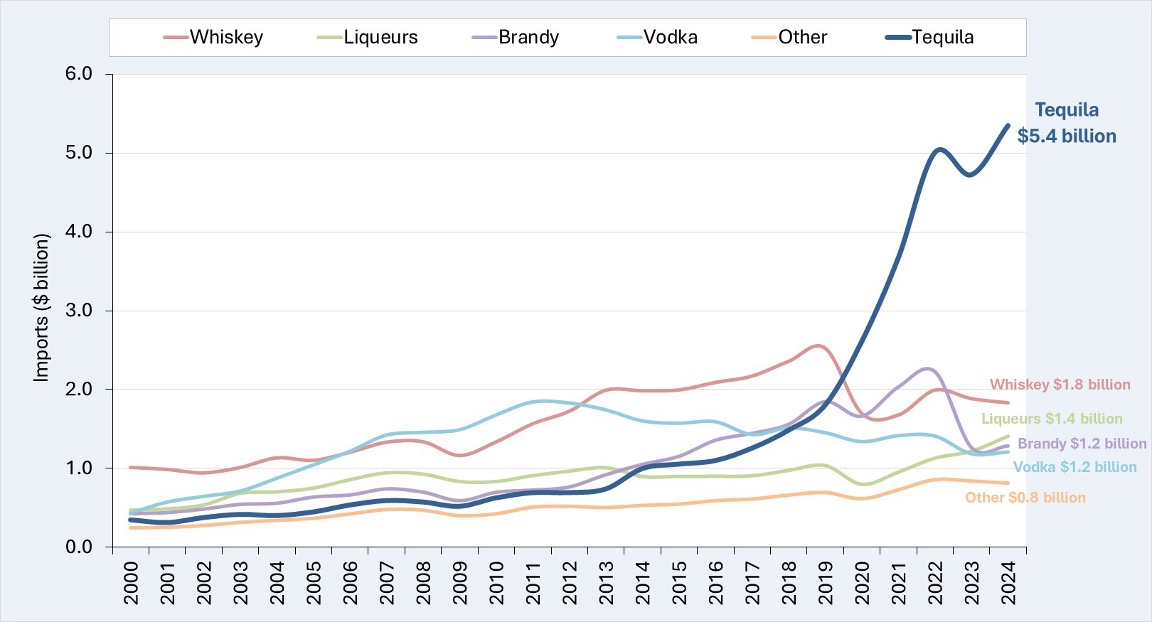
Tequila, an agricultural product imported entirely from Mexico and cannot be produced elsewhere, serves as a prime example for examining the harmful impacts of proposed tariffs. U.S. imports of distilled spirits have soared by over 300% since 2000, largely driven by the extraordinary growth in tequila imports. Between 2000 and 2024, tequila imports skyrocketed by 1,400%, rising from $350 million to $5.4 billion (Figure 1). In 2024, U.S. agricultural exports totaled $176 billion, while imports reached $214 billion, resulting in an agricultural trade deficit of $38 billion. Remarkably, tequila alone accounts for over 14% of this deficit, despite being a single, highly differentiated product. Over the past decade, our growing taste for tequila has driven a more than five-fold surge in demand and imports. Imagine the outrage if tequila imports were banned simply to address the agricultural trade deficit.
I recently conducted research on the impact of a 25% tariff on Mexico and Canada on U.S. imports of distilled spirits (https://doi.org/10.1002/agr.22034). My findings indicate that such a tariff would reduce imports by over $1 billion, far outweighing any potential tariff revenue gains. This overall decline is primarily driven by a significant drop in tequila imports, though imports of other spirits would also decrease due to complementarities in importing.
It could be argued that these losses would primarily impact the exporting country—Mexican tequila companies. However, this perspective overlooks the fact that U.S. tequila consumption also supports American bars, retailers, wholesalers, and distributors. When factoring in the downstream economic impact, the losses become even more substantial. Clearly, it would be difficult to prove that American largess is enriching Mexican agave farmers at the expense of U.S. agricultural producers.
Figure 1. U.S. Imports of Tequila and Other Spirits: 2000 – 2024
Source: U.S. Department of Agriculture, Foreign Agricultural Service (2025)
For more information:
Muhammad, A. (2025), Trump Tariffs 2.0: Assessing the Impacts on US Distilled Spirits Imports. Agribusiness. https://doi.org/10.1002/agr.22034
Brazilian beef was first banned in Japan in 2012 due to concerns over Bovine Spongiform Encephalopathy (BSE), also known as Mad Cow Disease. Brazil is currently in talks with Japan to begin beef shipments once again. Although Japanese imports of Brazilian beef were negligible prior to 2012, the possible reentry of Brazilian beef into the Japanese market could pose a significant challenge to U.S. beef exports.
The importance of Japan to global beef trade and U.S. beef exports cannot be overstated. Japan is the third largest beef importing country in the world and the second largest market for the U.S. In 2024, U.S. beef exports reached $10.5 billion. That year, exports to Japan accounted for 18% of the total (USDA, 2025a, 2025b). While Japan is important to U.S. export disappearance, the U.S. is especially important to Japan as its leading supplier. In 2024, for instance, Japan imported $1.8 billion worth of U.S. beef. This was 43% of Japan’s total beef imports, exceeding imports from Australia ($1.7 billion and 39%), and significantly larger than countries such as Canada, New Zealand, and Mexico. Despite the current strong position of U.S. beef in Japan, this could be challenged by the reentry of Brazilian beef into the Japanese market.
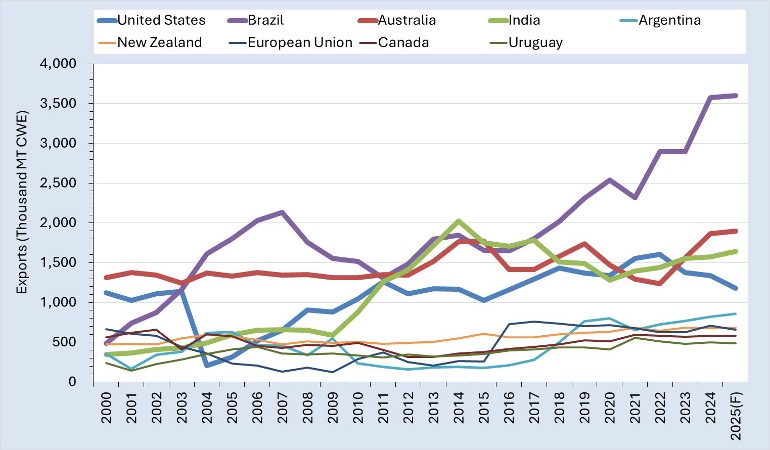
Around the time of the U.S.-China trade war in 2018, Brazil emerged as the leading global beef exporter, surpassing the U.S., Australia, and India (Figure 1). The rise of Brazil as a major beef exporter is largely due to increased demand in China. (https://southernagtoday.org/2023/01/12/chinas-import-of-u-s-beef-continues-to-increase-but-how-does-the-u-s-compare-to-other-competing-countries/). As China emerged as the leading beef importing country (almost $14 billion in 2024), Brazil became its leading supplier accounting for 45% of total Chinese imports in 2024, far exceeding other exporting countries.
With exports already exceeding those of major exporters such as the U.S. and Australia, does Brazil have the capacity to gain a significant share of the Japanese foreign beef market? In 2024, cattle and beef production in Brazil was based on 192.5 million head of cattle (including all beef and dairy cows and calves). Over the past couple of years, Brazil’s national cow herd has been liquidating, leading to higher supplies of slaughter cattle and total production. Last year, Brazil’s national herd was reduced by 2% and was expected to continue shrinking midway through 2025 (Aquino, 2024). Despite the shrinking herd, Brazil has maintained its share of world trade. Given the expectation of rebuilding, Brazil’s herd could rebuild at a higher pace to capitalize on the new demand from the Japanese market.
Future Japanese demand will be based on a combination of quality and quantity. Over the last few decades, Japanese beef consumers have trended more towards the preferences of the typical U.S. beef consumer. Products like ground beef, steaks, burgers, and fajitas have become increasingly popular in Japan. The key question is whether Brazil can match the quality of U.S. beef in Japan. Quantity is a lesser obstacle for Brazil with this potential market opportunity.