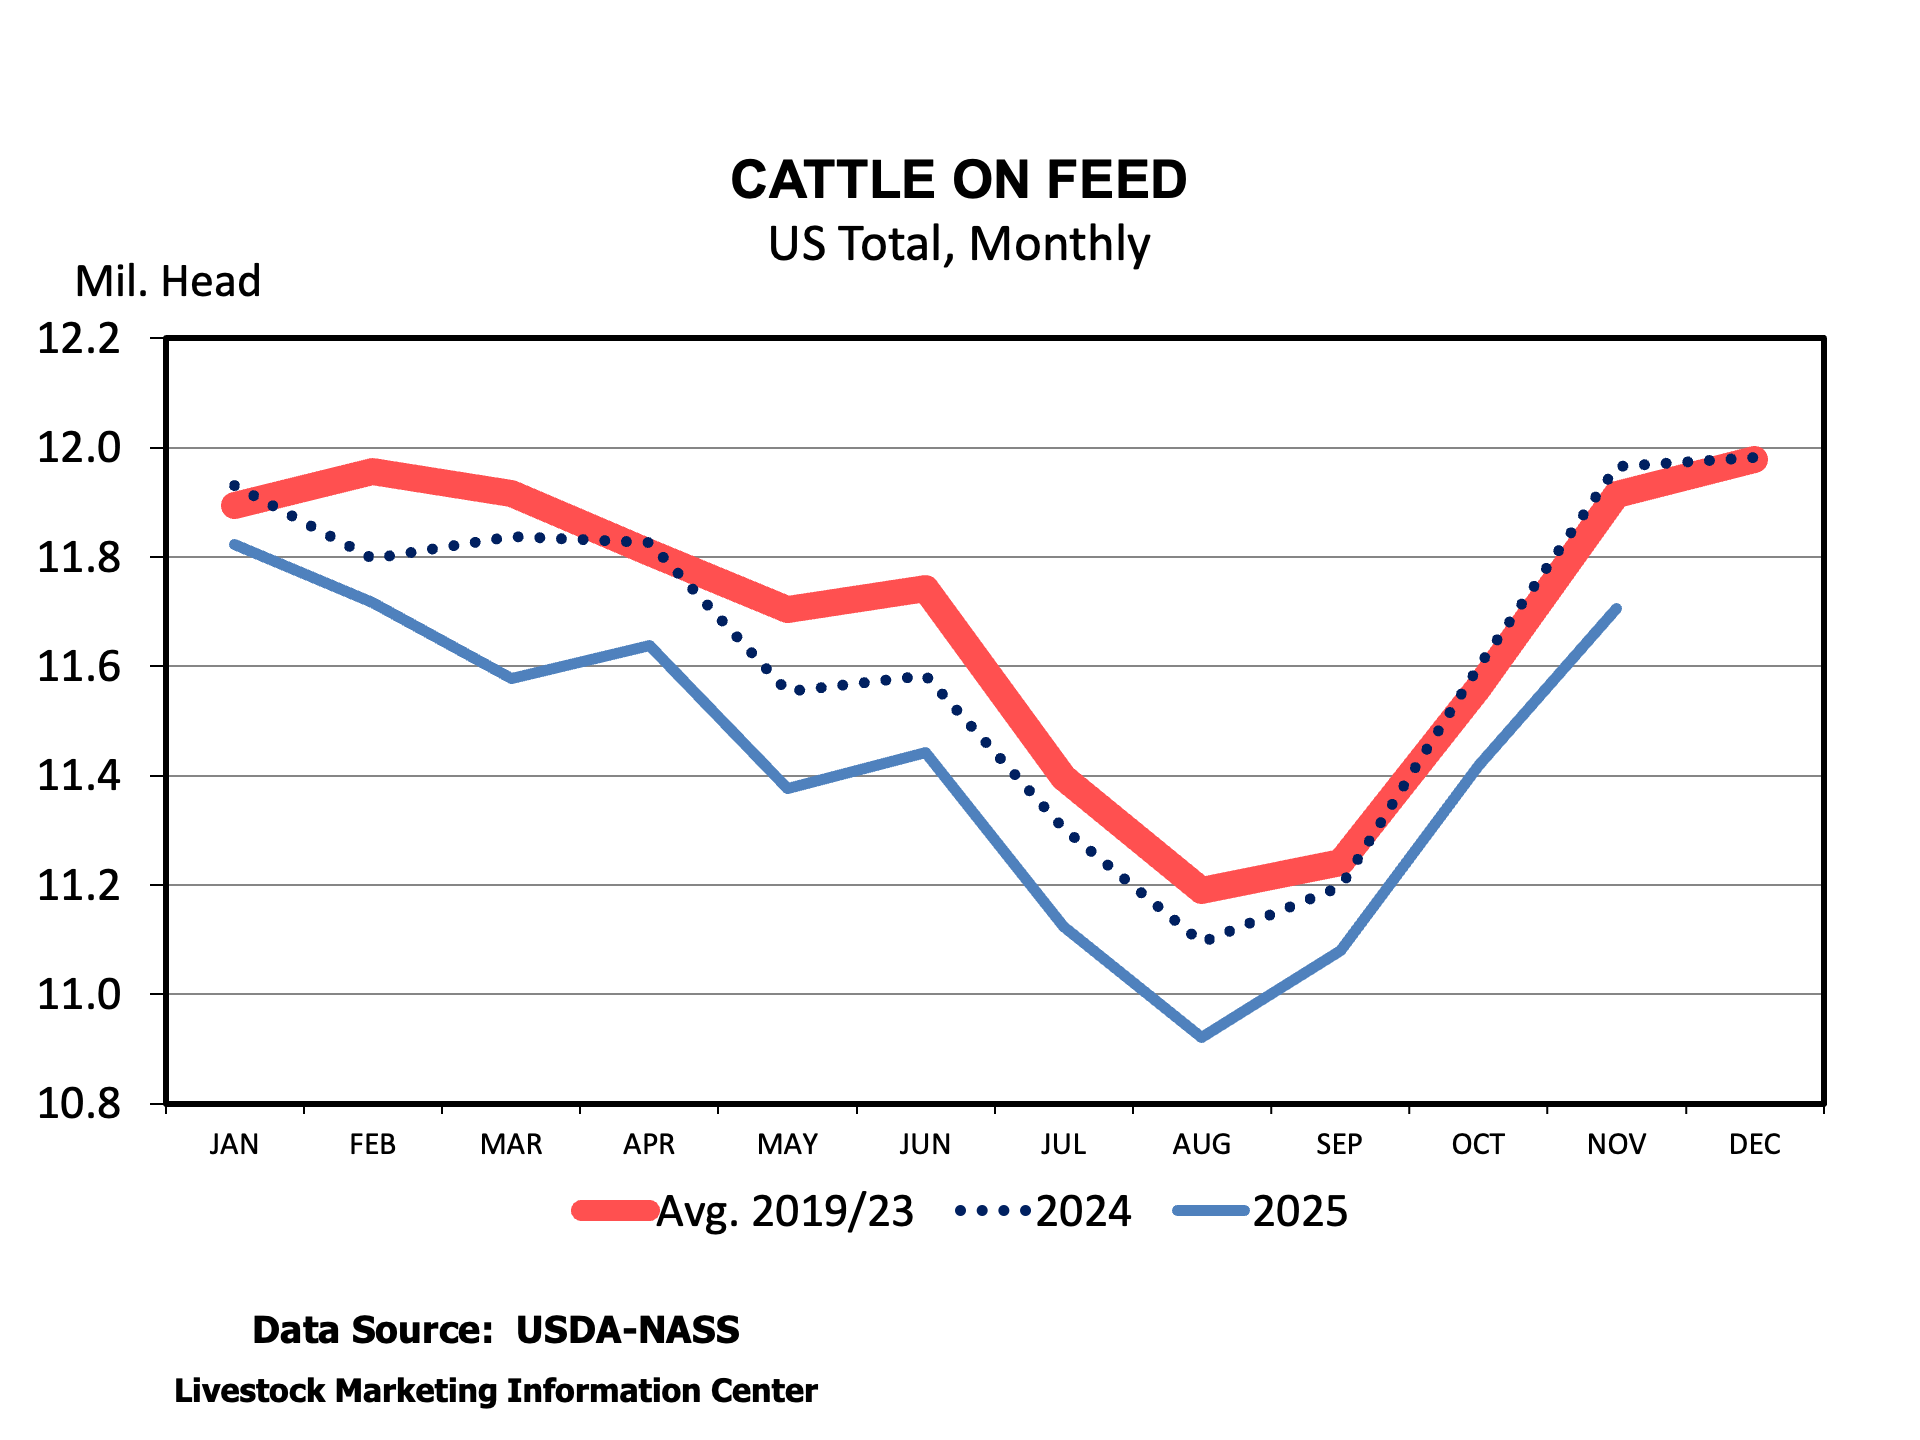
Amid the drumbeat of bad news in the cattle market over the last month, including on-again, off-again tariffs, jawboning for lower beef prices, and now Tyson’s announcement that they will close their beef packing plant in Lexington, NE, in January, USDA released a cattle on feed report. (We’ll look at the impact of the plant closure on packing capacity in a future SAT). USDA caught up on cattle on feed following the shutdown when they released the COF report on Friday, November 21st.
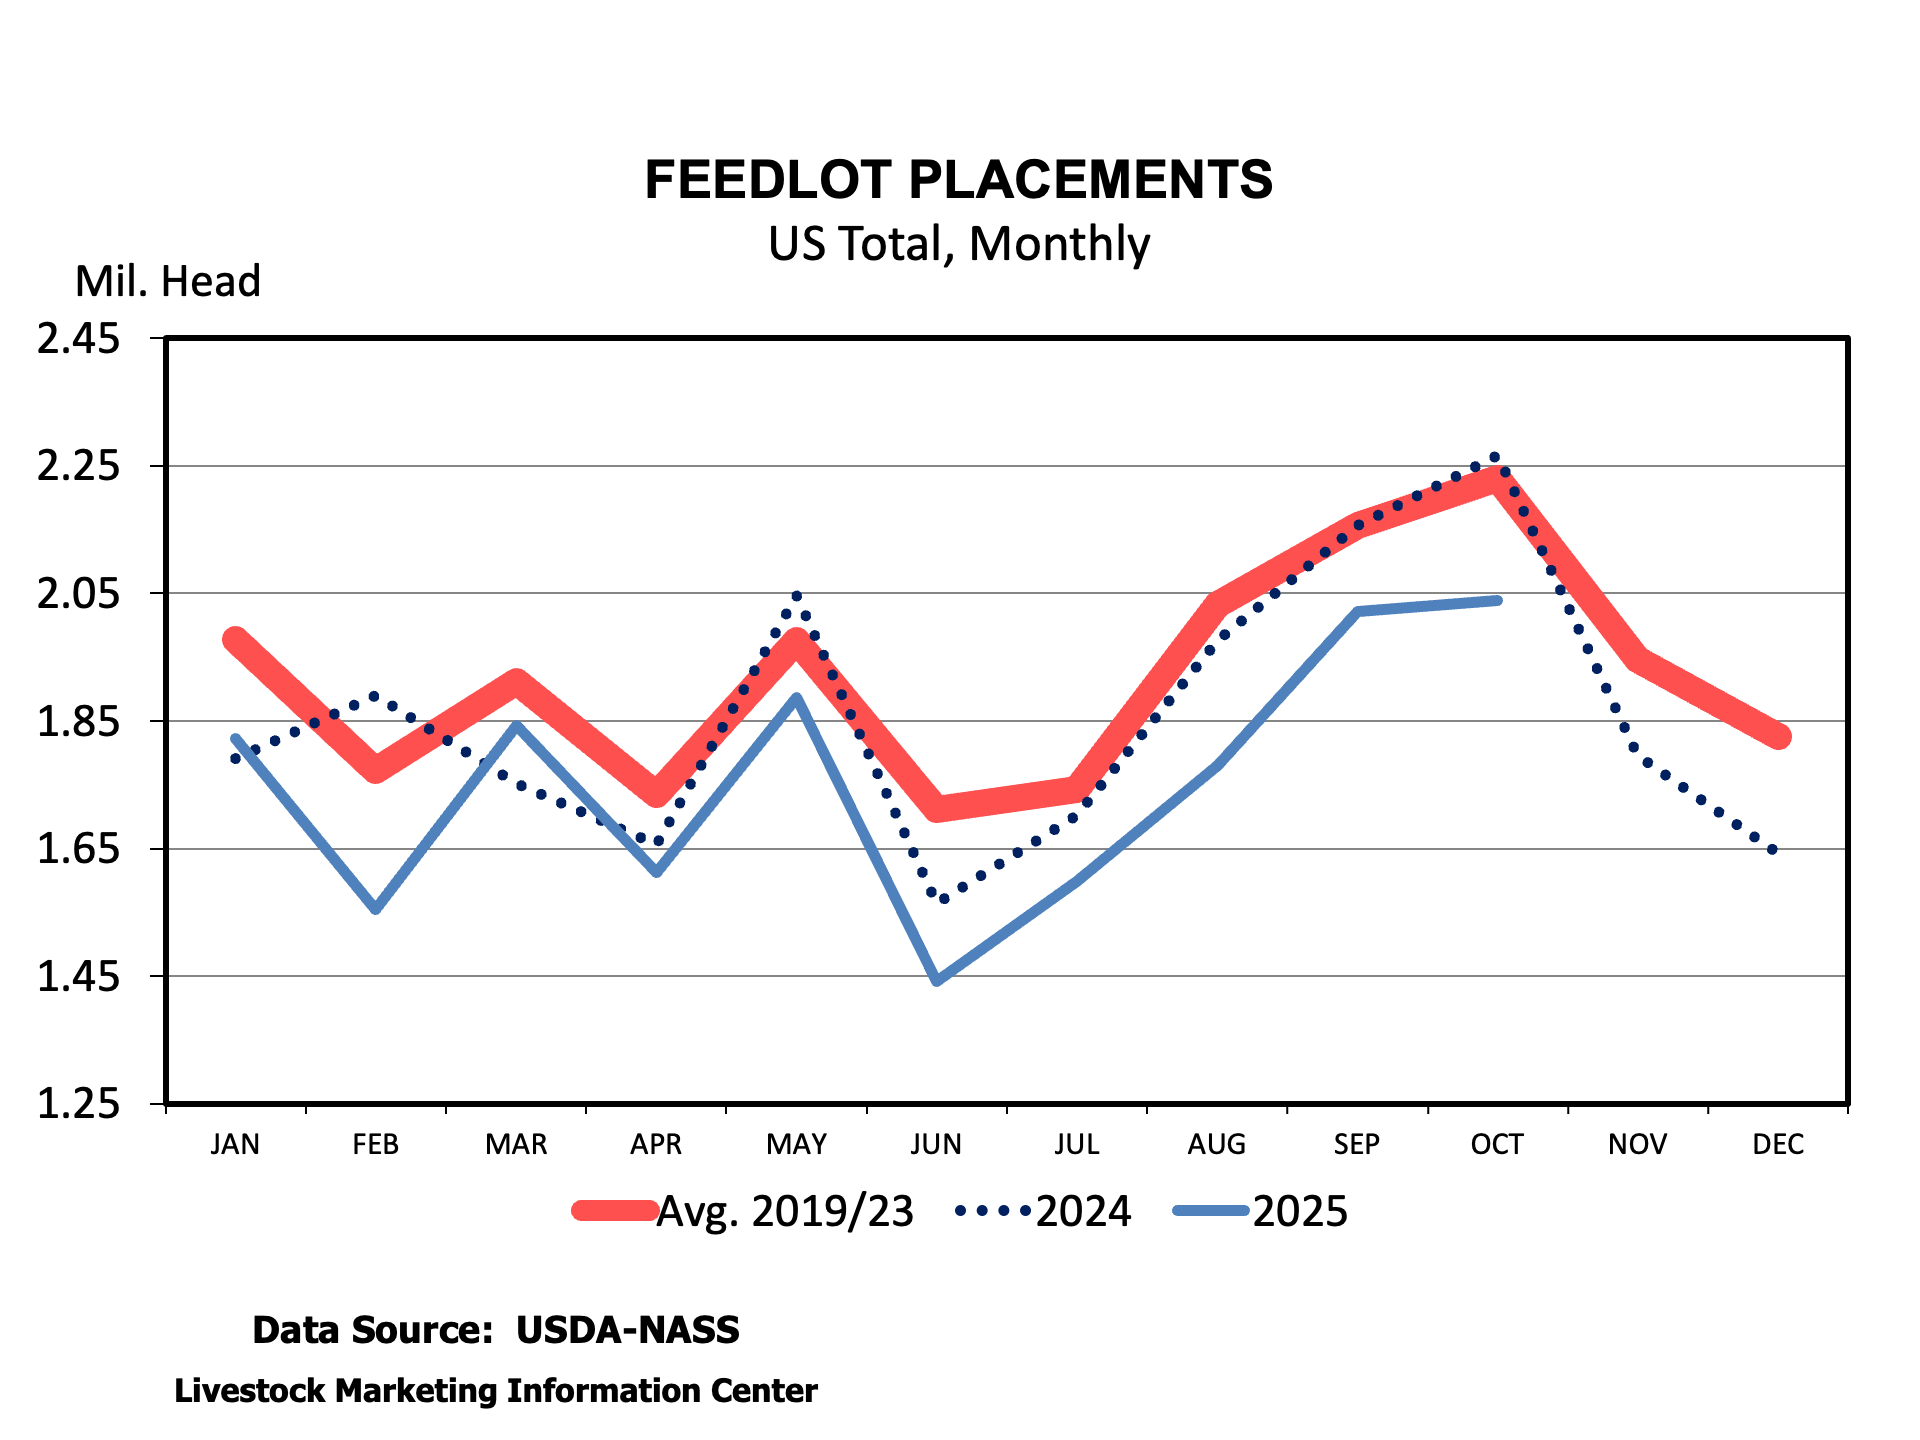
The report did not contain many surprises. Placements and marketings were down 10 percent and 8 percent, compared to October 2024. The combination left the number of cattle on feed down 1.6 percent compared to November 1, 2024.
The most interesting, and important, number in the report was the number of heifers on feed. Heifers on feed is normally reported in the October report, but that was delayed due to the shutdown. There were 4.355 million heifers on feed on October 1, 2025. That was 245,000 fewer than October 1, 2024, and the fewest heifers on feed for an October since 2018. It also represented the 5th consecutive quarter of year-over-year declines in the number of heifers on feed. That would seem to be positive news if looking for evidence of herd expansion.
But the heifer data on feed for October 2024 would have included spayed heifers imported from Mexico. Over the April-September 2024 period, 266,559 spayed heifers were imported. So, the decline in heifers on feed reflects no imported heifers from Mexico this year and any decline in domestic heifer feedlot placement. The expectation is that fewer spayed heifers would have been imported this year compared to last year, but considering imports, the report doesn’t indicate a lot of heifer retention.
The report included a rare event with Texas slipping to number 2, reporting 10,000 fewer cattle on feed than Nebraska, 2.63 million head versus 2.64 million head. The last time Nebraska had more cattle in feedyards than Texas was May 2018. The lack of Mexican feeder cattle imports is the most important factor in this ranking reversal.
There were a couple of other interesting numbers to think about. More steers were reported on feed than a year ago. At first glance, we might think that seems surprising given the decline in cow numbers, but days on feed is boosting total cattle on feed inventories, given overall declines in cattle numbers.
All of us livestock economists at Southern Ag Today wish you all a blessed Thanksgiving with as many of your family and friends as possible!
Anderson, David. “A COF Report Comes Out Among Other Headlines.” Southern Ag Today 5(48.2). November 25, 2025. Permalink