The October 16, 2024, edition of Southern Ag Today indicated a slightly bullish wheat situation within the United States (Welch, 2024). Today’s article discusses this further using three charts: U.S. Wheat Imports by Country, Wheat Production by Country, and Ending Stocks by Country. Wheat is a global crop, with the U.S. accounting for just 7% of the world’s wheat supply (Welch, 2024). Thus, U.S. fundamentals may not be the best indicator of a bullish outlook. Generally, the U.S. has a few uses for wheat, including food, seed, feed, and exports. Year over year, we see similar quantities of wheat used for food, seed, and feed. Significant changes in demand, which could result in a bullish outlook, typically occur due to changes in exports.
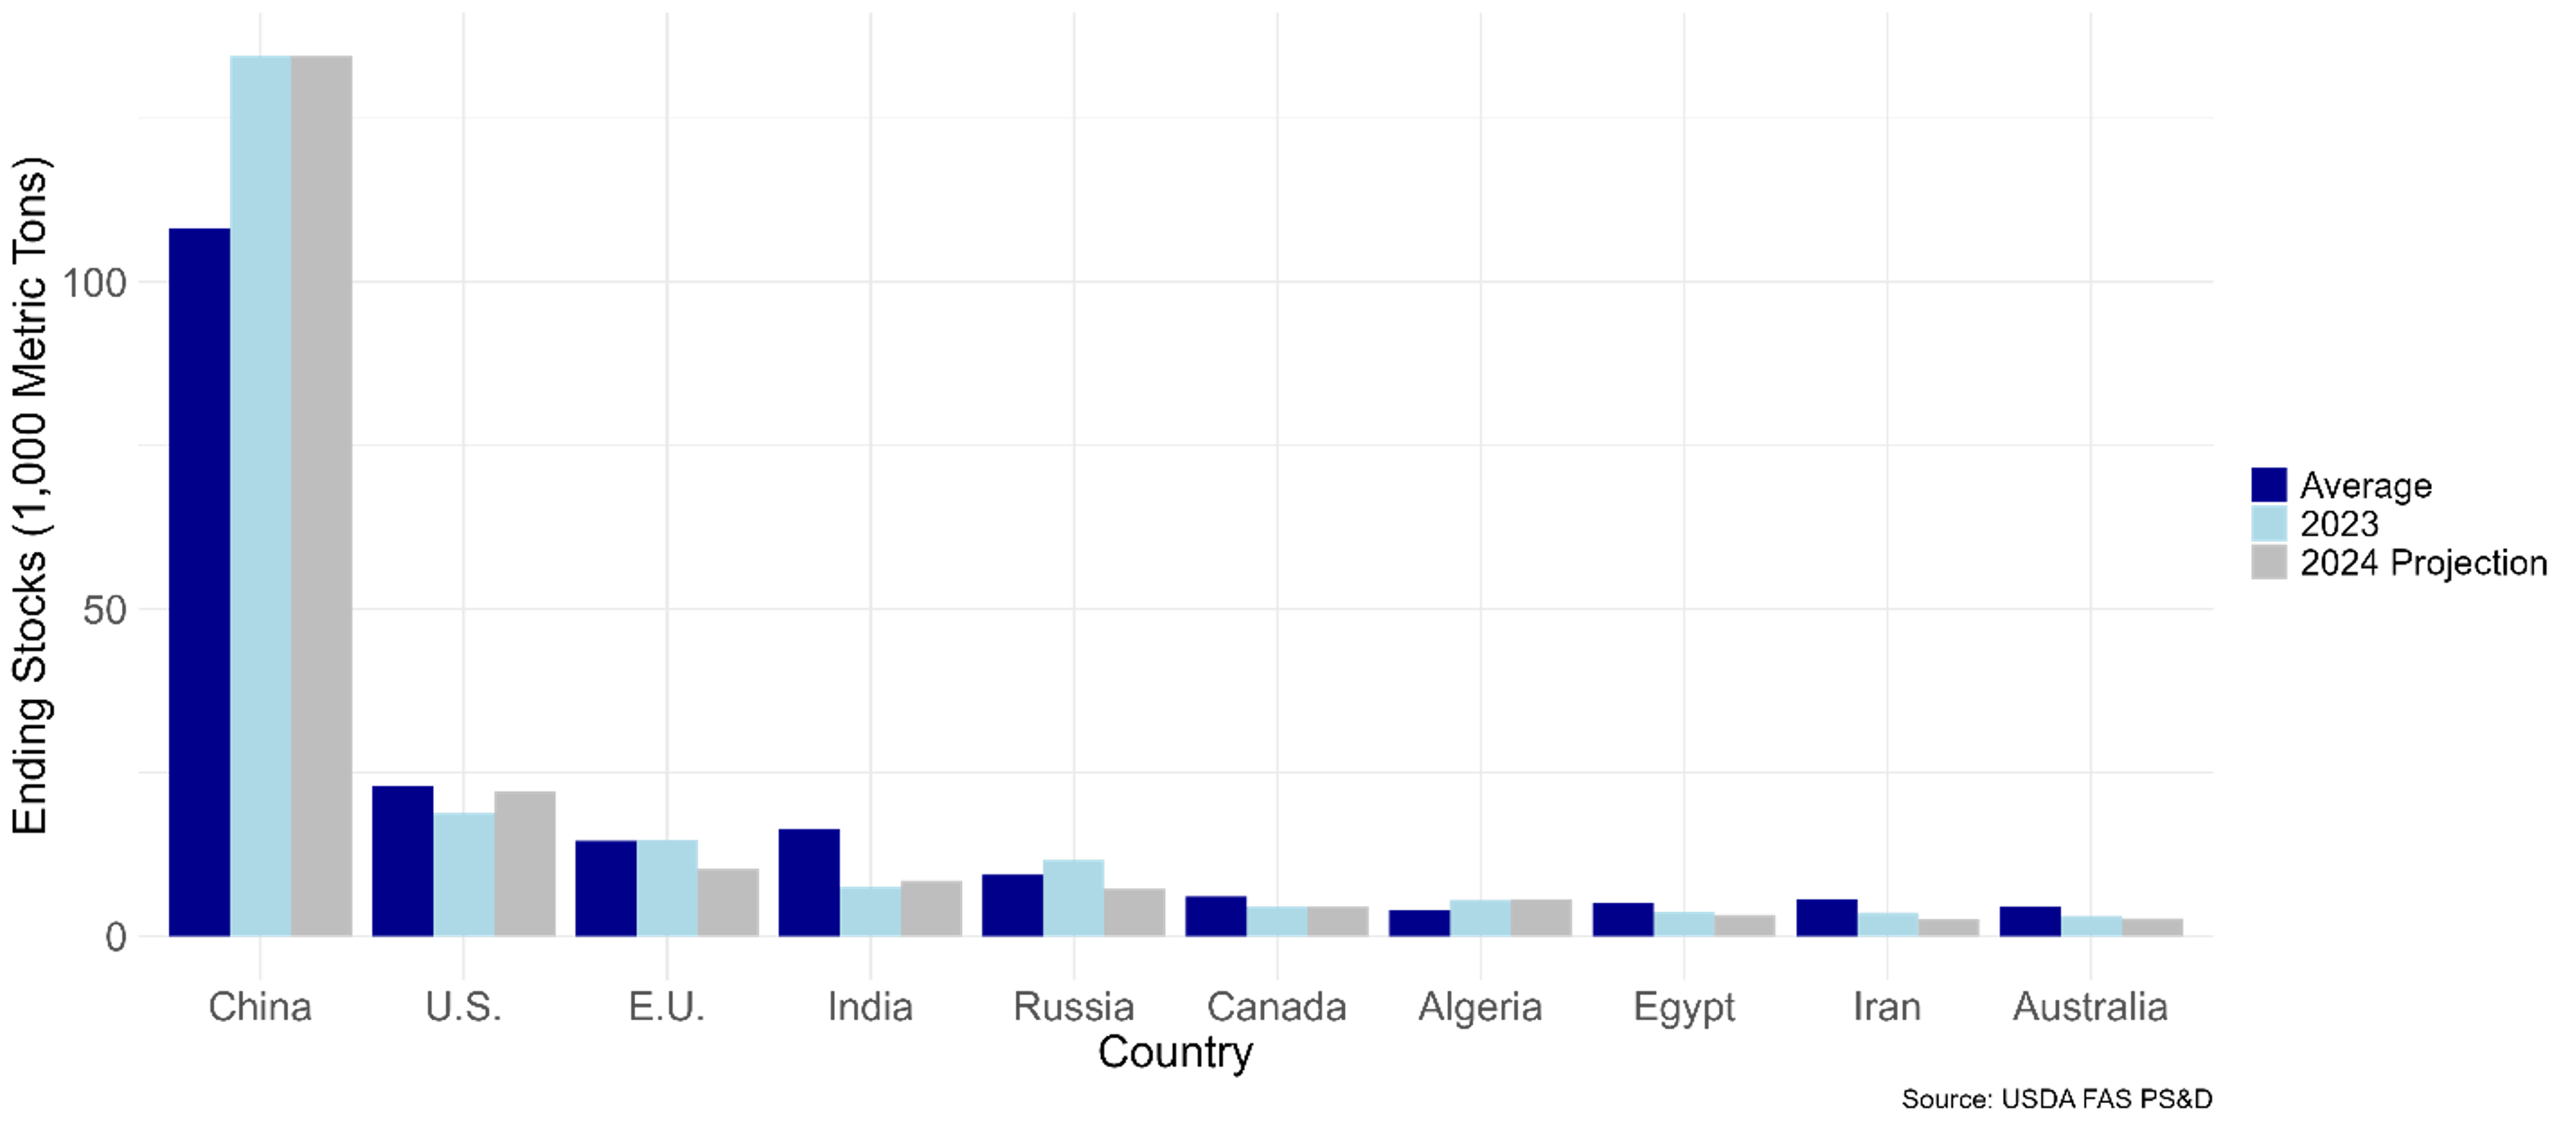
Figure 1 illustrates U.S. wheat imports by country. In general, Mexico is the largest importer of U.S. wheat. China is a vast producer – typically keeping most of its production for domestic use – but it is also a significant importer. In 2023, China imported more wheat than usual due to quality deterioration. This situation is unlikely to occur again in 2024, as China is projected to have above-average production (Figure 2) and standard quality. However, the U.S. could see a price increase due to smaller production and ending stocks in the European Union (Figures 2 and 3). The E.U. has had a bad year of production with low quality in crucial wheat producing countries, including Germany and France. Consequently, E.U. stocks are projected to be the lowest since 2000. French wheat, similar to U.S. soft red winter, is used for food products like cakes, cookies, and pastries, requiring lower-protein wheat. German wheat is similar to U.S. hard wheats, including hard red winter wheat, and it is often used for bread and pizza dough.
The low stocks and production situation could cause the E.U. to limit their exports, opening opportunities for more U.S. exports to countries that typically buy wheat from the European Union. It could also result in more direct U.S. exports into the E.U., boosting U.S. wheat price. A series of U.S. sales to the E.U. could indicate bullish action in the wheat market and be a crucial indicator to sell this marketing year.
Figure 1: U.S. Wheat Imports by Country
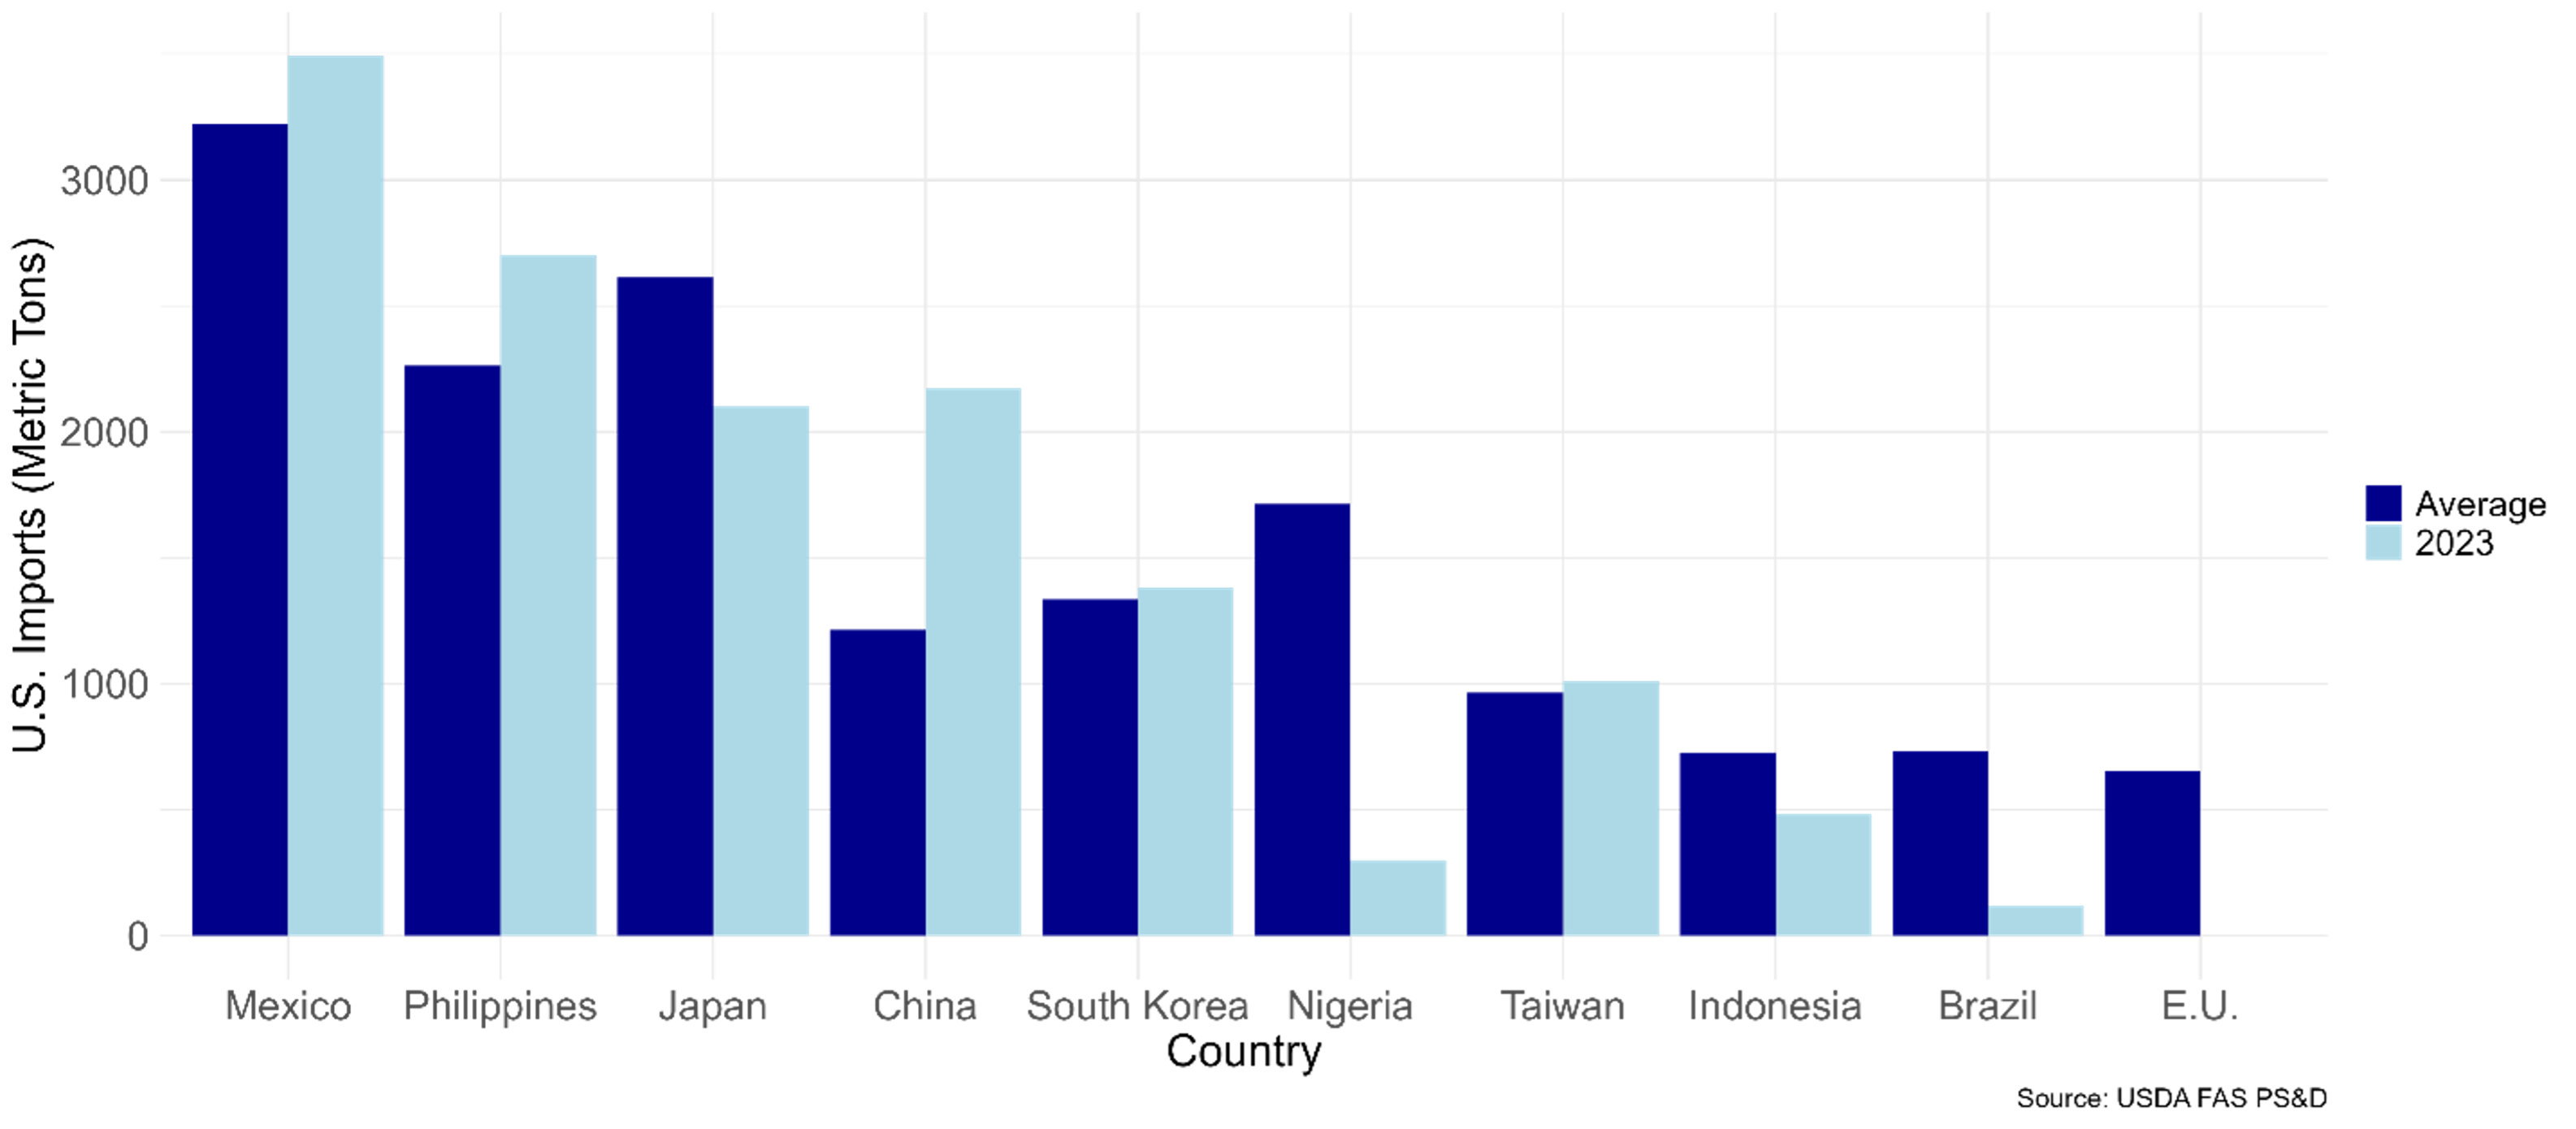
Figure 2: Wheat Production by Country
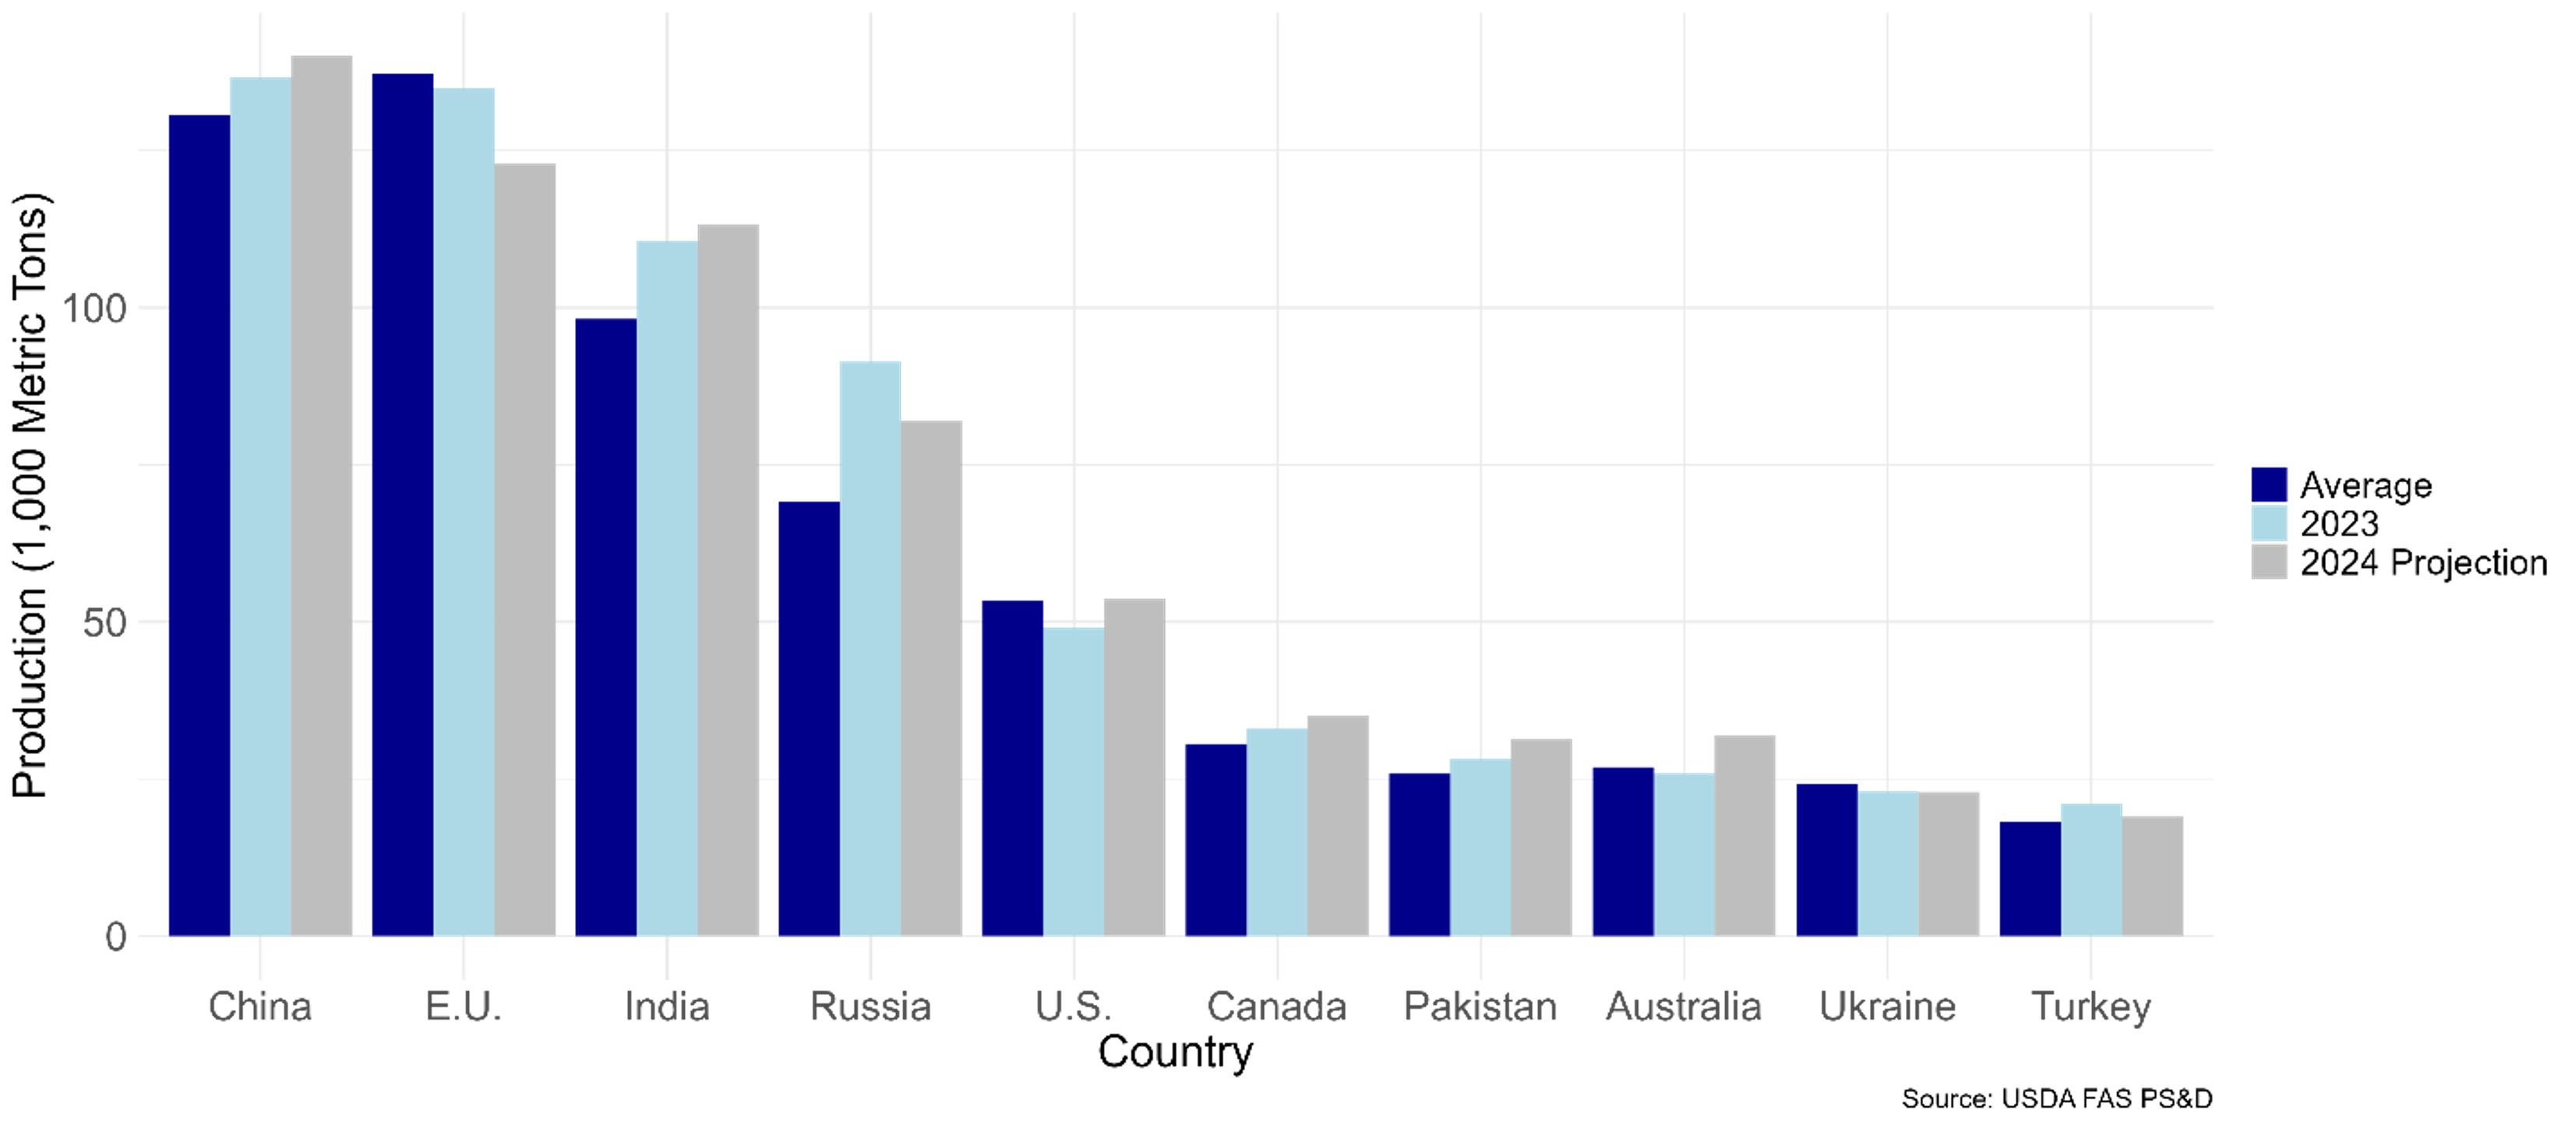
Figure 3: Ending Stocks by Country
Sources:
U.S. Department of Agriculture. (2024). Production, Supply, and Distribution database. Foreign Agricultural Service. https://www.fas.usda.gov/data/psd-online
Welch, J. Mark. “Recap of the October WASDE for Grains and Soybeans.” Southern Ag Today 4(42.3). October 16, 2024. Permalink
Gardner, Grant, and Frayne Olson. “Global Wheat Shortfalls Could Signal Bullish Potential for U.S. Wheat.“ Southern Ag Today 4(44.3). October 30, 2024. Permalink