Extreme weather events, like drought, jointly impact agricultural production and rural infrastructure, including transportation infrastructure. An important part of this transportation infrastructure is the Mississippi River. It serves as one of the most critical networks for moving agricultural commodities from production to consumption areas, including export markets. In 2020, U.S. agricultural exports totaled $146 billion, increasing 7 percent year over year (U.S. Department of Agriculture’s Foreign Agricultural Service, 2021). Approximately 46 percent of grain exports were moved by barge in 2020. Soybeans, the leading U.S. agricultural export, rely heavily on barge transportation, with 53 percent of exports and 28 percent of total supplies moved by barge in 2020.
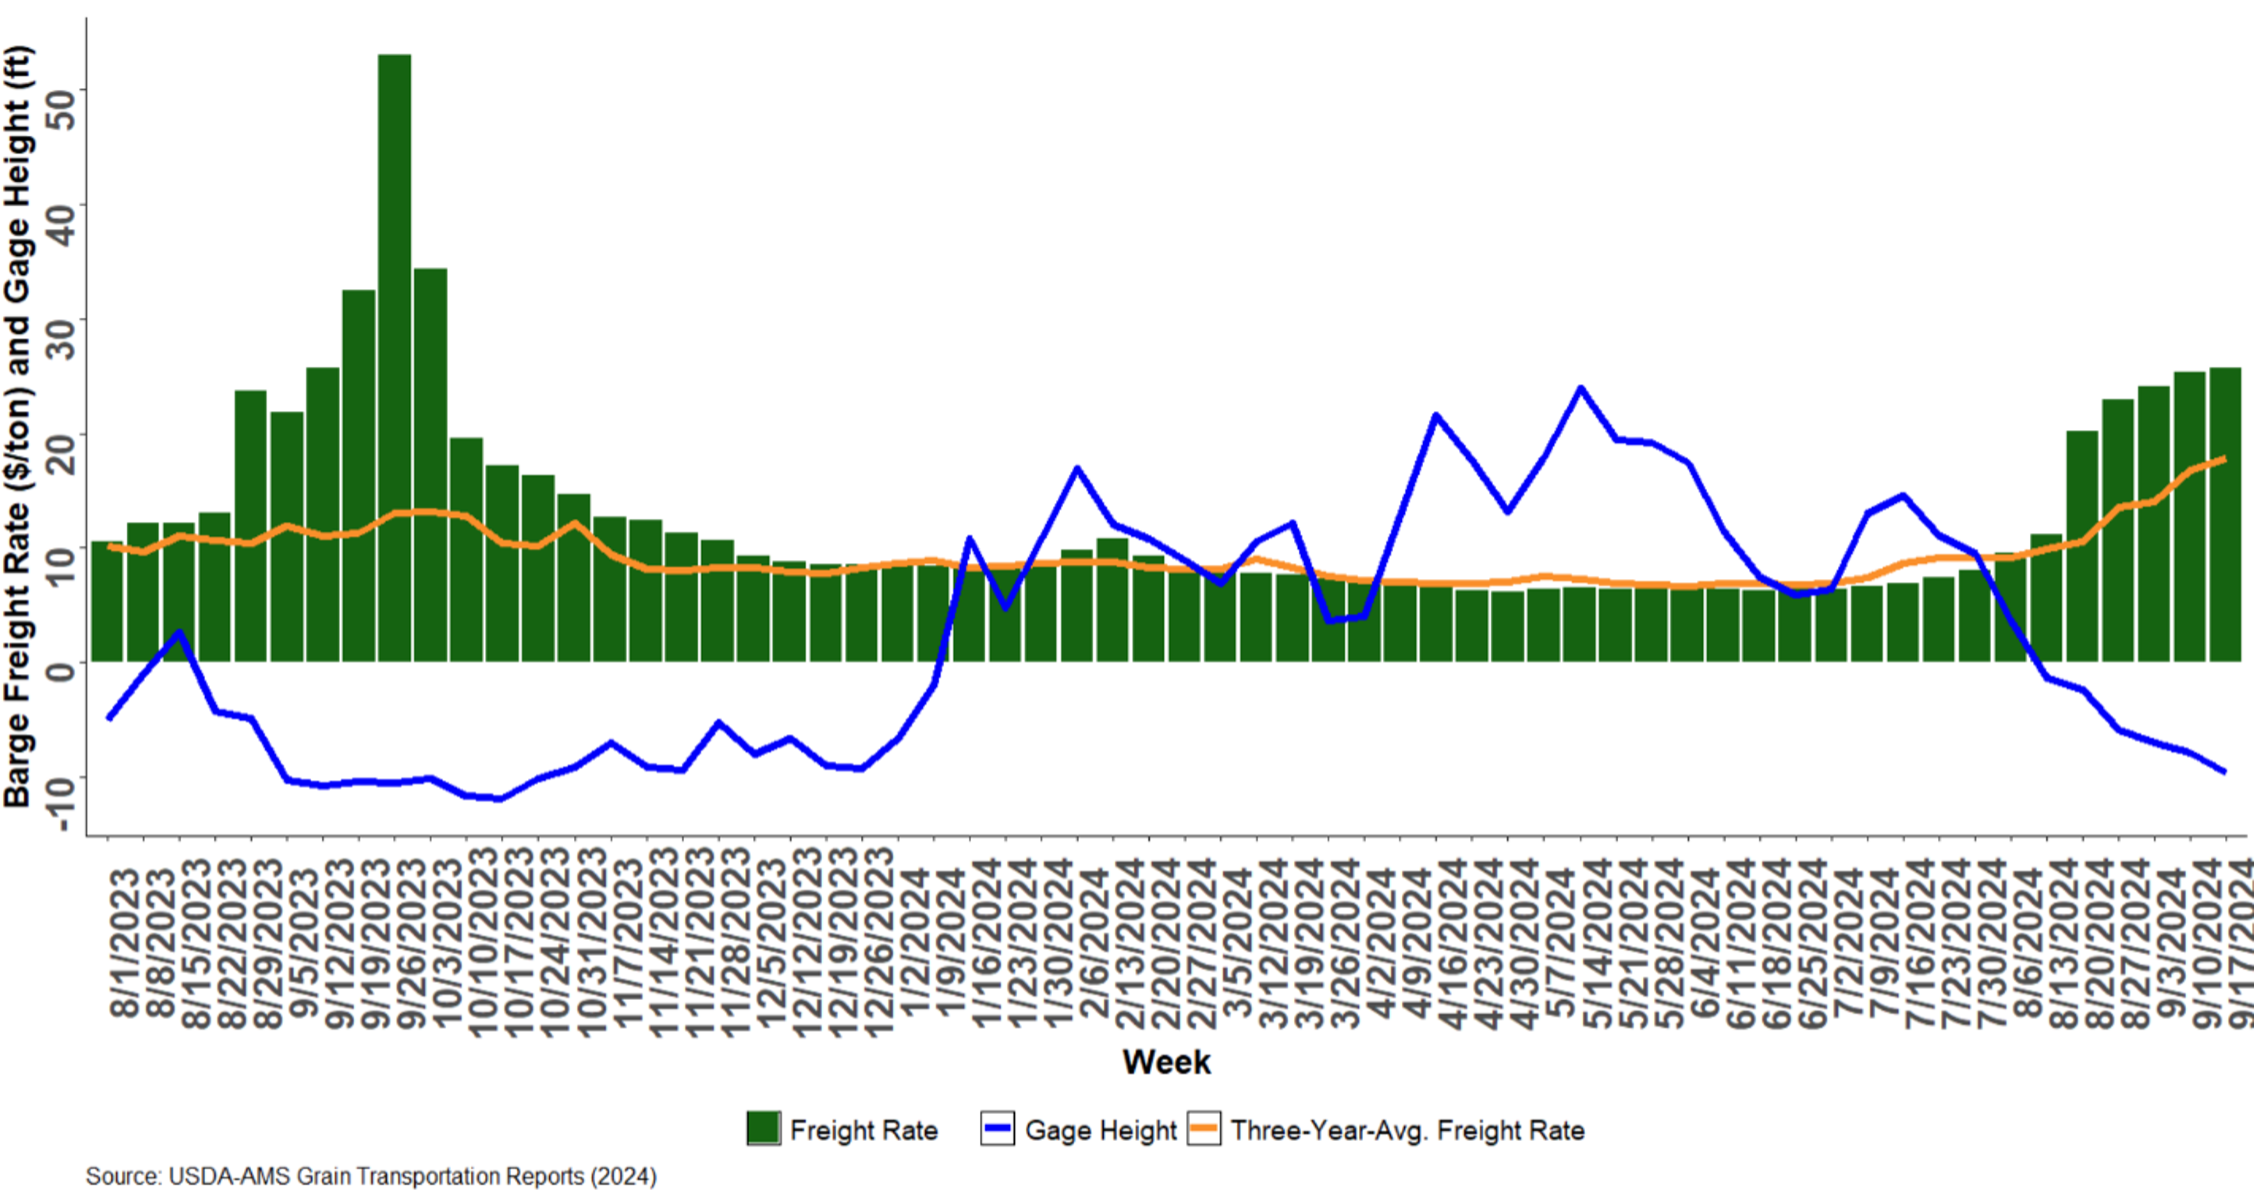
Despite this reliance on barges for moving U.S. grain, little is known about the link between extreme weather, rural transportation infrastructure, and crop prices. In 2022 and 2023, the Lower Mississippi River reached historic lows. In October, the U.S. Geological Survey (USGS) Memphis stream gauge read -12.0 feet and -10.8 feet in 2023 and 2022, respectively. The previous record was set in 1988 when the USGS Memphis stream gauge read -10.7 feet. These record-low water levels increased transportation costs and barge freight rates as documented by previous Southern Ag Today articles (Biram, et al., 2022; Gardner, Biram, and Mitchell, 2023; Biram, Mitchell, and Stiles, 2024). Higher transportation costs are transmitted to row crop producers through lower cash bids or a weakening of local crop basis (calculated as the cash price minus the futures price). Historic lows in Mississippi River levels during the fall harvest of the last three years have highlighted the need to measure the impact of these low river levels on rural infrastructure and communities.
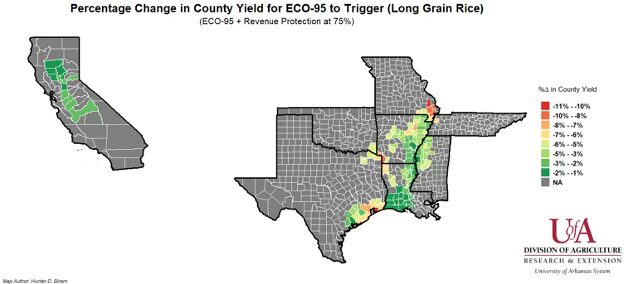
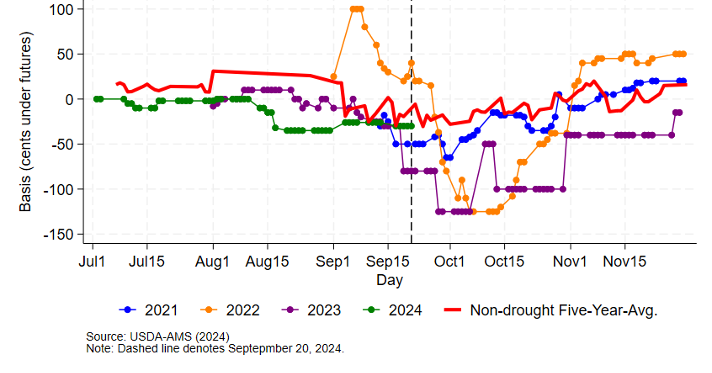
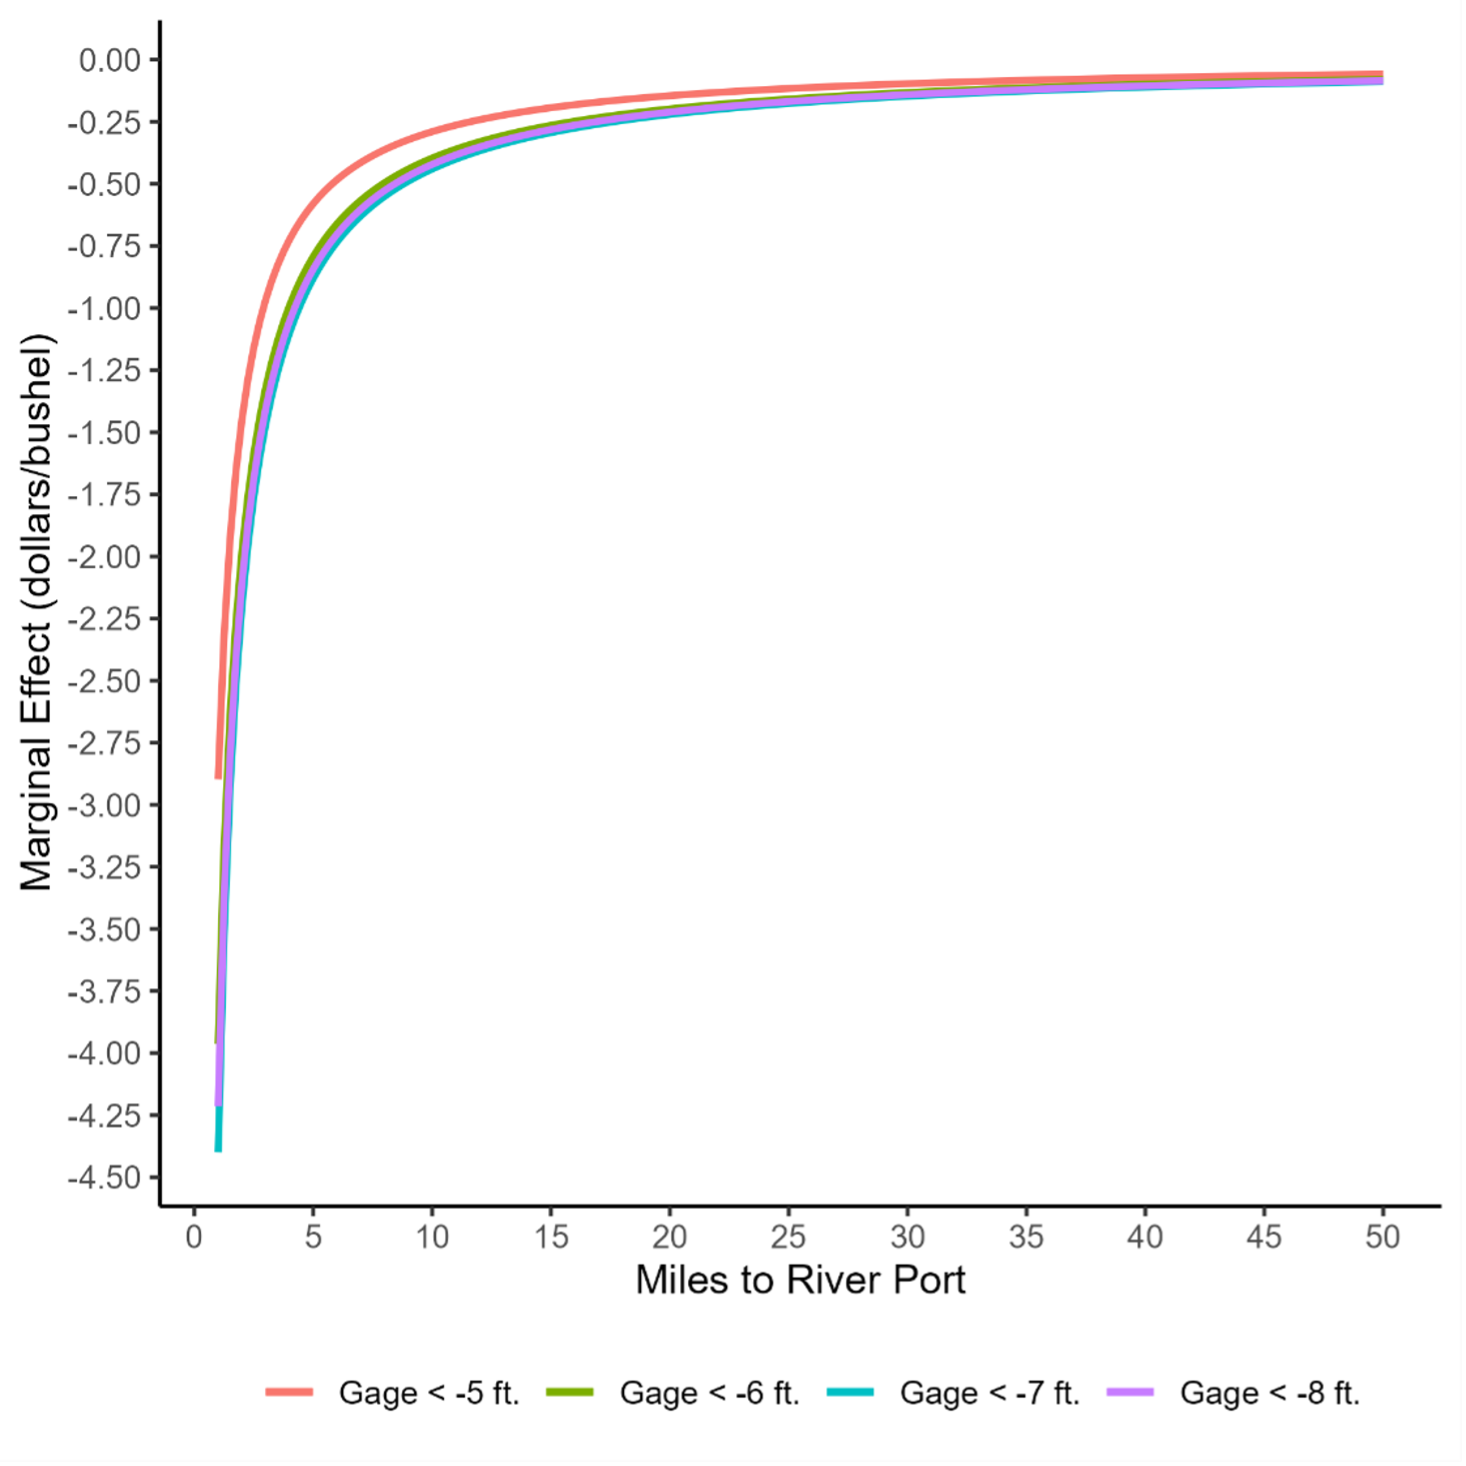
Mitchell and Biram (2025) measure the impact of low water levels on the Mississippi River using Arkansas soybean basis data across 12 regional grain markets from USDA’s Agricultural Marketing Service and stream gauge data from USGS. They use a “low river” status measure that affects a grain market once the river gauge height falls below negative five feet and is weighted by the distance between a grain elevator and the closest public Mississippi River port. They find that when the river stream gauge in Memphis, Tennessee reads -5 feet, Arkansas soybean basis weakens (widens) by $0.58 per bushel, $0.29 per bushel, and $0.12 per bushel for grain markets that are 5 miles, 10 miles, and 25 miles from the closest Mississippi River port, respectively. Similarly, they find that Mississippi soybean basis weakens (widens) by $0.55 per bushel, $0.28 per bushel, and $0.11 per bushel for the same distances to grain markets. Figure 1 below shows the degree of the impact of low river levels on soybean basis in Arkansas with markets near the river experiencing weaker basis than of those further from the river.
Figure 1. Impact of Low Mississippi River Levels on Soybean Basis in Dollars per Bushel in Arkansas
References
Biram, Hunter, John Anderson, Scott Stiles, and Andrew McKenzie. “Low Water Levels in the Mississippi River Result in Abnormally Weak Soybean Basis“. Southern Ag Today 2(45.1). October 31, 2022. Permalink
Biram, Hunter, James L. Mitchell, and H. Scott Stiles. “Low Rivers Levels on the Mississippi River: Not the Three-Peat We Want.” Southern Ag Today 4(39.3). September 25, 2024. Permalink
Gardner, Grant, Hunter Biram, and James Mitchell. “Low River Levels, Barge Freight, and Widening Basis.” Southern Ag Today 3(39.1). September 25, 2023. Permalink
Mitchell, J. L., & Biram, H. D. (2025). The effects of extreme weather on rural transportation infrastructure and crop prices along the Lower Mississippi River. Applied Economic Perspectives and Policy.
Biram, Hunter, and James L. Mitchell. “Estimating the Impact of Low Mississippi River Levels on Soybean Basis in the Midsouth.” Southern Ag Today 5(12.3). March 19, 2025. Permalink