Author: John Robinson

  • Some Quirky Aspects of Cotton Marketing

    Some Quirky Aspects of Cotton Marketing

    This article highlights some differences between U.S. cotton and other ag commodity markets. The subject really involves the nexus of politics and economics.  There is a long history of government regulation of commodity markets. A textbook example is the Onion Futures Act of 1958 which banned trading of onion futures (and which was the basis for subsequent studies of efficient markets by Working[i] and Gray[ii]).  

    Our cotton example begins in 1929 when the U.S. Congress singled out cotton in a notable policy restriction.  It seems that two years earlier, one of USDA’s routine monthly forecasts had projected lower cotton prices.  When this forecast proved accurate, some in the cotton industry assumed that the forecast caused the price decline. This led to a political reaction where the USDA was banned from forecasting (only) cotton prices, a policy that remained in place until the 2008 Farm Bill.  

    Cotton was unique in dropping out of Title 1 commodity programs in the 2014 Farm Bill, only to come back in 2018 with “seed cotton” as a new, covered commodity in the Bipartisan Budget Act of 2018.  Space does not allow an adequate discussion of the underlying events of that story.

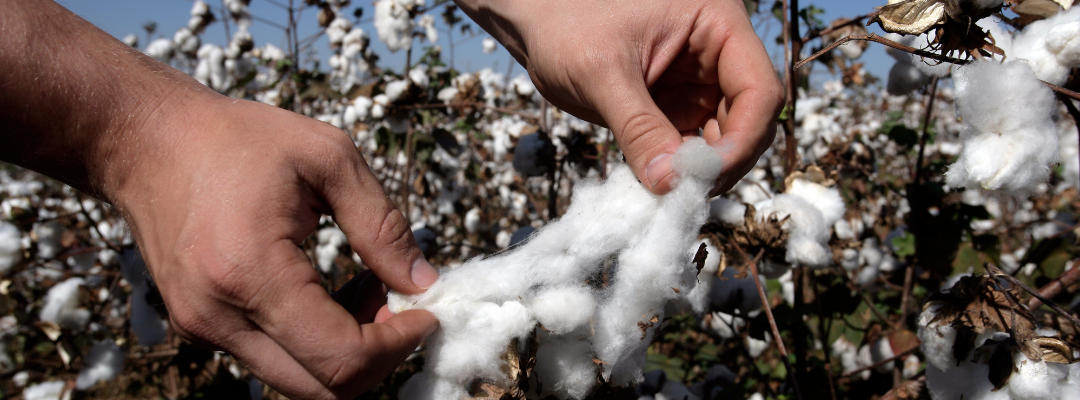
    A unique reporting requirement of U.S. cotton since the 1950s is the CFTC Cotton On-Call report (https://www.cftc.gov/MarketReports/CottonOnCall/index.htm ).  This is a weekly report of merchant on-call (i.e., basis contract) transactions reflecting purchases from farmers and sales to textile mills that are unfixed with ICE futures, presented by delivery month.  These data are potentially informative in identifying large, hedged positions in ICE cotton futures (see the peaks of the red line in Figure 1).  This market transparency could benefit suppliers and smaller merchandisers and market analysts, but in some cases it could lead to speculative trading on anticipated short covering prior to futures contract expiration (https://southernagtoday.org/2021/12/current-squeeze-dynamics-in-ice-cotton-futures/ ).  

    Why have these different policies existed for cotton? One reason is the historical dominance of southern politicians during the 20th century.  Thus, if the cotton grower segment was angry at USDA, even mistakenly, they had the political power to have something done about it for a southern crop like cotton.  The global aspect of cotton is another feature that brought about the trade talk attention, the Doha Round, and the WTO case, which precipitated cotton leaving and returning to federal farm programs. Finally, some cotton-specific regulations may have to do with the concentration of the cotton merchandising sector, relative to grains.  Compared to grains, the U.S. cotton market is dominated by a handful of global merchandising firms.  The cotton on-call reporting requirement originated as a way for the cotton merchant sector to report their futures transactions as legitimate hedges, which they are. Curiously, it is the cotton merchant sector that now opposes the collection and publication of the cotton on-call data, which they consider proprietary (https://acsa-cotton.org/wp-content/uploads/2020/05/ACSA-Position-Limits-Comment-Letter.pdf).  The merchant sector also has had an ongoing concern since 2008 with excess speculation in ICE cotton futures.  This may explain their opposition to publication of cotton on-call data.  


    [i] Working, Holbrook (1960-02). “Price Effects of Futures Trading.” Reprinted from Food Research Institute Studies, Vol. 1, No. 1, February 1960, in Selected Writings of Holbrook Working, Anne E. Peck, ed., Chicago Board of Trade, 1977. pp. 45–71.

    [ii] Gray, Roger.  1963. “Onion Revisited.” Journal of Farm Economics,. Vol. 45, No. 2, May 1963.

    Robinson, John. “Some Quirky Aspects of Cotton Marketing“. Southern Ag Today 2(27.1). June 27, 2022. Permalink

  • Forward Pricing with Options on ICE Cotton Futures

    Forward Pricing with Options on ICE Cotton Futures

    A producer’s marketing plan is a contingency plan to sell a commodity in the context of price risk. Cotton prices have been in a long term up-trend, with considerable volatility in recent weeks (see the blue line in Figure 1). A typical marketing goal would be to sell commodities at relatively higher prices, or (conversely) protect un-sold commodities from down-side price risk.  

    One way to reduce the risk of lower prices is to forward cash contract portions of expected production.  However, drought-elevated production risk in 2022, coupled with uncertain plantings, uncertain yield impacts from reduced fertilizer usage due to higher fertilizer prices, inverted futures markets, likely price volatility, and higher costs of financing have all likely led cotton merchants to limit their forward cash contract offerings.

    Futures hedging by selling ICE cotton futures contracts is another approach to set a price floor, subject to basis risk. However, the possibility of higher trending futures has raised the actual and potential margin risk of futures hedging.  In addition, futures hedging sacrifices any benefit of potentially selling at higher cash prices if the market continues to rise.

    Put options are one way to lock-in high price levels without margin calls or sacrificing upside flexibility. A put option gives the buyer the right, but not the obligation, to sell cotton futures at a certain price. In Figure 1 below, Dec’22 cotton futures (the blue line) have trended higher since 2021. As of May 3, the Dec’22 futures settled at 126.18 cents per pound. While this has happened, the premium for put options on Dec’22, like the $1.20 put option graphed in red, have gotten cheaper over the long term. The $1.20 put option means that the buyer of this put option has the right to sell Dec’22 cotton futures at $1.20 per pound.  Note that hedgers have flexibility in the price coverage level by being free to choose from different strike prices.

    Put options at a given strike price cost less in a rising market because the put option gives the right to have sold Dec’22 futures at $1.20, which has intrinsic value only when the underlying futures price is below $1.20.  Therefore, put option premiums move opposite to the direction of the underlying futures price.  This is important because an increasing put option premium can act as an insurance payment against falling futures and falling cash prices (assuming a stable cash basis).  The insurance analogy is important since nobody knows the direction of futures prices for certain.  And unlike other forms of insurance, put options can be offset when they are no longer needed, e.g., when the crop is sold in the cash market, giving hedgers a chance to recover  some of their initial expense in option premiums.

    At 9.71 cents per pound (as of May 3), buying a $1.20 put option on Dec’22 ICE futures is essentially buying the right to a 110.29 cent short futures ($1.20-$0.0971) position, without the margin call exposure and without removing upside potential if markets continue to strengthen.   Waiting to implement this strategy could be beneficial, i.e., more affordable, if ICE cotton futures continue to rise, which they might.  So hedging portions of expected production with put options over the next several months might be a good way to dollar-cost-average decent hedged prices.

    Figure 1. Dec’22 ICE Cotton Futures Settlement Price (in Blue) vs. Associated 120 cent Put Option Premium (in Red).

    Daily

    July 28, 2021 – May 3, 2022

    Robinson, John. “Forward Pricing with Options on ICE Cotton Futures“. Southern Ag Today 2(22.1). May 23, 2022. Permalink

  • Milestone Indicators of U.S. Cotton Supply and Demand

    Milestone Indicators of U.S. Cotton Supply and Demand

    It is generally the case that the U.S. cotton market is influenced by aggregate production uncertainty.  One reason for this is that a majority of the U.S. acreage is planted in Texas (Figure 1), with much of that under dryland conditions contributing to historical abandonment rates between 4% and 62% statewide.  In drought years like the current one, this production risk is only heightened.  The management of this risk is potentially helped by publicly available market information data.

    The first upcoming major information source is the May 12th USDA “World Agricultural Supply and Demand Estimates” (WASDE) report published by the USDA’s World Agricultural Outlook Board (https://www.usda.gov/oce/commodity/wasde ).  The May report is notable for publishing USDA’s first official, comprehensive projections of U.S. and world crop supply and demand variables.  Historically, the May WASDE report tends to be closely watched and is frequently associated with cotton market volatility.

    Like other crops, U.S. cotton is monitored by weekly crop condition reports and crop progress reports (on Mondays) from USDA’s National Agricultural Statistics Service (NASS, https://www.nass.usda.gov/).  Because cotton is a perennial bush in its native habitat, its growth and response to stress are different from annual grain crops.  Hence there is less correlation between weekly crop conditions and progress for cotton yield outcomes compared to grains.  Nevertheless, the news media and some market analysts pay attention to these weekly observations between the major report milestones.

    June 30th “Planted Acreage” is another closely watched major report that is conducted by USDA/NASS.  This report is sometimes associated with market volatility when it contradicts expectations based on the March 31st “Prospective Plantings report from USDA.  USDA’s Farm Services Agency (FSA) provides supplemental acreage information with periodic certified acres data through the summer (https://www.fsa.usda.gov/news-room/efoia/electronic-reading-room/frequently-requested-information/crop-acreage-data/index ). 

    For U.S. cotton, the September WASDE report represents the first extensive proven yield sampling for areas outside of South Texas, in addition to grower interviews.  This sample-based production estimate is refined in subsequent WASDE reports through December, as well as with data on cotton ginnings.  The uncertainty about cotton yield may be further exacerbated in 2022 from restricted input applications.  For example, anecdotal evidence of reduced quantities of nitrogen fertilizer applications (due to the higher cost) could contribute to lower-than-average yields.   The resulting yield effect from fewer inputs might not be realized until the ginnings data in November.  Hence, this season could involve extended price volatility beyond the normal resolution of weather market uncertainty.

    Robinson, John. “Milestone Indicators of U.S. Cotton Supply and Demand“. Southern Ag Today 2(20.1). May 9, 2022. Permalink

  • Indirect Effects of the Eastern European Conflict on Cotton

    Indirect Effects of the Eastern European Conflict on Cotton

    The conflict between Russia and Ukraine has direct implications on the global supply of corn and wheat because of the relatively large quantities of those crops that those two countries produce and export. It is not surprising then that grain futures have risen sharply since the conflict began.

    Neither Russia nor Ukraine are importers or exporters of cotton.  So, the war and potential disruption of Black Sea shipping should have little direct effect on cotton trade.  The impact on world cotton markets is more indirect, with a cotton price impact delayed and uncertain. 

    Relative prices of major U.S. crops have changed since the conflict began.  For example, during January and early February, the ratio of CBOT Dec’22 corn to ICE Dec’22 cotton futures ranged between 5.7 and 5.9.  Historically that outcome would have been associated with 12 to 13 million acres of all U.S. cotton planted (Figure 1).  Such a level conforms to the early grower surveys of intended plantings, and also to USDA’s Outlook Forum forecast of U.S. cotton planted acreage.

    More recently, however, as corn prices have risen, the corn: cotton futures price ratio has shifted higher, e.g., as of March 14, it was 6.3 (see Figure 1).  The associated level of cotton acreage is roughly a million fewer acres compared to predictions from earlier in the year. 

    Now, the previous change can only happen if growers have enough time and the right technology (e.g., herbicide programs, seed availability) to adjust crop mixes at this late date.  This point highlights the generally uncertain outlook picture for 2022.  Assuming fewer cotton acres, the result would tighten up the U.S. cotton balance sheet and support summertime futures prices at higher levels than previously expected.  Over the past 10 years, U.S. cotton has been responsible for a third of global cotton exports. The weather market volatility implied by the drought in the southern plains could be significant for prices and be further exacerbated by uncertainty about input decisions.  The latter includes fuel and potash fertilizer, the costs of which could rise directly from trade disruptions out of Russia.

    Robinson, John. “Indirect Effects of the European Conflict on Cotton“. Southern Ag Today 2(15.1). April 4, 2022. Permalink

  • U.S. Cotton Planted Acres

    U.S. Cotton Planted Acres

    Production and supply of a crop is a critical component for the market outlook for every marketing year.  For the cotton crop, U.S. planted acreage outcome is a major part of the global cotton production and supply.

    Grower surveys are one common method for predicting cotton planted acreage. One of the earliest publicly available grower planting intentions surveys is measured in December by Cotton Grower magazine and published in early January.  Similarly, the National Cotton Council measures grower intentions in the weeks before and after New Year’s Day and publishes the result in February.  In 2022, these two surveys measured 12.5 million and 12.0 million planted acres of U.S. all cotton (upland and Pima combined), respectively.  USDA will subsequently measure grower planting intentions in March, and then survey planted acreage in June.

    A second approach to predicting cotton plantings is by focusing on the relative price of competing crops.  In the eastern half of the Cotton Belt, cotton competes largely with corn, soybeans, and peanuts.   In the Southern Plains region, the major alternatives are corn, sorghum, and wheat-fallow.  A simple method for predicting cotton plantings is, for example, matching the ratio of new crop corn and cotton future prices to U.S. cotton plantings (Figure 1). So far, the Dec’22 CBOT corn/Dec’22 ICE cotton futures price ratio has been ranging between 5.7 and 5.9 during the first quarter of 2022.  Assuming the price ratio stays at that level, history suggests an outcome of between 12 and 13 million planted acres of U.S. all cotton (see Figure 1). This is similar to the early surveys of growers.

    Note that the dryer-than-normal conditions in the central and western Cotton Belt, along with an insurance price above $1.00 per pound, could add 500,000 to 1,000,000 planted acres in the Southern Plains region, albeit with uncertainty in the abandoned acres at the end of the season due to possible drought impacts.

    Assuming 13 million planted acres in the U.S. with an average/higher abandonment (20%) and 10-year average yield (850 lbs), the U.S. would produce over 18 million bales of cotton in 2022, with over 21 million bales of supply.  Assuming U.S. domestic spinning is 2.6 million bales and U.S. exports are 15 million bales, the result could be another year of U.S. ending stocks around four million bales.  That year-over-year change in ending stocks would be considered price neutral.  This year that suggests that new crop futures prices may be fundamentally supported at historically high levels, with weather market speculation providing additional upside volatility.

    Figure 1. Ratio of December Corn/Cotton Futures and All Cotton Planted Acreage in the United States

    Note: Author calculations based on future prices that are the three-month average in the first quarter every year for each crop. The number above the dot in this figure represents each year from 2001 to 2021.

    Robinson, John. “U.S. Cotton Planted Acres“. Southern Ag Today 2(11.1). March 7, 2022. Permalink