In a previous article, we wrote about How U.S. Tariff Rates Compare to Other WTO Countries using weighted average tariff rates. The tariff rates discussed in that article are the Most Favorable Nations (MFN), which are the tariff rates applied to WTO members. However, many WTO countries also have other bilateral or multilateral trade agreements such as USMCA, CAFTA-DR, and Mercosur, to name a few. Participating countries in those trade agreements negotiate lower or preferential tariff rates among themselves using the MFN tariff rates as the starting point. In this article, we will examine the tariff rate reciprocity between the U.S. and its top five agricultural trading partners. This issue is especially important given the recent announcement by the President to increase U.S. tariffs to “reciprocal” levels.
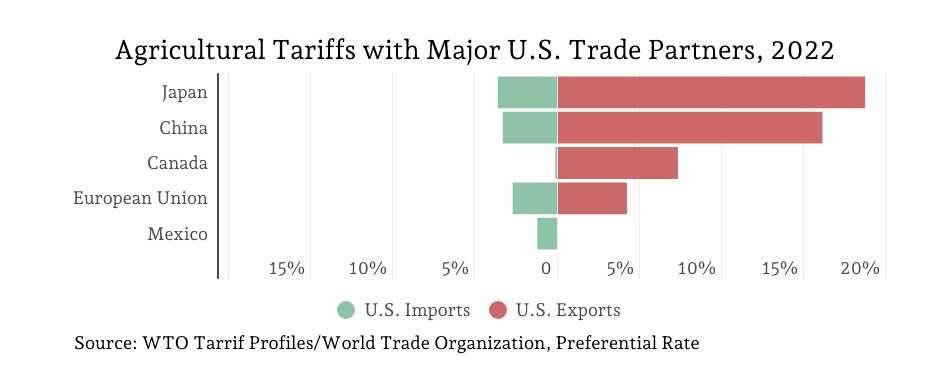
Out of the top five agricultural trading partners, the United States has a trade agreement with Canada and Mexico—called the United States-Mexico-Canada Agreement—and with Japan—called the U.S.-Japan Trade Agreement. The United States had a two-year trade agreement with China in 2020 and 2021, and no trade agreement exists between the United States and the EU. The figure below shows the preferential weighted average tariff rate the United States charges for agricultural products imported from its top trading partners in green. On the other hand, the right side of the figure, in red, shows the preferential weighted average tariff that trading partners impose on U.S. agricultural exports. Finally, the table shows the value of U.S. agricultural imports and exports to and from each trading partner, the preferential weighted average tariff rate, and the differential, i.e. imports minus exports tariff rates. In other words, the difference between the U.S. tariffs on imported products minus the tariff the importing country imposes on U.S. exports. If the differential is negative, it means that the trading partner imposes a higher tariff rate than the United States. To illustrate, the United States imposes a 0.1% tariff on agricultural products from Canada while Canada imposes a 7.3% tariff on U.S. agricultural products, resulting in a tariff rate differential of -7.2 %. Similarly, the United States imposes a 3.3% tariff on Chinese agricultural products while China imposes a 16.1% tariff on U.S. agricultural products (tariff rate differential of -12.8%). Focusing solely on agricultural trade, the United States has a negative tariff rate differential with all trading partners ranging from -1.5% to -15.1%. Mexico is the only exception where U.S. tariffs are relatively larger (1.2% tariff rate differential).
(Note: In this article, we are addressing applied tariffs and not Non-Tariff Measurements (NTMs), which can be a considerable trade barrier mechanism.)

Ribera, Luis, and Landyn Young. “Do Major U.S. Ag Trading Partners Apply Tariff Reciprocity?” Southern Ag Today 5(8.4). February 20, 2025. Permalink