Historically, U.S. agricultural trade has experienced a trade surplus, where exports are higher than imports (Figure 1.). In fact, since 1989 which is as far back as USDA Foreign Agricultural Service (FAS) Global Agricultural Trade System (GATS) has available data on agricultural trade, there were only two years with agricultural trade deficit, imports higher than exports, 2019 and 2022. USDA FAS expects that 2023 not only will show a trade deficit, but that the trade deficit will be increasing over time. The trade deficit was $3.5 billion in 2022 and it is expected to be $16.7 billion and $30.5 billion in 2023 and 2024, respectively (official 2023 numbers will be reported in February 2024).
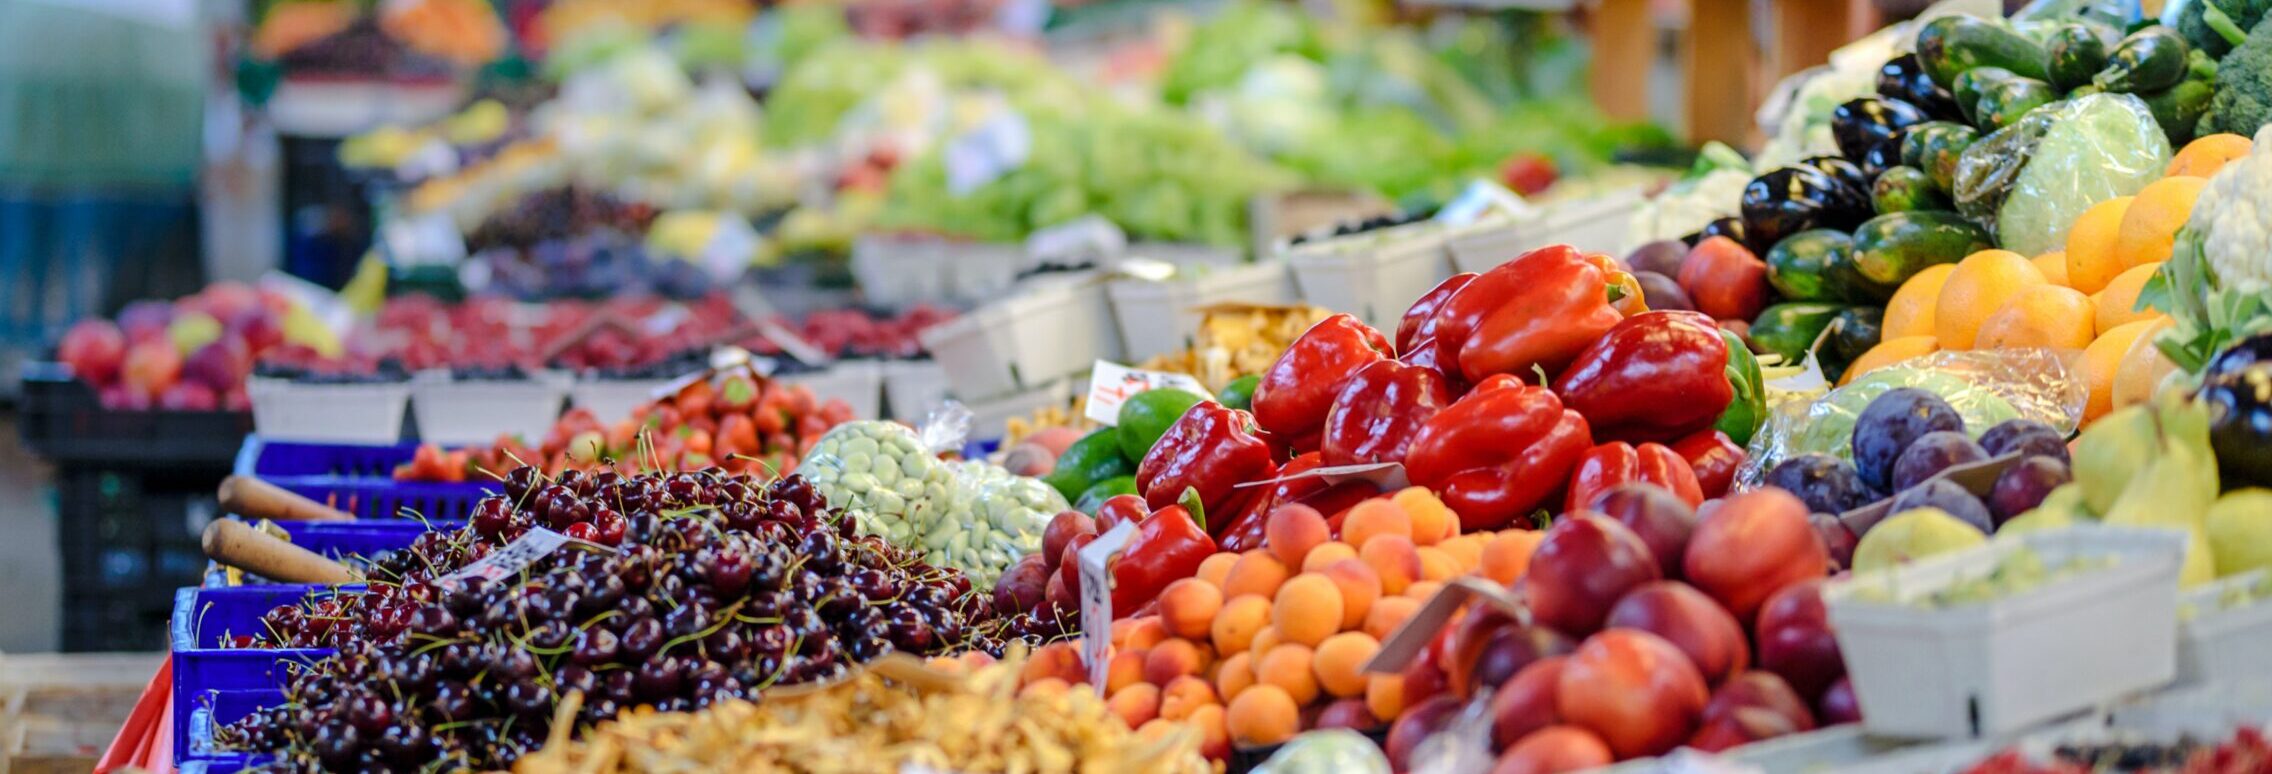
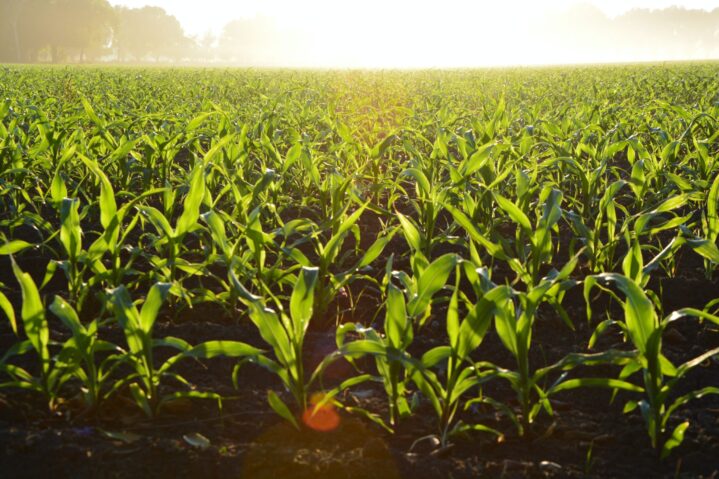
However, when U.S. agricultural trade is presented in volume as opposed to value, the story is very different (Figure 2). The U.S. has never experienced a trade deficit and is very far from experiencing one where exports to imports ratio has been 3.2 over the last 10 years. The main difference between value and volume in agricultural trade is the agricultural products that the U.S exports and imports. The main U.S. agricultural products exported are soybeans, corn and wheat and they are sold for the most part in bulk. On the other hand, the main agricultural products imported by the U.S. are more high value consumer-oriented products, mainly distilled spirits, wine & wine products, and beer, as well as high value fresh produce such as fresh fruits and vegetables. These imported products are of much higher in value than the exported products and vice versa when volume is used as a measuring unit.
Figure 1. U.S. Agricultural Trade, Billion Dollars

Figure 2. U.S. Agricultural Trade, Million Metric Tons